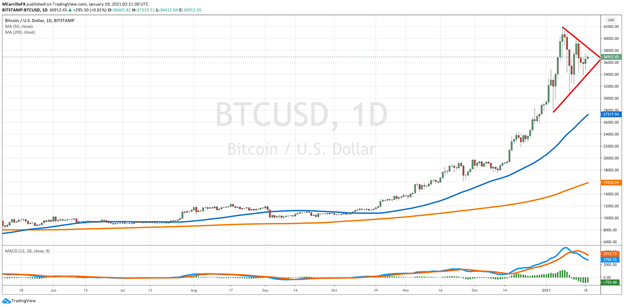
After peaking at its all-time highs at ,000 on January 8, Bitcoin entered a consolidation phase where the cryptocurrency appears to be trading in a symmetrical triangle.BTC/USD fell to 30,000 on January 11, but then it bounced back and, currently, the crypto asset is trading in a range between 34,000 and 40,000. The movement seems to be motivated by a dollar’s recovery from near three-year lows.BTC/USD daily chartA government-powered rally for BitcoinOn US election day, each Bitcoin was bought and sold around 13,000. However, after the election of Joe Biden as the United States president, the crypto asset started a multi-month rally that brought the unit to its all-time highs at 42,000.The interest in Bitcoin jumped to historical levels. According to CoinMarketCap, Bitcoin’s market cap
Topics:
Live Bitcoin News considers the following as important: Press Release
This could be interesting, too:
Chainwire writes Coinshift Launches csUSDL, Announces Strategic Partnerships
Chainwire writes Ike Goes Live on Mainnet: Unlocking Liquid Staking on Aleph Zero
Chainwire writes USDC and CCTP to launch on Aptos, with Stripe adding Aptos support in crypto products
Chainwire writes Fueling KYVE’s Expansion Era: A New Age of Interoperable Data Opportunities For All
After peaking at its all-time highs at $42,000 on January 8, Bitcoin entered a consolidation phase where the cryptocurrency appears to be trading in a symmetrical triangle.
BTC/USD fell to 30,000 on January 11, but then it bounced back and, currently, the crypto asset is trading in a range between 34,000 and 40,000. The movement seems to be motivated by a dollar’s recovery from near three-year lows.

BTC/USD daily chart
A government-powered rally for Bitcoin
On US election day, each Bitcoin was bought and sold around 13,000. However, after the election of Joe Biden as the United States president, the crypto asset started a multi-month rally that brought the unit to its all-time highs at 42,000.
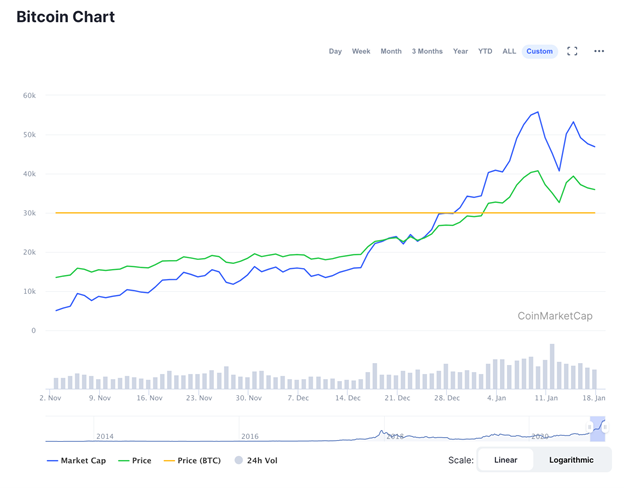
The interest in Bitcoin jumped to historical levels. According to CoinMarketCap, Bitcoin’s market cap went from $254B on November 3, to $770B on January 8; it almost tripled in just two months. Also, the daily volume soared from 27B to 64B.

Bitcoin Market Cap Nov 3 – Jan 18
A significant catalyst for the almost 200 percent rally was the democratic victory and their willingness for a bigger fiscal stimulus package. In that framework, further stimulus announcements dragged the US dollar down, while pushing its counterparts, including Bitcoin, up.
However, in the last days, the US dollar is showing signs of resilience. According to some experts, the greenback has fallen too much too fast. Besides, markets are on risk aversion mode during the week of Joe Biden’s inauguration as president and investors close USD short positions, hurting bitcoin prices.
However, while you decide how to buy and sell bitcoin, most experts consider that the BTC rally is here to stay and a new leg is just about to start.
Will the BTC/USD be above $100K by mid-year?
Investment firm and hedge fund Pantera Capital highlighted in a recent note to their clients that the Bitcoin halving is a critical event that will push the BTC price to further highs in the long term.
“Halvings have a HUGE impact — but — it takes a couple of YEARS to see the full impact,” the Pandora Blockchain Letter of January 2021 said. “It’s had some slow months, but it’s currently right on track. Will bitcoin reach $115,212 by August 1?”
Pandora’s model projects BTC/USD surpassing the 50,000 level in February, and the 100,000 milestone by July 15, 2021. The peak would be on August 1, 2021, at $115,212
External factors fueling the Bitcoin rally
Finally, the BTC/USD price is not only fueled by the halving and the stimulus packages in the United States and Europe, but also for institutional investors.
While retail investors fundamentally fueled the previous Bitcoin rally, institutional investors and smart money drive the bullish interest this time. Banks such as JPMorgan, Morgan Stanley and Goldman Sachs are betting on BTC today.
According to the experts, BTC/USD is ready to extend its rally once the consolidation phase finishes. Now, let’s take the symmetrical triangle as a framework.
The technical strategy suggests that an upside break in a symmetrical triangle should be followed by a run of the same size of the distance between the bottom of the triangle and the break level.
Image by Pete Linforth from Pixabay
