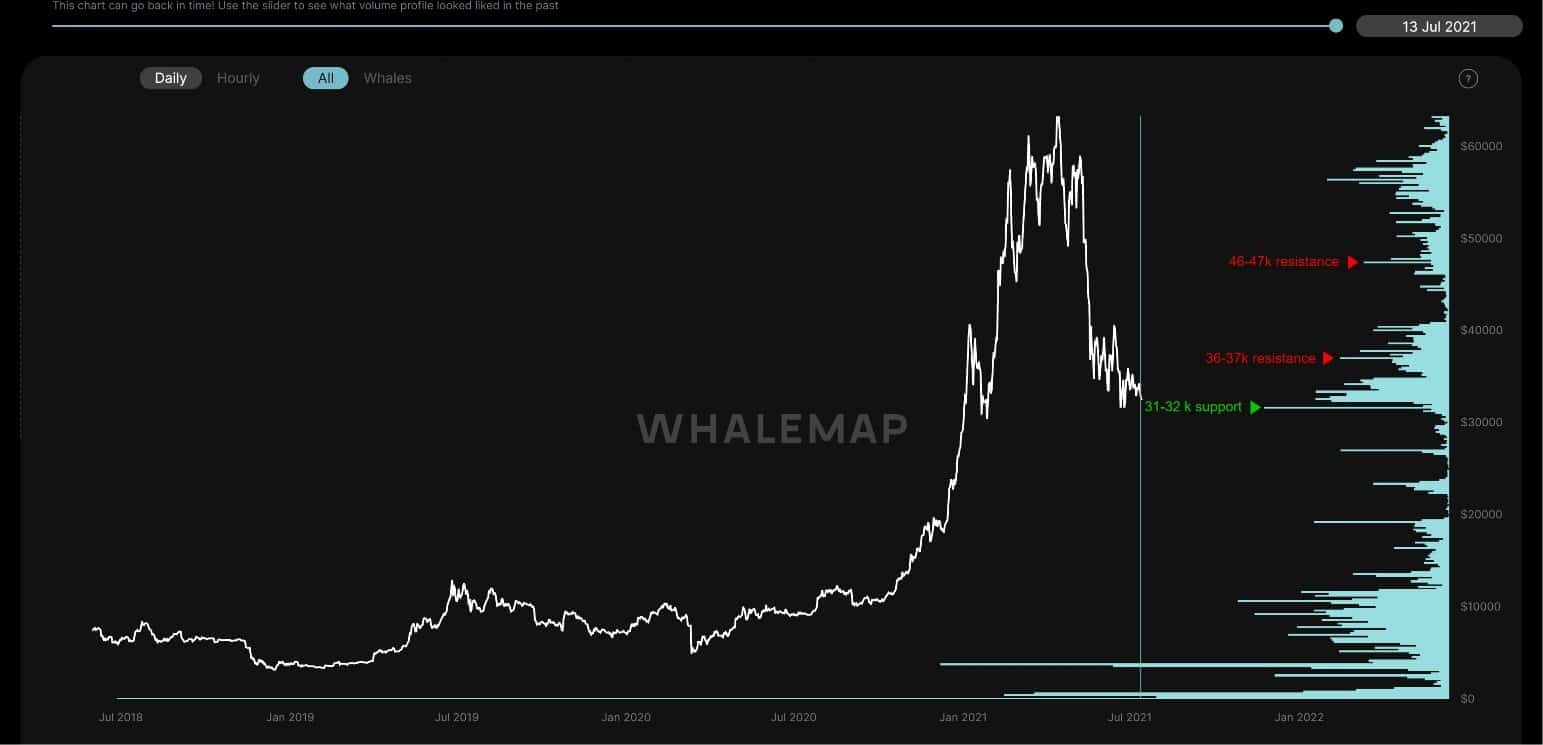
Going through the most significant price pullback in this cycle, approximately 55% from the all-time high set in April, there is considerable uncertainty in the Bitcoin market from technical and on-chain analysts’ perspectives. Figure 1– Bitcoin daily price history since December 2020. Chart by Glassnode The following analysis is compiled by on-chain analyst CryptoVizArt for CryptoPotato, and looks into the on-chain side of the story to evaluate the bullish/bearish signs. Lowest Fund Flow to and from Exchanges (Bearish) Following the recent price drop, the All Exchanges Fund Ratio (the ratio of BTC transfers involving all exchanges to BTC transfers network-wide) has dropped to the lowest level since October 2020. Historically, when this metric rises, it means an increase
Topics:
George Georgiev considers the following as important: AA News, Bitcoin (BTC) Price, BTCEUR, BTCGBP, btcusd, btcusdt
This could be interesting, too:
Chayanika Deka writes Yuga Labs Secures Major Win as SEC Closes Investigation Without Charges
Andrew Throuvalas writes Bitcoin Soars Back To ,000 After BlackRock CEO Says “Buy The Dip”
Chayanika Deka writes XRP, SOL, and ADA Inclusion in US Crypto Reserve Pushes Traders on Edge
Chayanika Deka writes Why Arthur Hayes Is Bullish on Bitcoin Under Trump’s Economic Strategy
Going through the most significant price pullback in this cycle, approximately 55% from the all-time high set in April, there is considerable uncertainty in the Bitcoin market from technical and on-chain analysts’ perspectives.
The following analysis is compiled by on-chain analyst CryptoVizArt for CryptoPotato, and looks into the on-chain side of the story to evaluate the bullish/bearish signs.
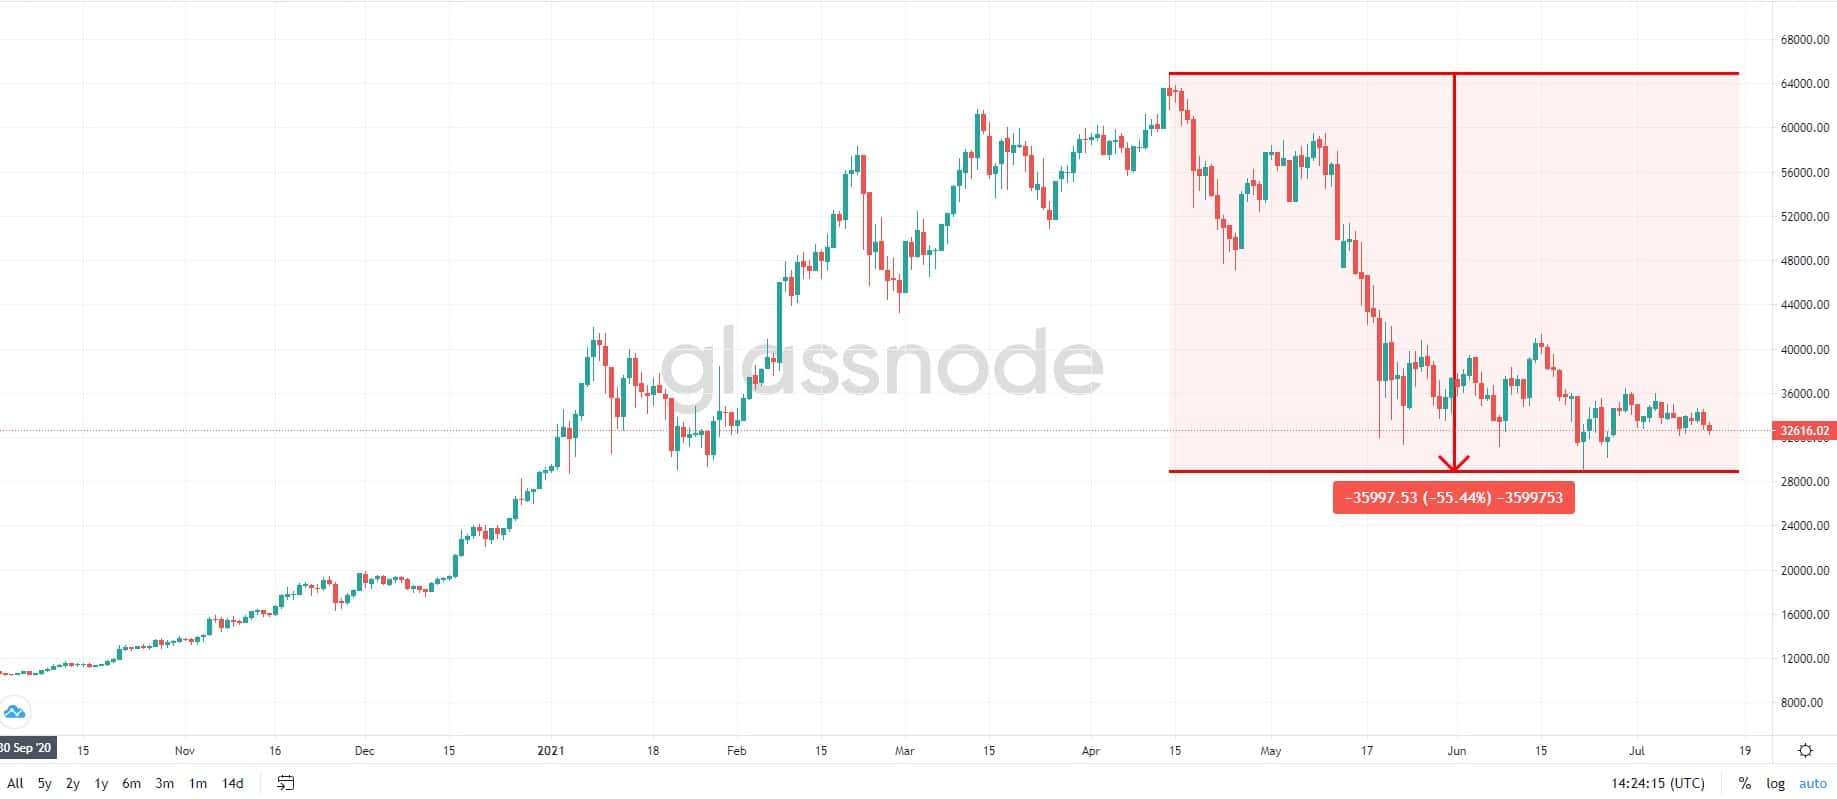
Lowest Fund Flow to and from Exchanges (Bearish)
Following the recent price drop, the All Exchanges Fund Ratio (the ratio of BTC transfers involving all exchanges to BTC transfers network-wide) has dropped to the lowest level since October 2020.
Historically, when this metric rises, it means an increase in market volatility. On the other hand, falling to lower levels indicates that activity of retail stakeholders is much less than OTC deals (Figure 2).
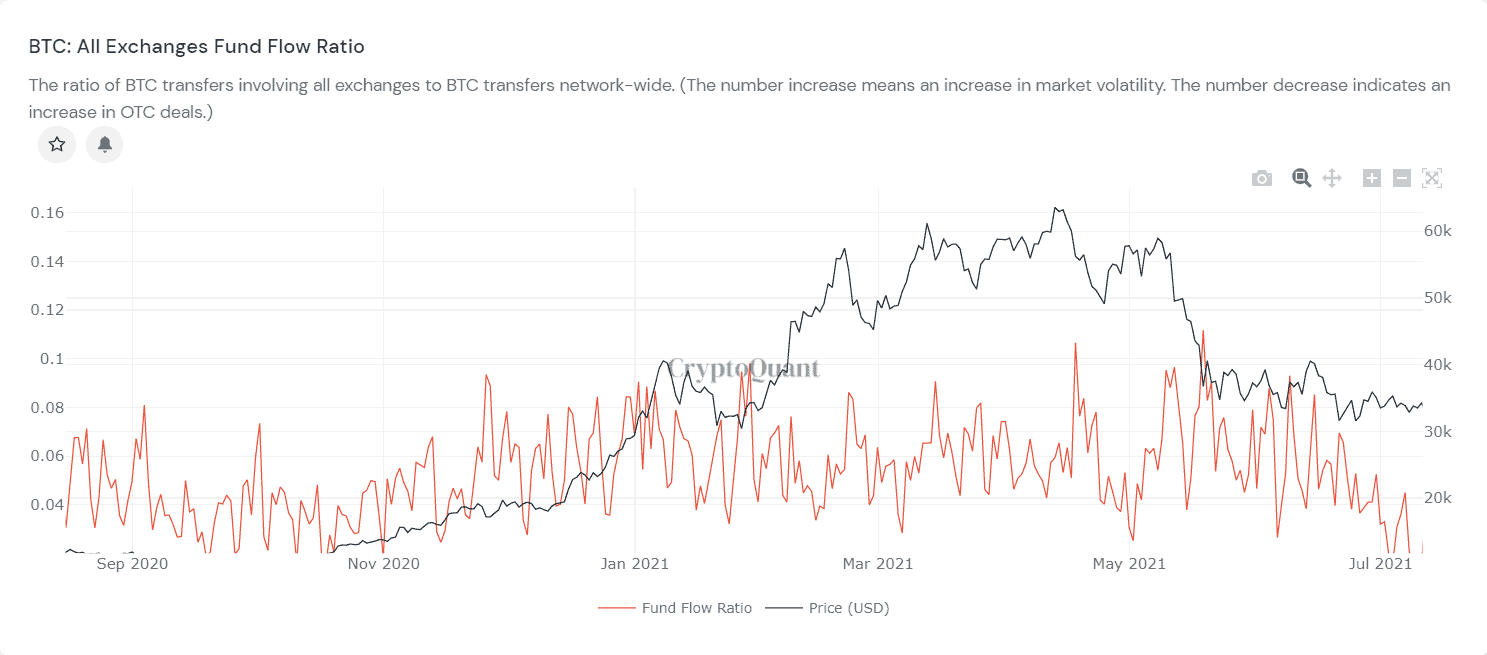
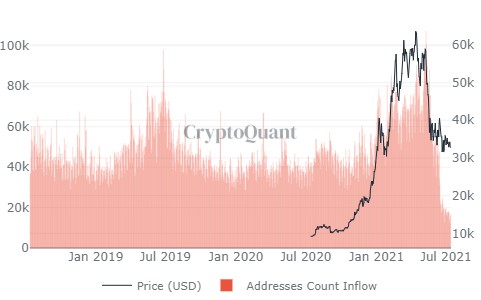
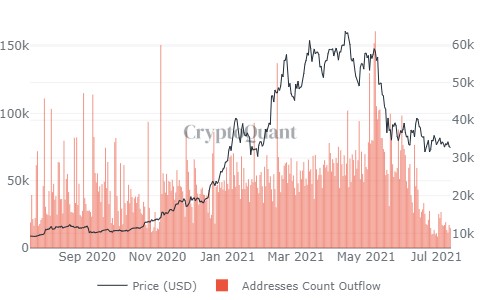
This absence of retail investors in the market (the main driving force in a bull market is this category of investors) can be observed in All Exchanges Inflow/outflow Addresses Count, Figure 03 and 04. Therefore, these investors’ capital inflow is an absolute required element for a price recovery.
Figure 03 and 04 – The number of BTC addresses making inflow (first image) and outflow (second image) transactions to/ from all exchanges’ wallets:
Support and Resistance Levels (Bullish)
Similar to Volume Trading Strategy that employs the trading volume on exchanges to indicate the support/resistance levels, UTXO Realized Price Distribution (URPD) is an on-chain metric that can highlight significant support/resistance areas based on transactions that occurred out of exchanges (URPD illustrates prices at which addresses acquired the current set of Bitcoins on the blockchain).
The ultimate merit of using on-chain is that it empowers traders to check if volume data from exchanges is valid. This extra confirmation tool can validate any conclusions about formed resistance/support levels
Here in Figure 05, it is apparent that after the recent market crash and its following consolidation, a strong support level has been established at the $30-31K level.
The critical point to add here is that support/resistance levels extracted from the on-chain profiles act as a magnetic level, and price fluctuation around them at short time frames should not necessarily be translated as eliminating those levels.
Figure 05 shows at which prices the current set of Bitcoin UTXOs were created, i.e., each bar shows the number of existing bitcoins that last moved within that specified price bucket.