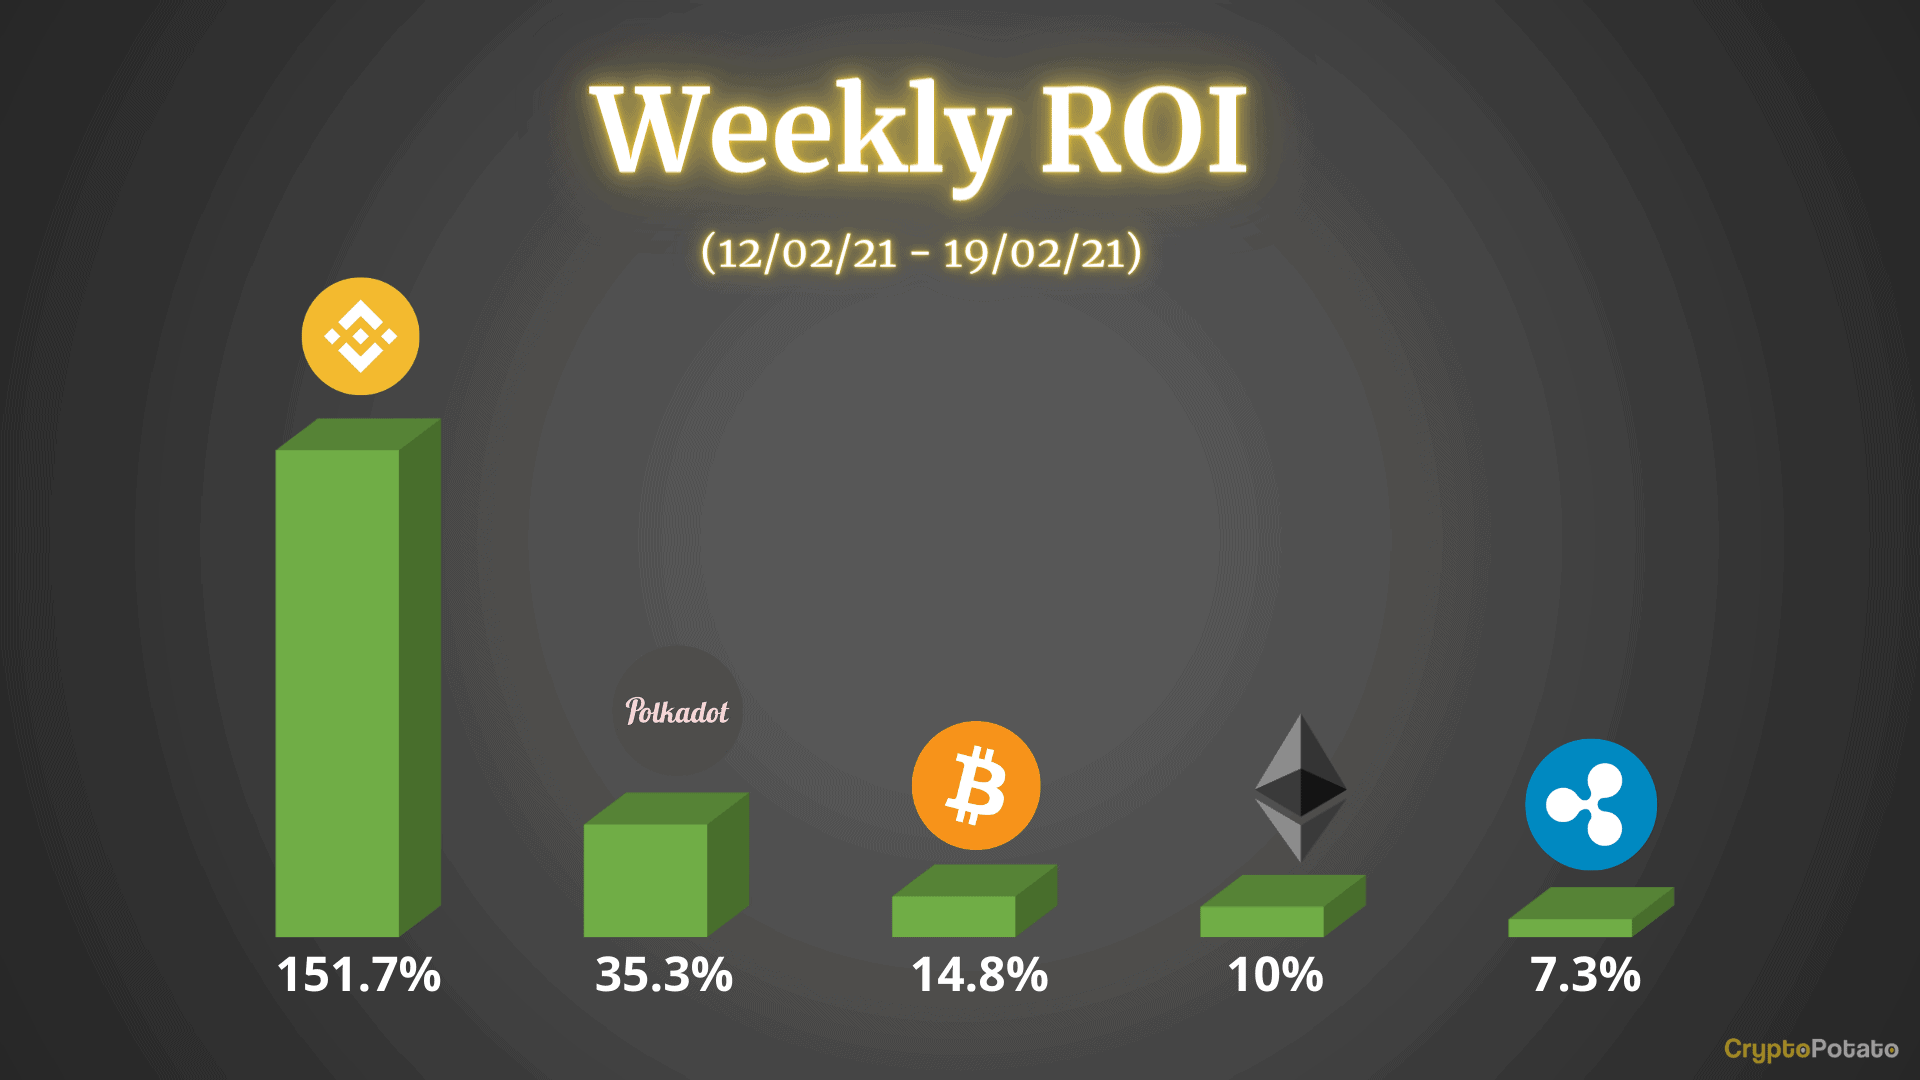
It’s safe to say that the past 7 days were particularly intense on the cryptocurrency market. The cryptocurrency that expanded the most out of the large-caps is Binance Coin (BNB) as it surged by a whopping 150% in a week.BitcoinBitcoin is up by a strong 14.8% this week as the cryptocurrency continues to set new ATH prices today. Last week, it was battling with the resistance at ,570, provided by a 1.414 Fib extension level.This level was only penetrated on Tuesday, which allowed Bitcoin to push higher into resistance at ,365. It stalled here for a couple of days until breaking higher today to set the new ATH price.It is important to note that Bitcoin is trading within an ascending price channel and is approaching this channel’s upper border.Looking ahead, the first strong resistance
Topics:
Yaz Sheikh considers the following as important: Binance Coin (BNB) Price, Bitcoin (BTC) Price, BNBBTC, bnbusd, BTCEUR, BTCGBP, btcusd, btcusdt, DOTBTC, DOTUSD, DOTUSDT, ETH Analysis, ETHBTC, Ethereum (ETH) Price, ethusd, Market Updates, Polkadot (DOT) Price, Price Analysis, Ripple (XRP) Price, XRP Analysis, xrpbtc, xrpusd
This could be interesting, too:
Mandy Williams writes Bitcoin Fear and Greed Index Hits 3.5-Year High: Does it Hurt BTC’s Chances for 0K?
Jordan Lyanchev writes BTC Crash Impending? Jim Cramer Calls Bitcoin a ‘Winner’
Jordan Lyanchev writes How High Can Ripple (XRP) Go With Gary Gensler Out of the Picture? (AI Bots Analyze)
Jordan Lyanchev writes Double-Digit Price Surges From These Altcoins as BTC Was Stopped Before 0K (Weekend Watch)
It’s safe to say that the past 7 days were particularly intense on the cryptocurrency market. The cryptocurrency that expanded the most out of the large-caps is Binance Coin (BNB) as it surged by a whopping 150% in a week.
Bitcoin
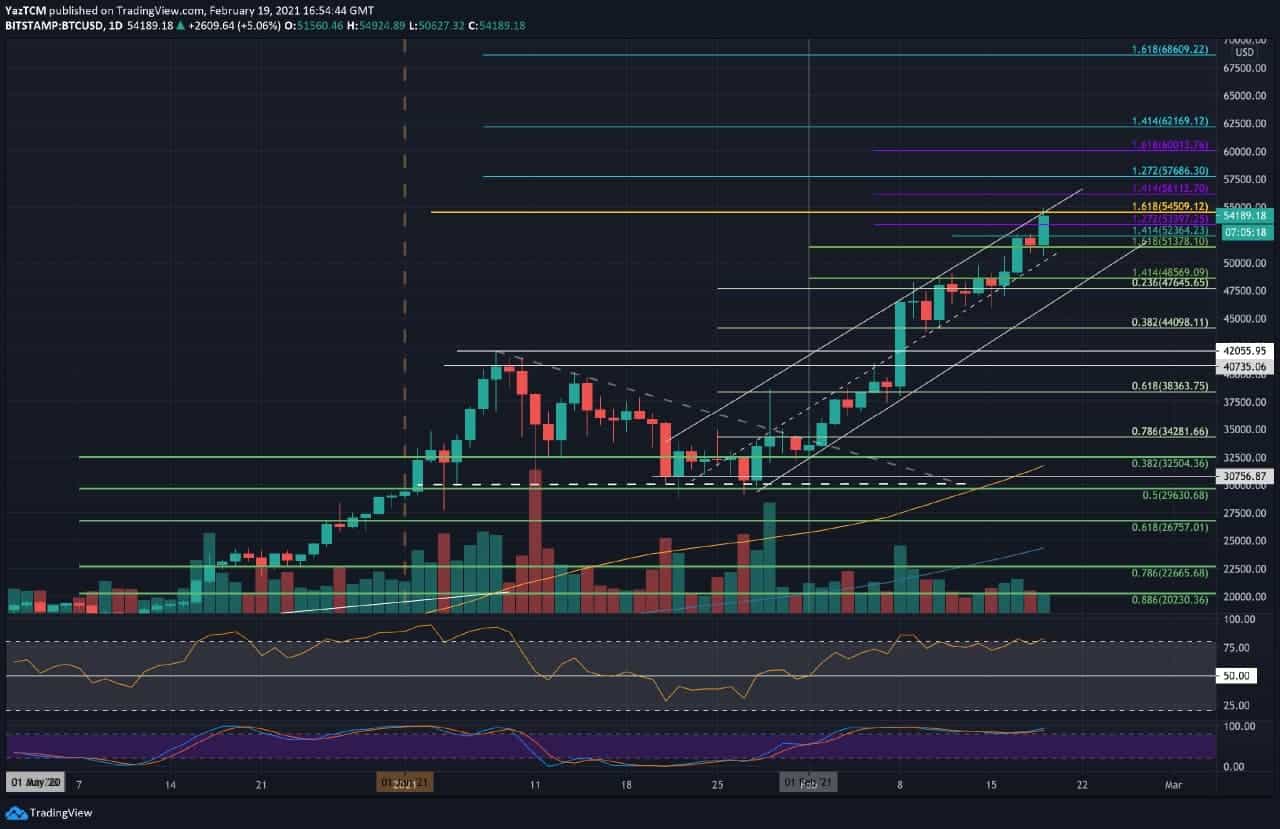
Bitcoin is up by a strong 14.8% this week as the cryptocurrency continues to set new ATH prices today. Last week, it was battling with the resistance at $48,570, provided by a 1.414 Fib extension level.
This level was only penetrated on Tuesday, which allowed Bitcoin to push higher into resistance at $52,365. It stalled here for a couple of days until breaking higher today to set the new ATH price.
It is important to note that Bitcoin is trading within an ascending price channel and is approaching this channel’s upper border.
Looking ahead, the first strong resistance lies at $54,500 (1.618 Fib Extension & upper border of the price channel). This is followed by $56,112 (1.414 Fib Extension – purple), $47,869 (1.272 Fib Extension – blue), and $60,000.
Beyond $60,000, resistance lies at $62,170 and $65,000.
On the other side, the first level of support lies at $51,378. This is followed by $50,000, $47,465 (.236 Fib), $45,000, and $44,100 (.382 Fib).
Ethereum
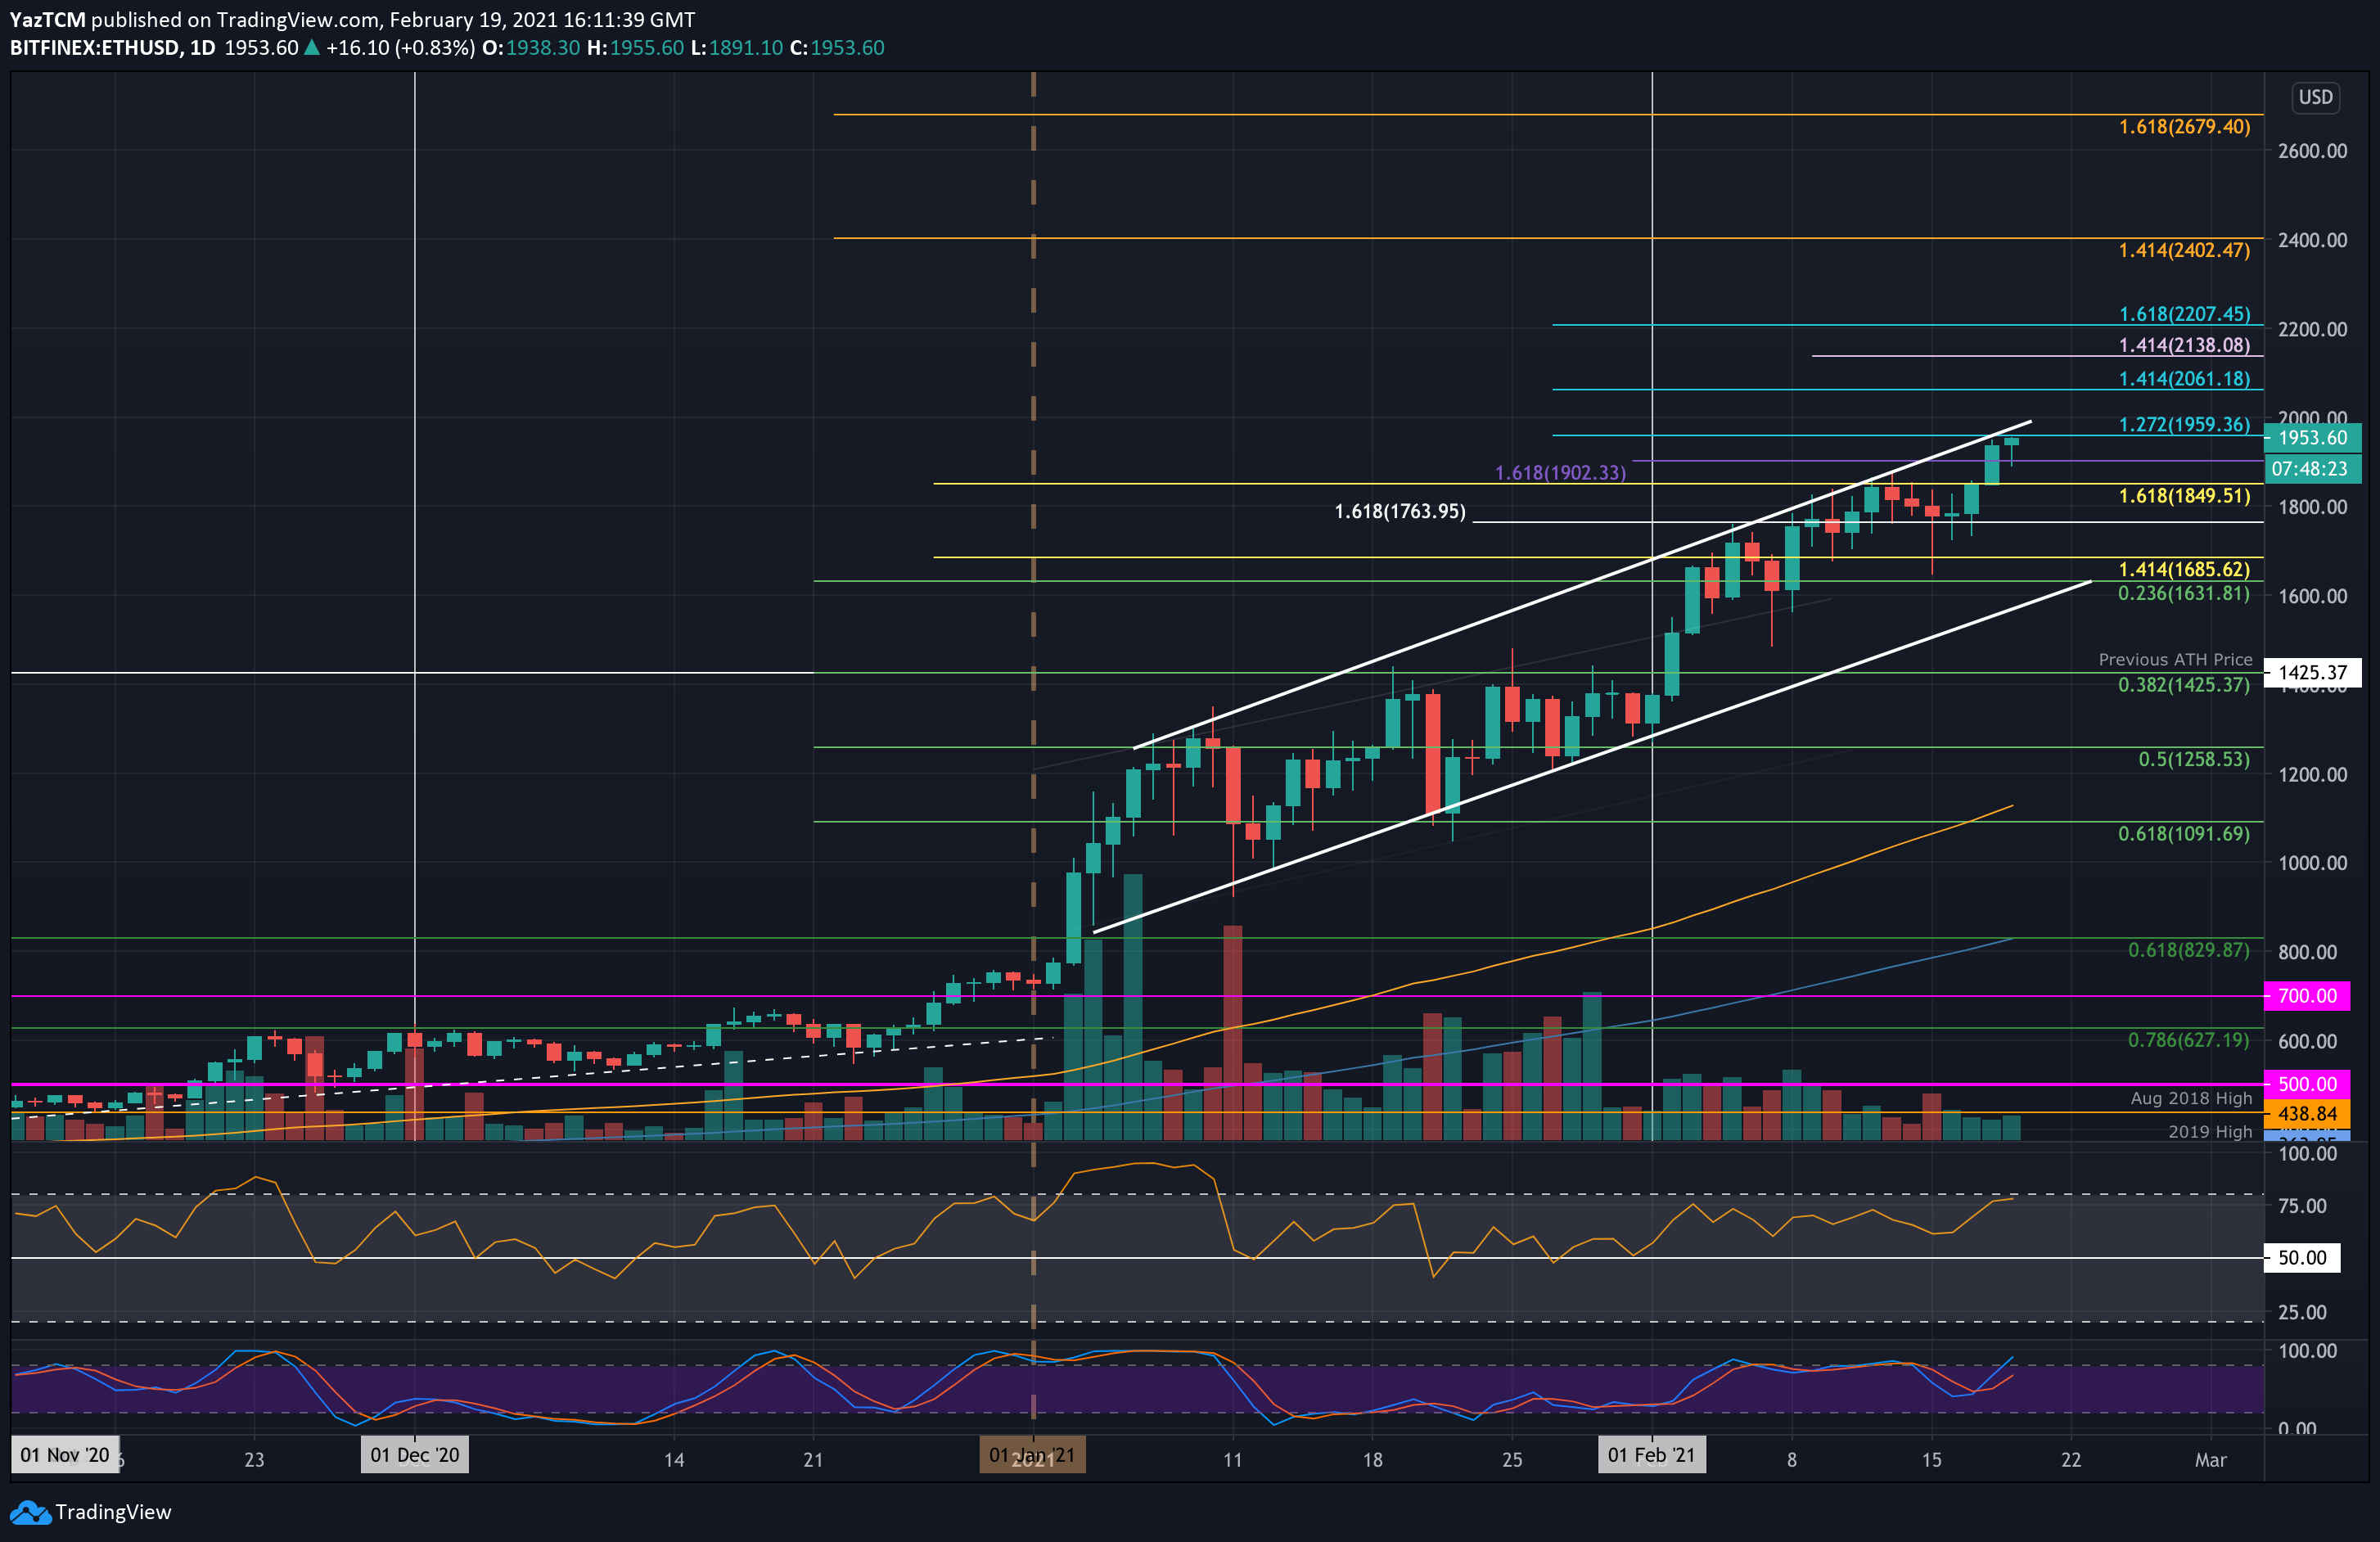
Ethereum is also up this week after it managed to rise by 10% to hit the current $1,960 resistance. ETH is also trading within an ascending price channel, and it had reached resistance at $1,850 last week.
It struggled to break this resistance over the course of the week, and the breakout only occurred yesterday, which allowed ETH to rise to $1,960 (1.272 Fib Extension).
Looking ahead, the first level of resistance lies at $2,000. This is followed by the upper border of the price channel, $2,061 (1.414 Fib Extension), $2,138, and $2,207 (1.618 Fib Extension). Additional resistance lies at $2,400, $2,500, and $2,680.
On the other side, the first support lies at $1,850. This is followed by $1,800, $1,631 (.236 Fib & lower boundary of the price channel), $1,500, and $1,425 (.382 Fib).
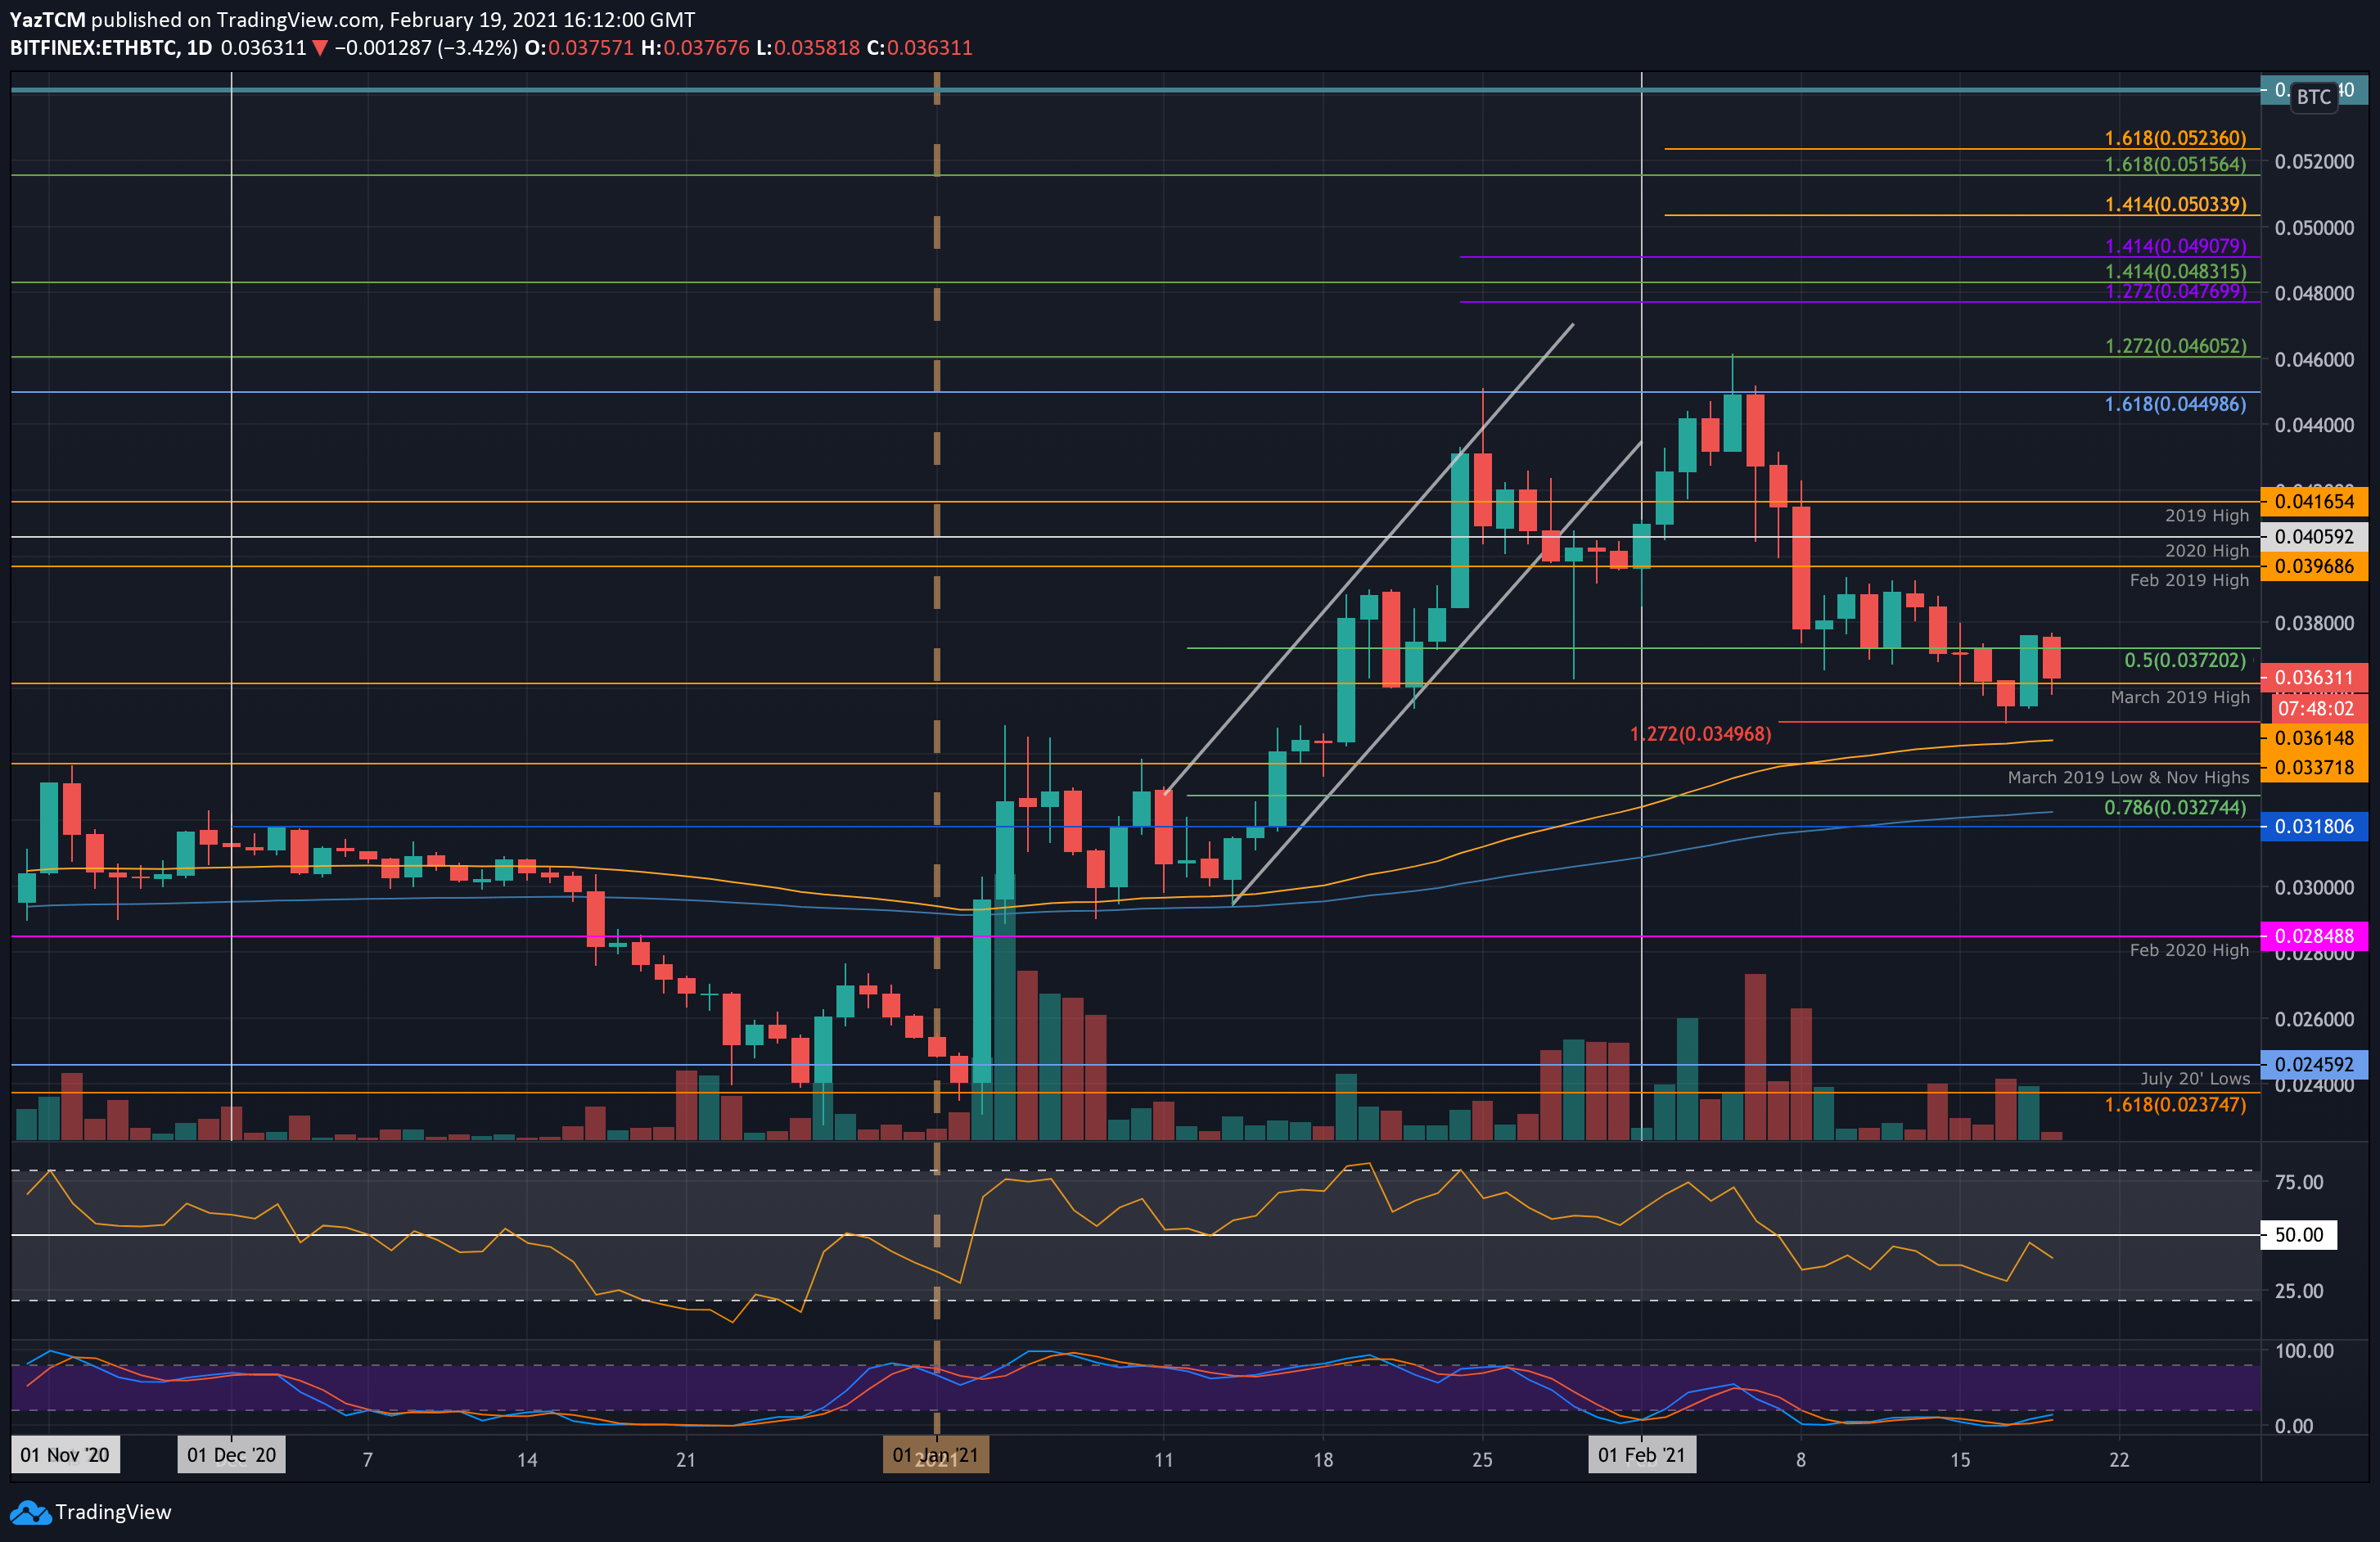
Ethereum continues to struggle against Bitcoin and is down by 22% from the February highs as it trades at 0.0361 BTC today. Last week, ETH was trading at 0.039 BTC as it started to slide. It initially found support at 0.0372 BTC (.5 Fib) but eventually fell through this support on Monday.
ETH continued to drop until support was found at 0.0349 (downside 1.272 Fib Extension). It rebounded from there but could not reach as high as 0.038 BTC. It has since dropped into the March 2019 support today with the latest Bitcoin price hikes.
Looking ahead, the first support lies at 0.0349 BTC (downside 1.272 Fib extension). This is followed by 0.0344 BTC (100-days EMA), 0.0337 BTC (Nov 2020 highs), and 0.032 BTC (200-days EMA).
On the other side, the first resistance lies at 0.038 BTC. This is followed by 0.039 BTC, 0.0396 BTC (Feb 2019 high), and 0.0405 BTC (2020 highs).
Ripple
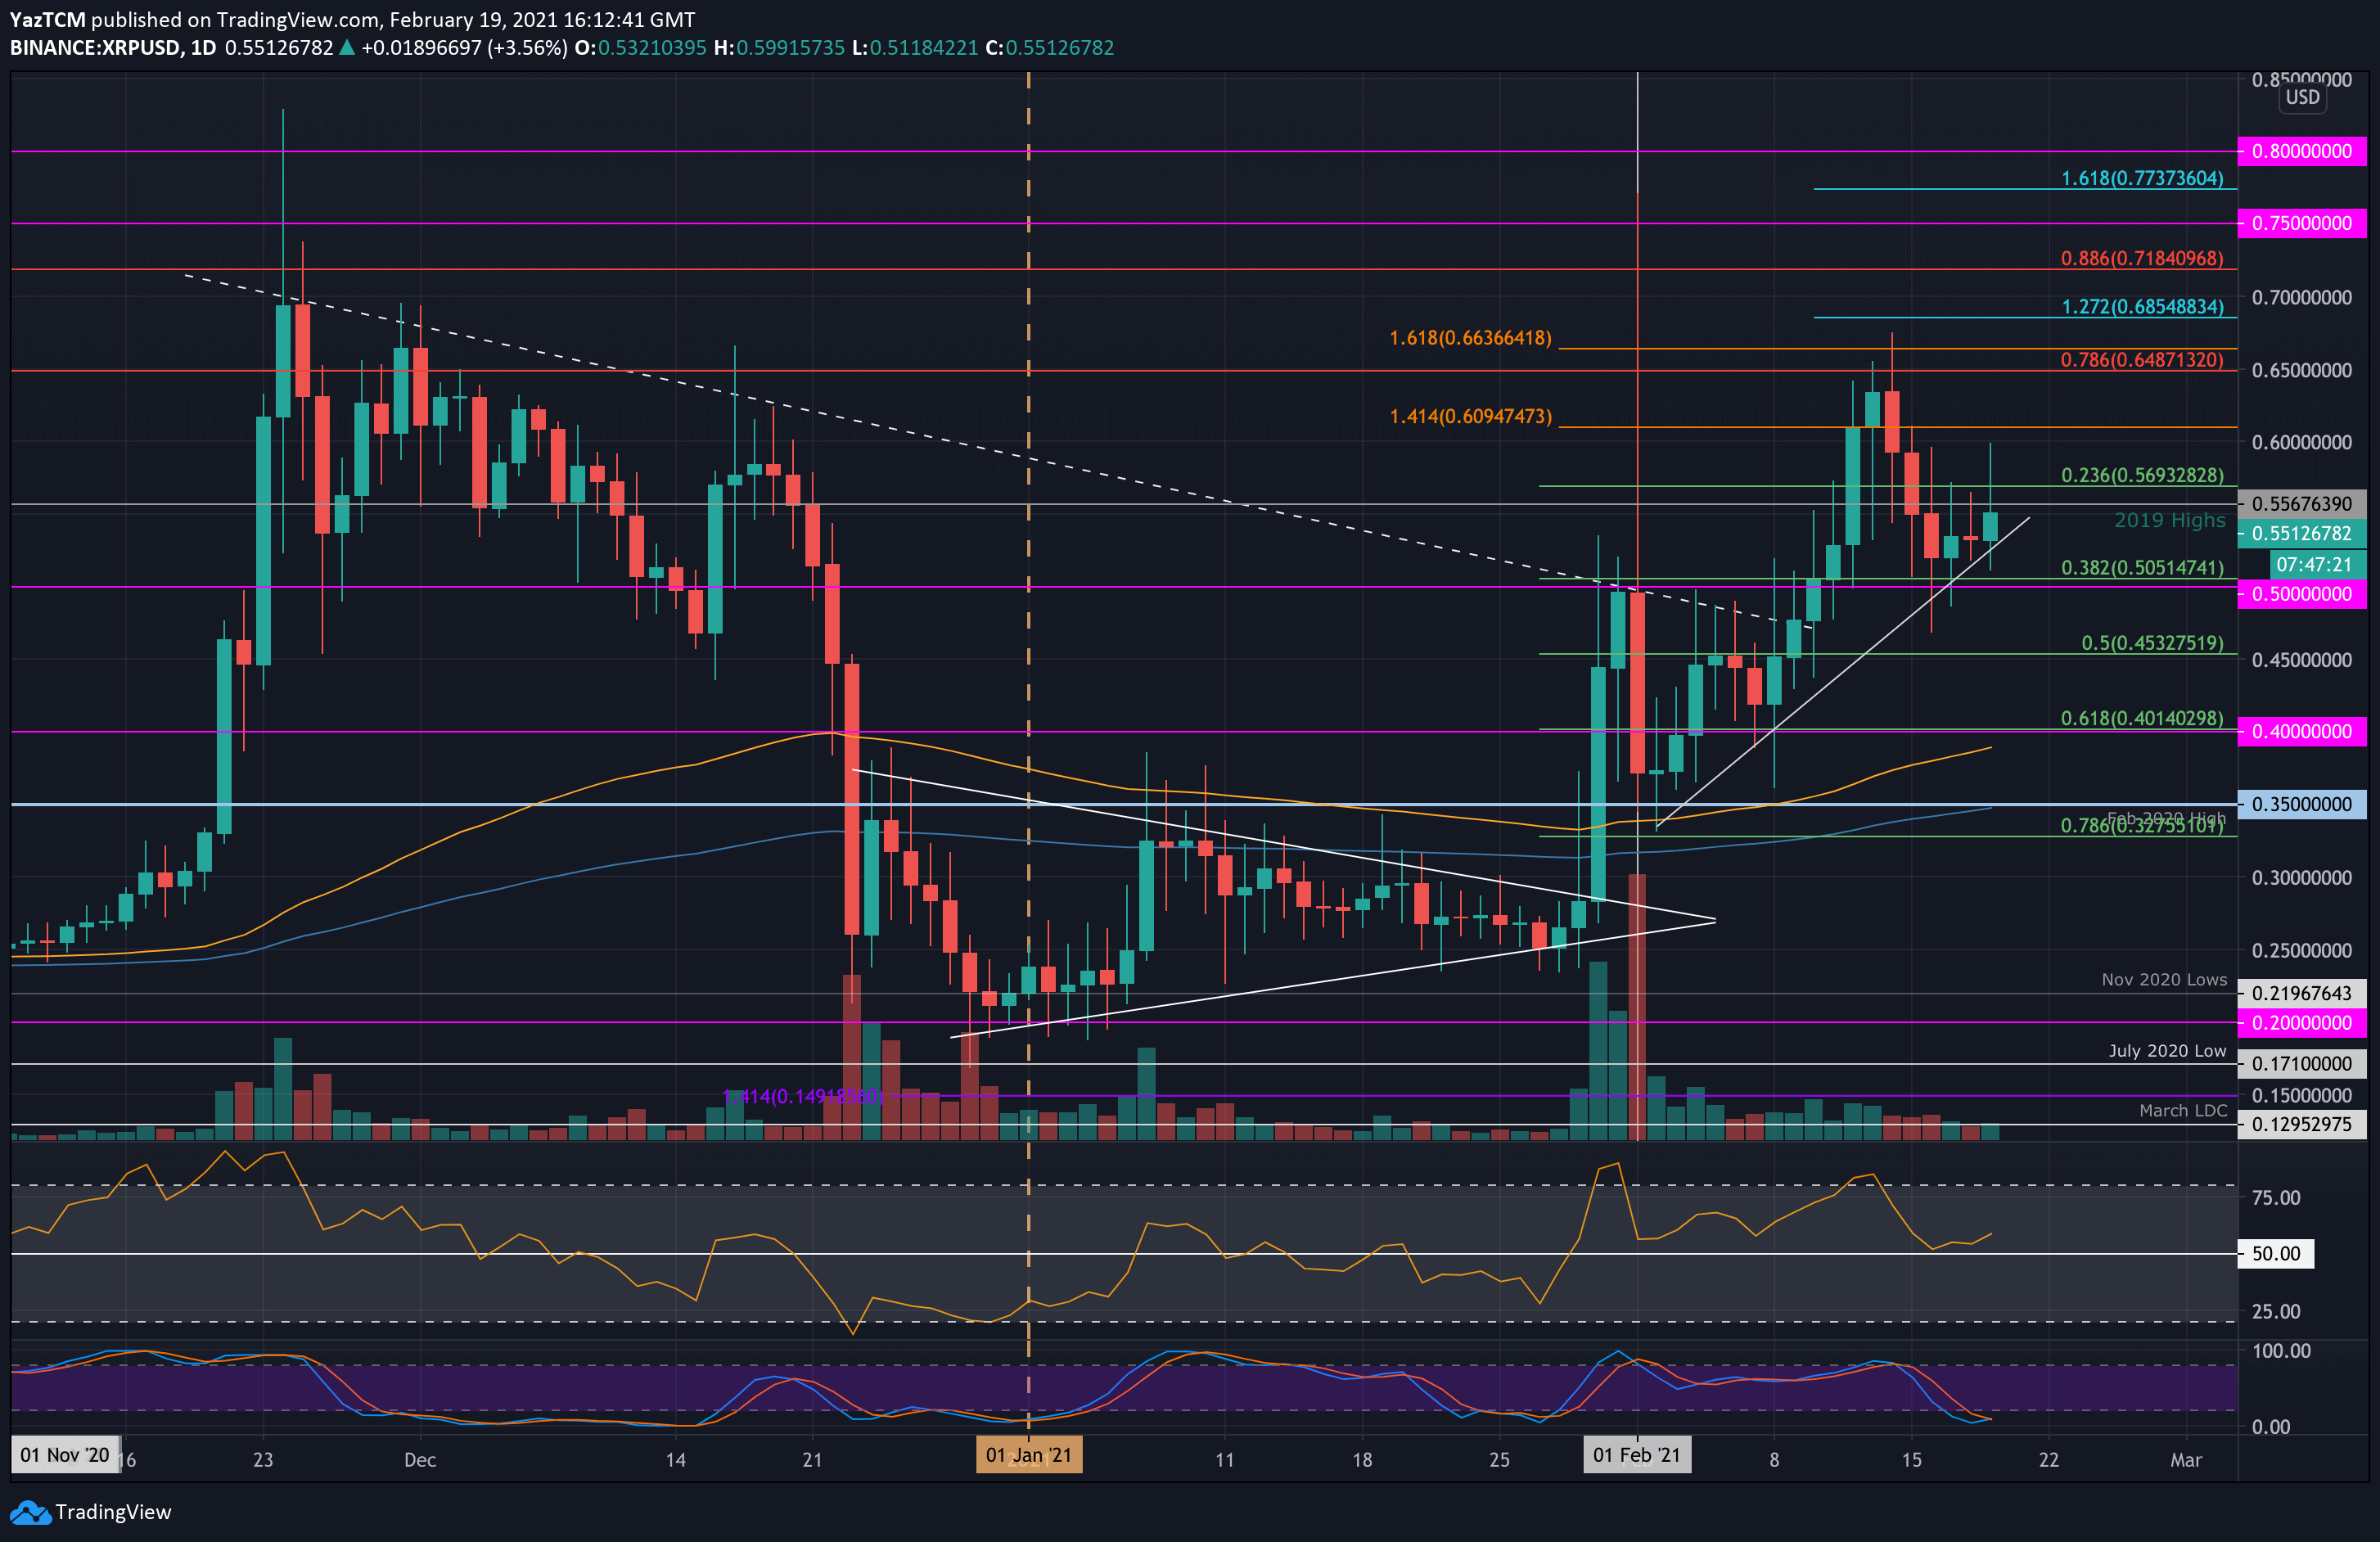
XRP only saw a small 7.3% price hike this week as it battle to remain above $0.5. Last week, Ripple was climbing higher as it bounced from $0.4. This weekend, the coin managed to reach as high as $0.67 but could not close a daily candle above $0.64.
As a result, XRP started to head lower this week but managed to find support at $0.5 (.382 Fib). It has rebounded from there to trade at the current $0.551 level.
Looking ahead, the first level of resistance lies at $0.556 (2019 Highs). This is followed by $0.6, $0.648 (bearish .786 Fib), $0.67, and $0.685.
On the other side, the first support lies at a rising trend line. This is followed by $0.5, $0.453 (.5 Fib), $0.4 (.618 Fib), and $0.35 (Feb 2020 Highs).
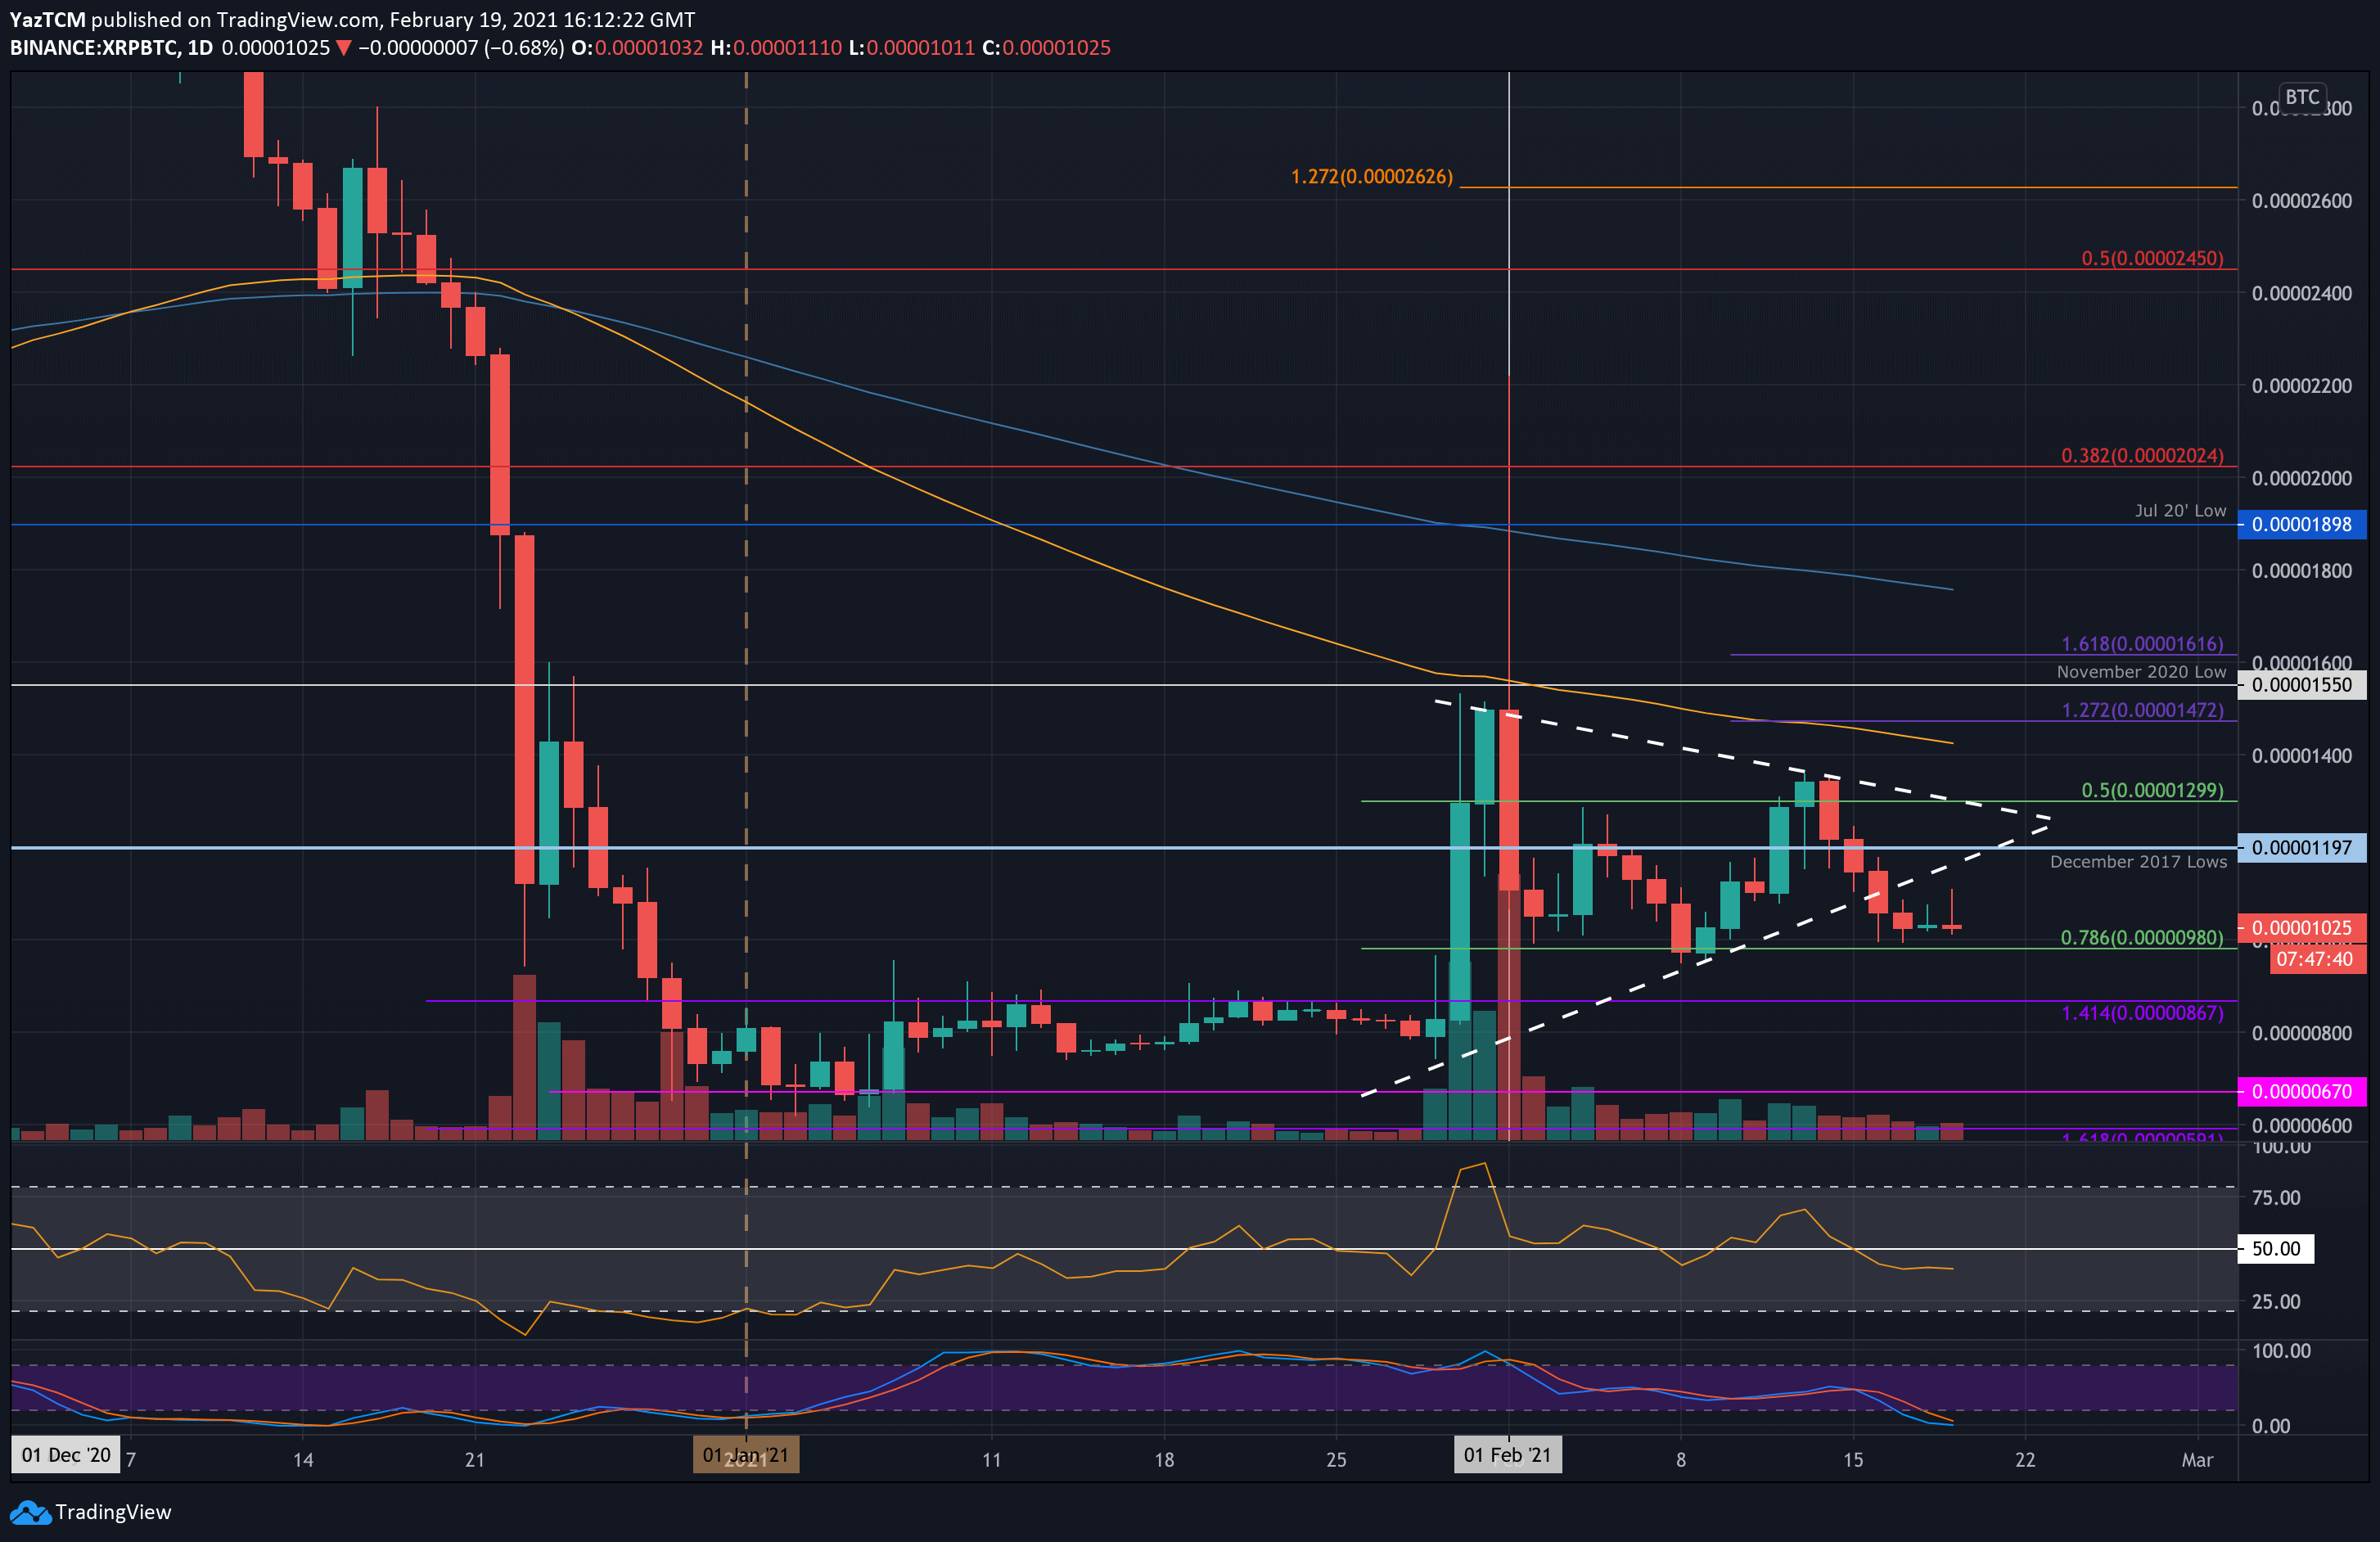
Against Bitcoin, XRP was trading within a symmetrical triangle pattern during February. It fell out of this triangle pattern this week as it dropped from 1300 SAT to reach the support at 1000 SAT. The bulls have battled to remain above 1000 SAT for the past four days of trading.
Moving forward, if the sellers push beneath 1000 SAT, the first support lies at 980 SAT (.786 Fib). This is followed by 867 SAT (previous range), 800 SAT, and 670 SAT.
On the other side, the first strong resistance lies at 1200 SAT (December 2017 lows). This is followed by 1300 SAT, 1400 SAT (100-days EMA), and 1550 SAT (November 2020 lows).
Binance Coin
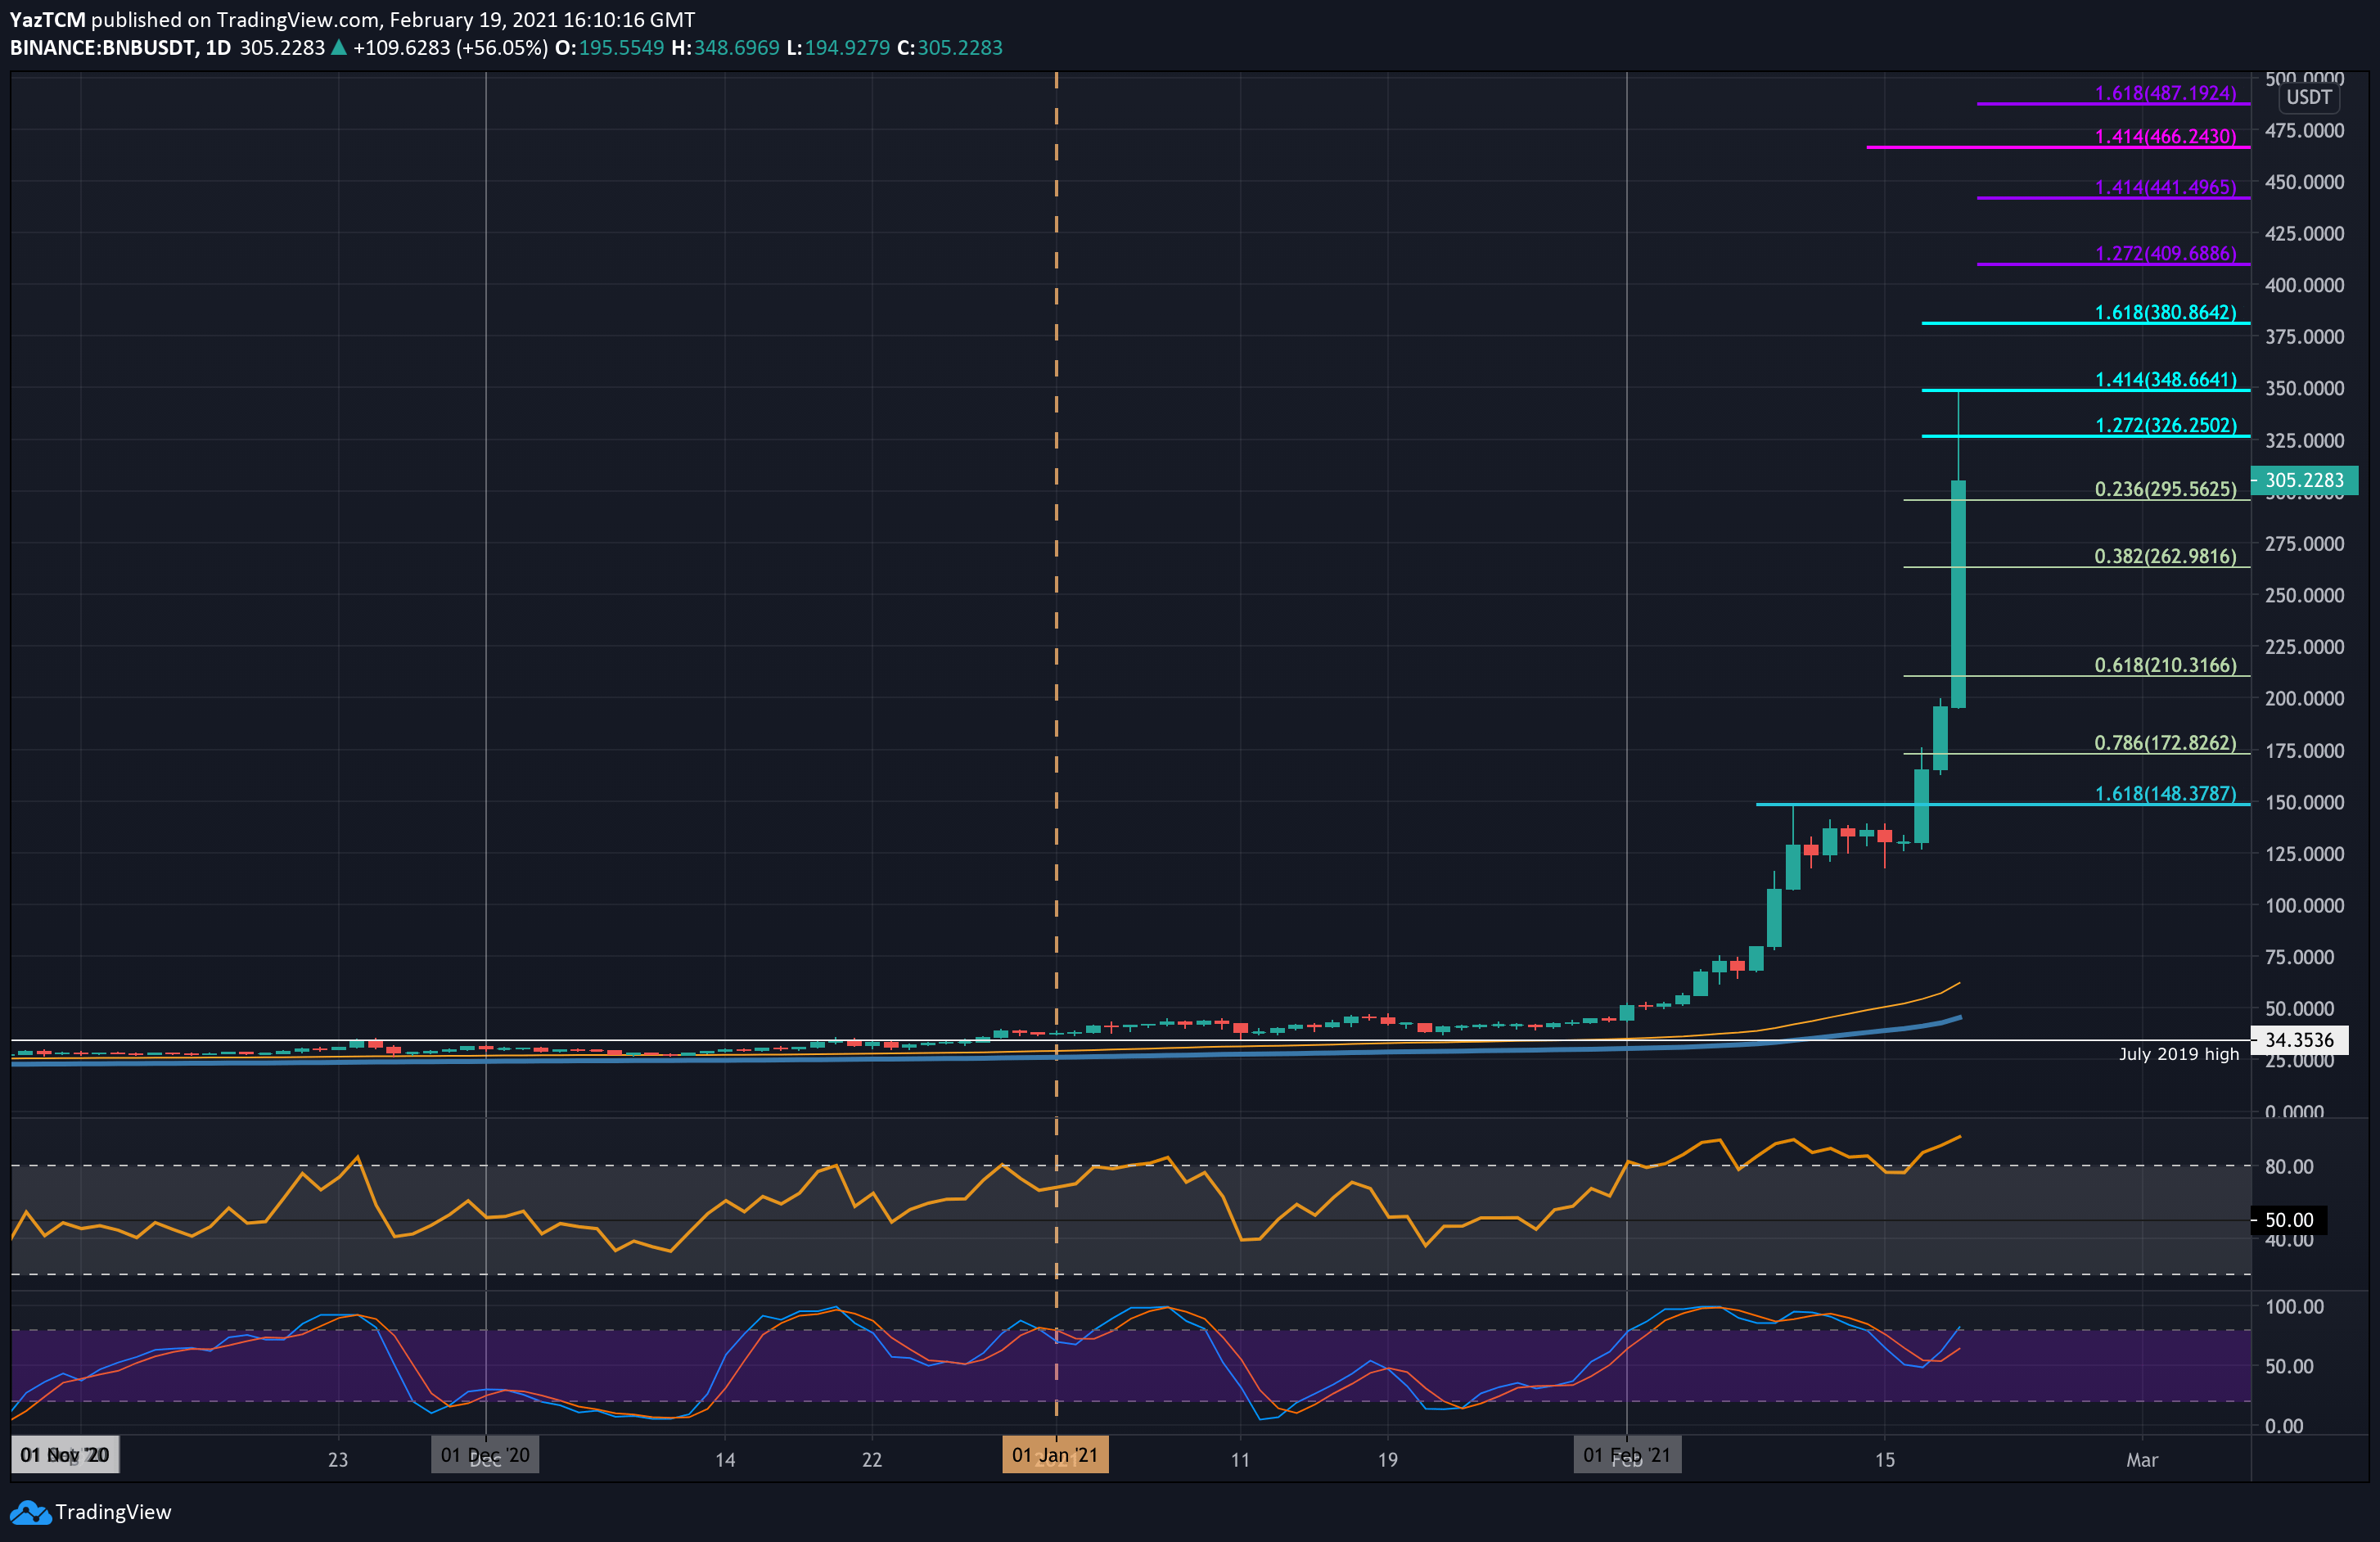
The growth of Binance Coin has been truly outstanding after being able to explode by over 600% this past month. BNB is up by another 153% this week as the coin breaches $300 and enters the top three ranked cryptocurrency projects.
Last week, BNB had surged higher from $75 to hit the resistance at $148.37 (1.618 Fib Extension). It stalled there for around a week until the resistance was finally penetrated on Wednesday, allowing it reach $175.
The bulls continued their push over the past couple of days and drove BNB into a new ATH price at $348.66 (1.414 Fib Extension) today. It has since dropped slightly as it now trades near $305.
Looking ahead, the first level of resistance lies at $326 (1.272 Fib Extension). This is followed by $350 (1.414 Fib Extension), $380 (1.618 Fib Extension), and $400. Beyond $400, resistance lies at $410, $441, $466, and $487.
On the other side, the first support lies at $295 (.236 Fib). This is followed by $262 (.382 Fib), $250, $210 (.68 Fib), and $200.
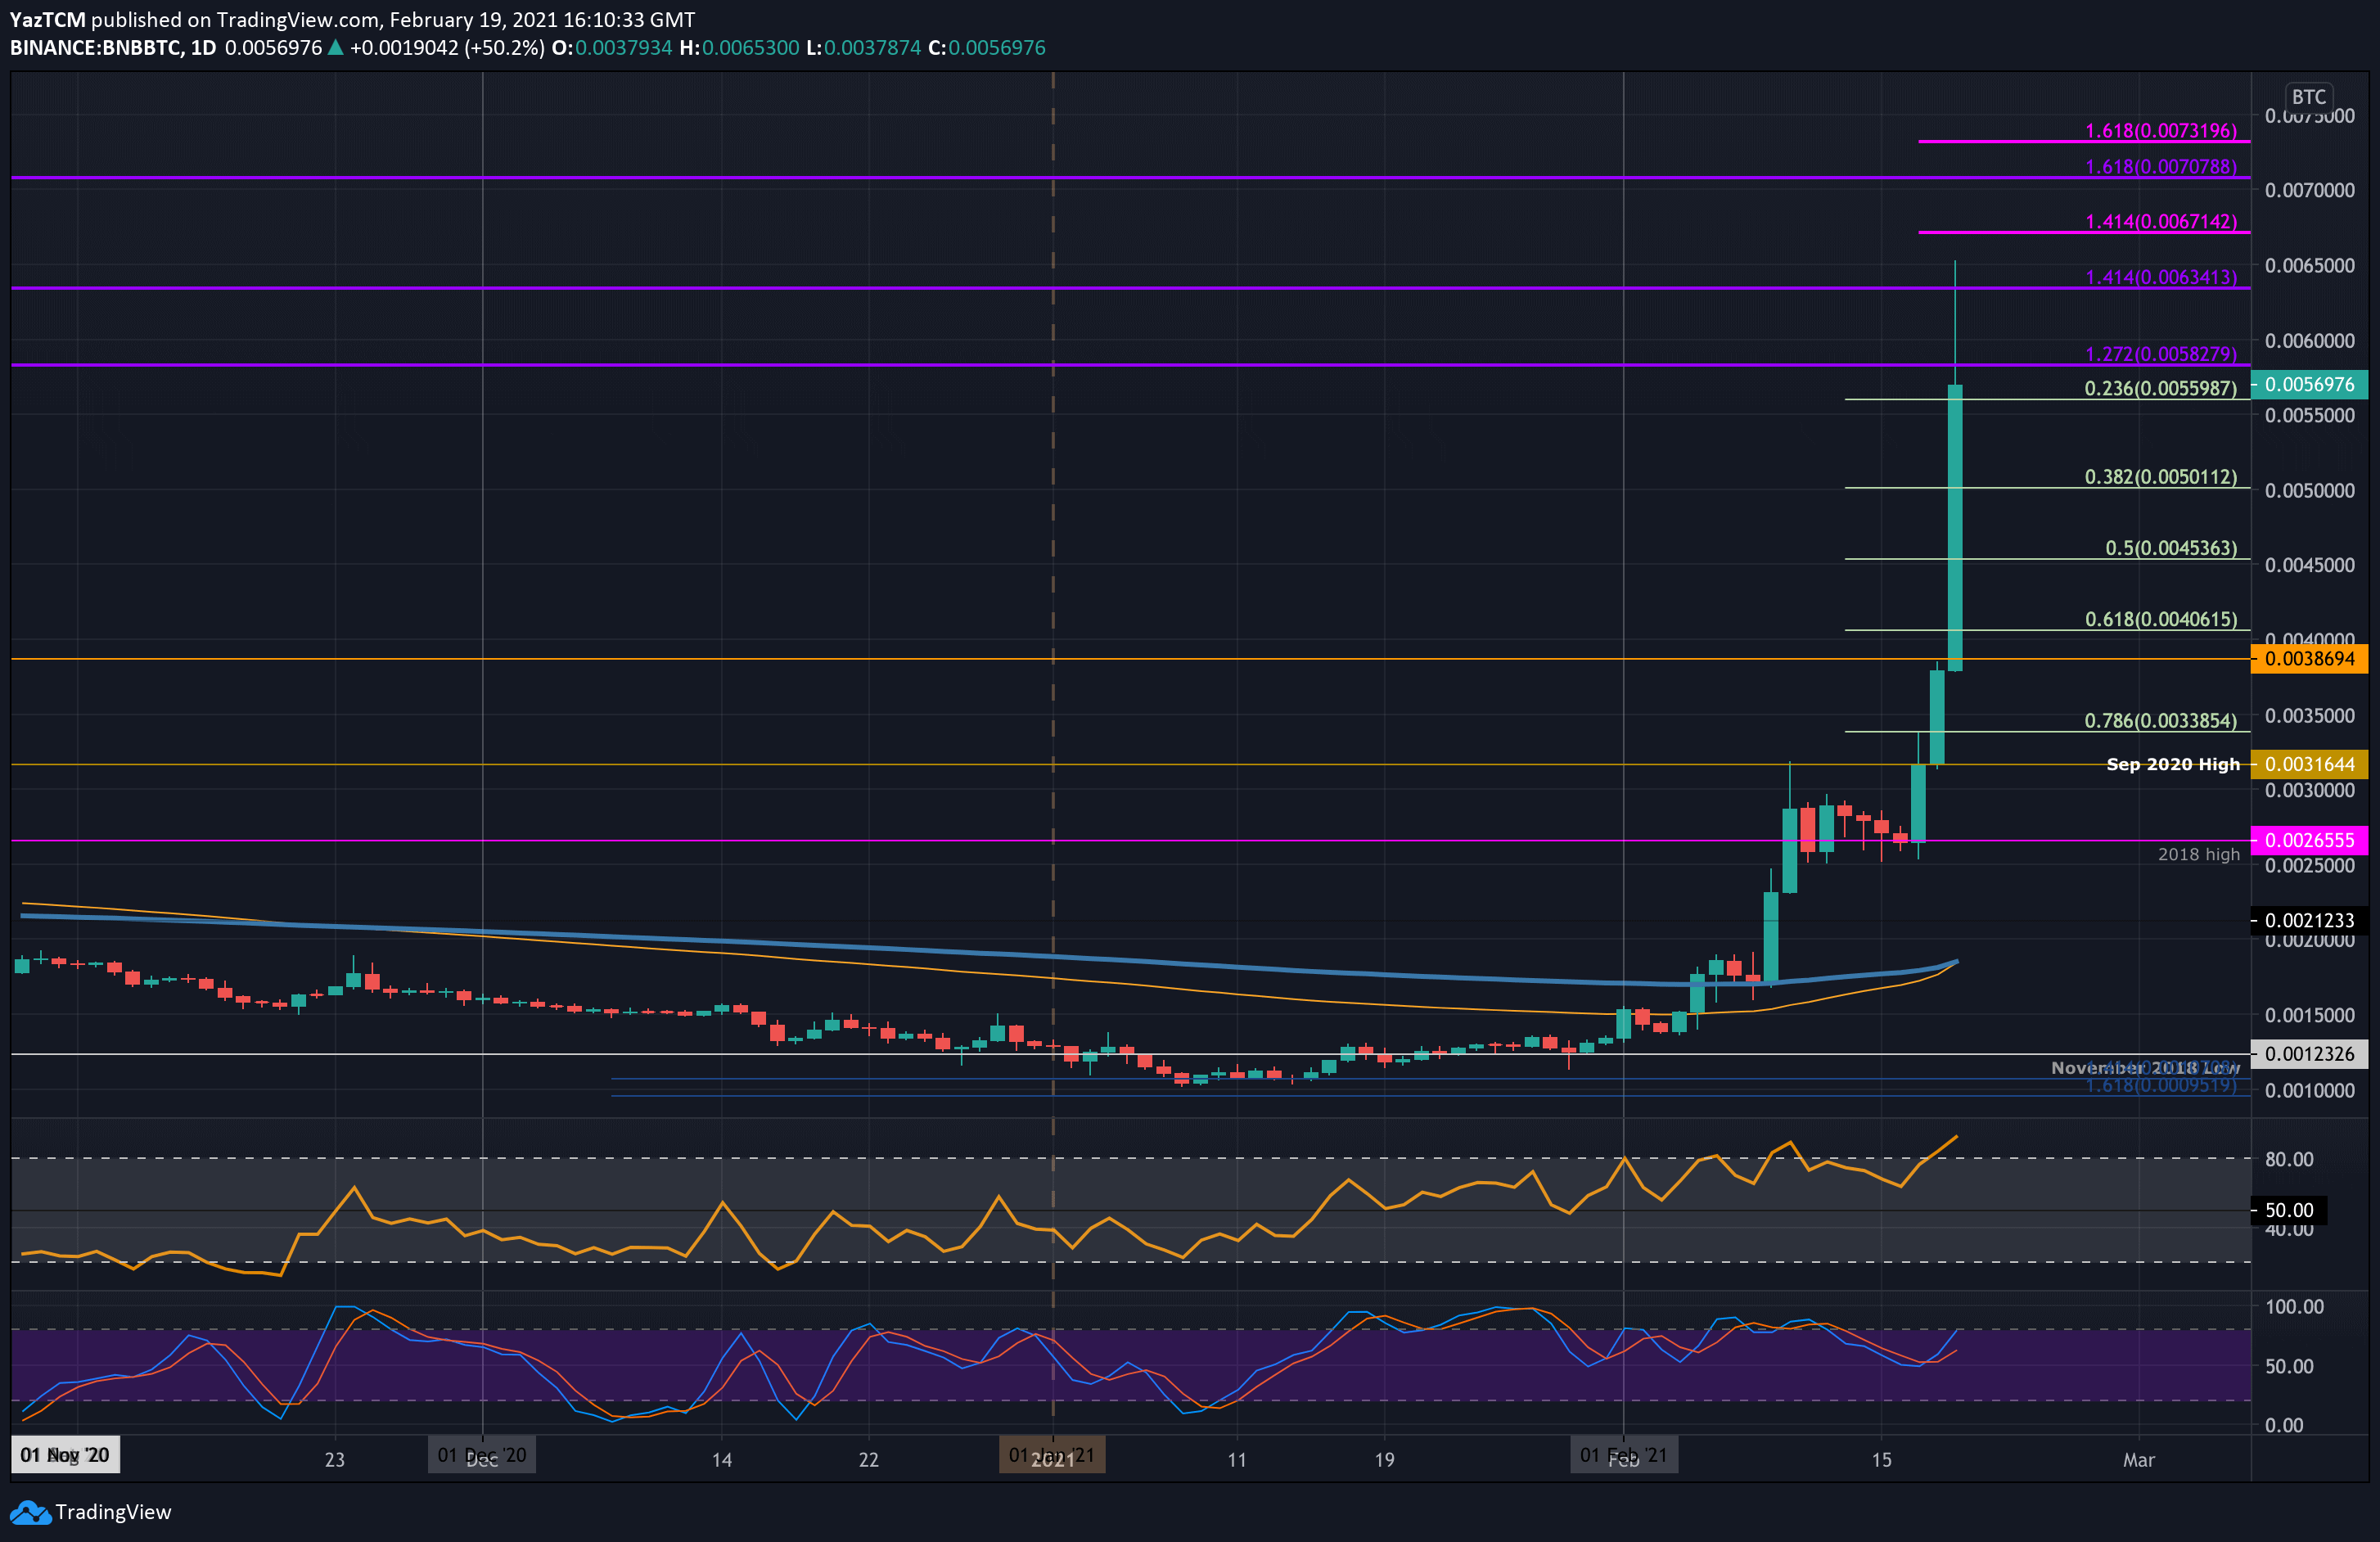
Binance Coin has also been performing very well against Bitcoin. The coin had reached resistance at 0.003 BTC last week and headed into support at 0.025 BTC from there.
On Wednesday, the bulls rebounded from 0.025 BTC as they started to push above the 0.03 BTC resistance to reach 0.0338 BTC. The bullish pressure continued from there as BNB surged to reach as high as 0.065 BTC today. It has since dropped to around 0.0056 BTC.
Looking ahead, the first level of resistance lies at 0.006 BTC. This is followed by 0.065 BTC, 0.00671 BTC (1.414 Fib Extension – pink), and 0.007 BTC (1.618 Fib Extension – purple). Added resistance is found at 0.00731 BTC and 0.0075 BTC.
On the other side, the first support lies at 0.0055 BTC. This is followed by 0.005 BTC (.382 Fib), 0.00453 BTC (.5 Fib), and 0.00406 BTC (.618 Fib).
Polkadot
Polkadot saw a respectable 35.3% price hike itself this week as it reached a new ATH price at $35 today. The cryptocurrency has been trading within an ascending price channel for the entire period of February and recently reached the upper boundary of this channel today.
Looking ahead, the first level of resistance above the ATH price lies at $35.50 (1.272 Fib Extension). This is followed by $38 (1.414 Fib Extension), $40, and $41.63 (1.618 Fib Extension). Additional resistance lies at $45 and $48.
On the other side, the first support lies at $33. This is followed by $30 (the lower boundary of the price channel), $28 (.236 Fib), $25, and $23.86 (.382 Fib).
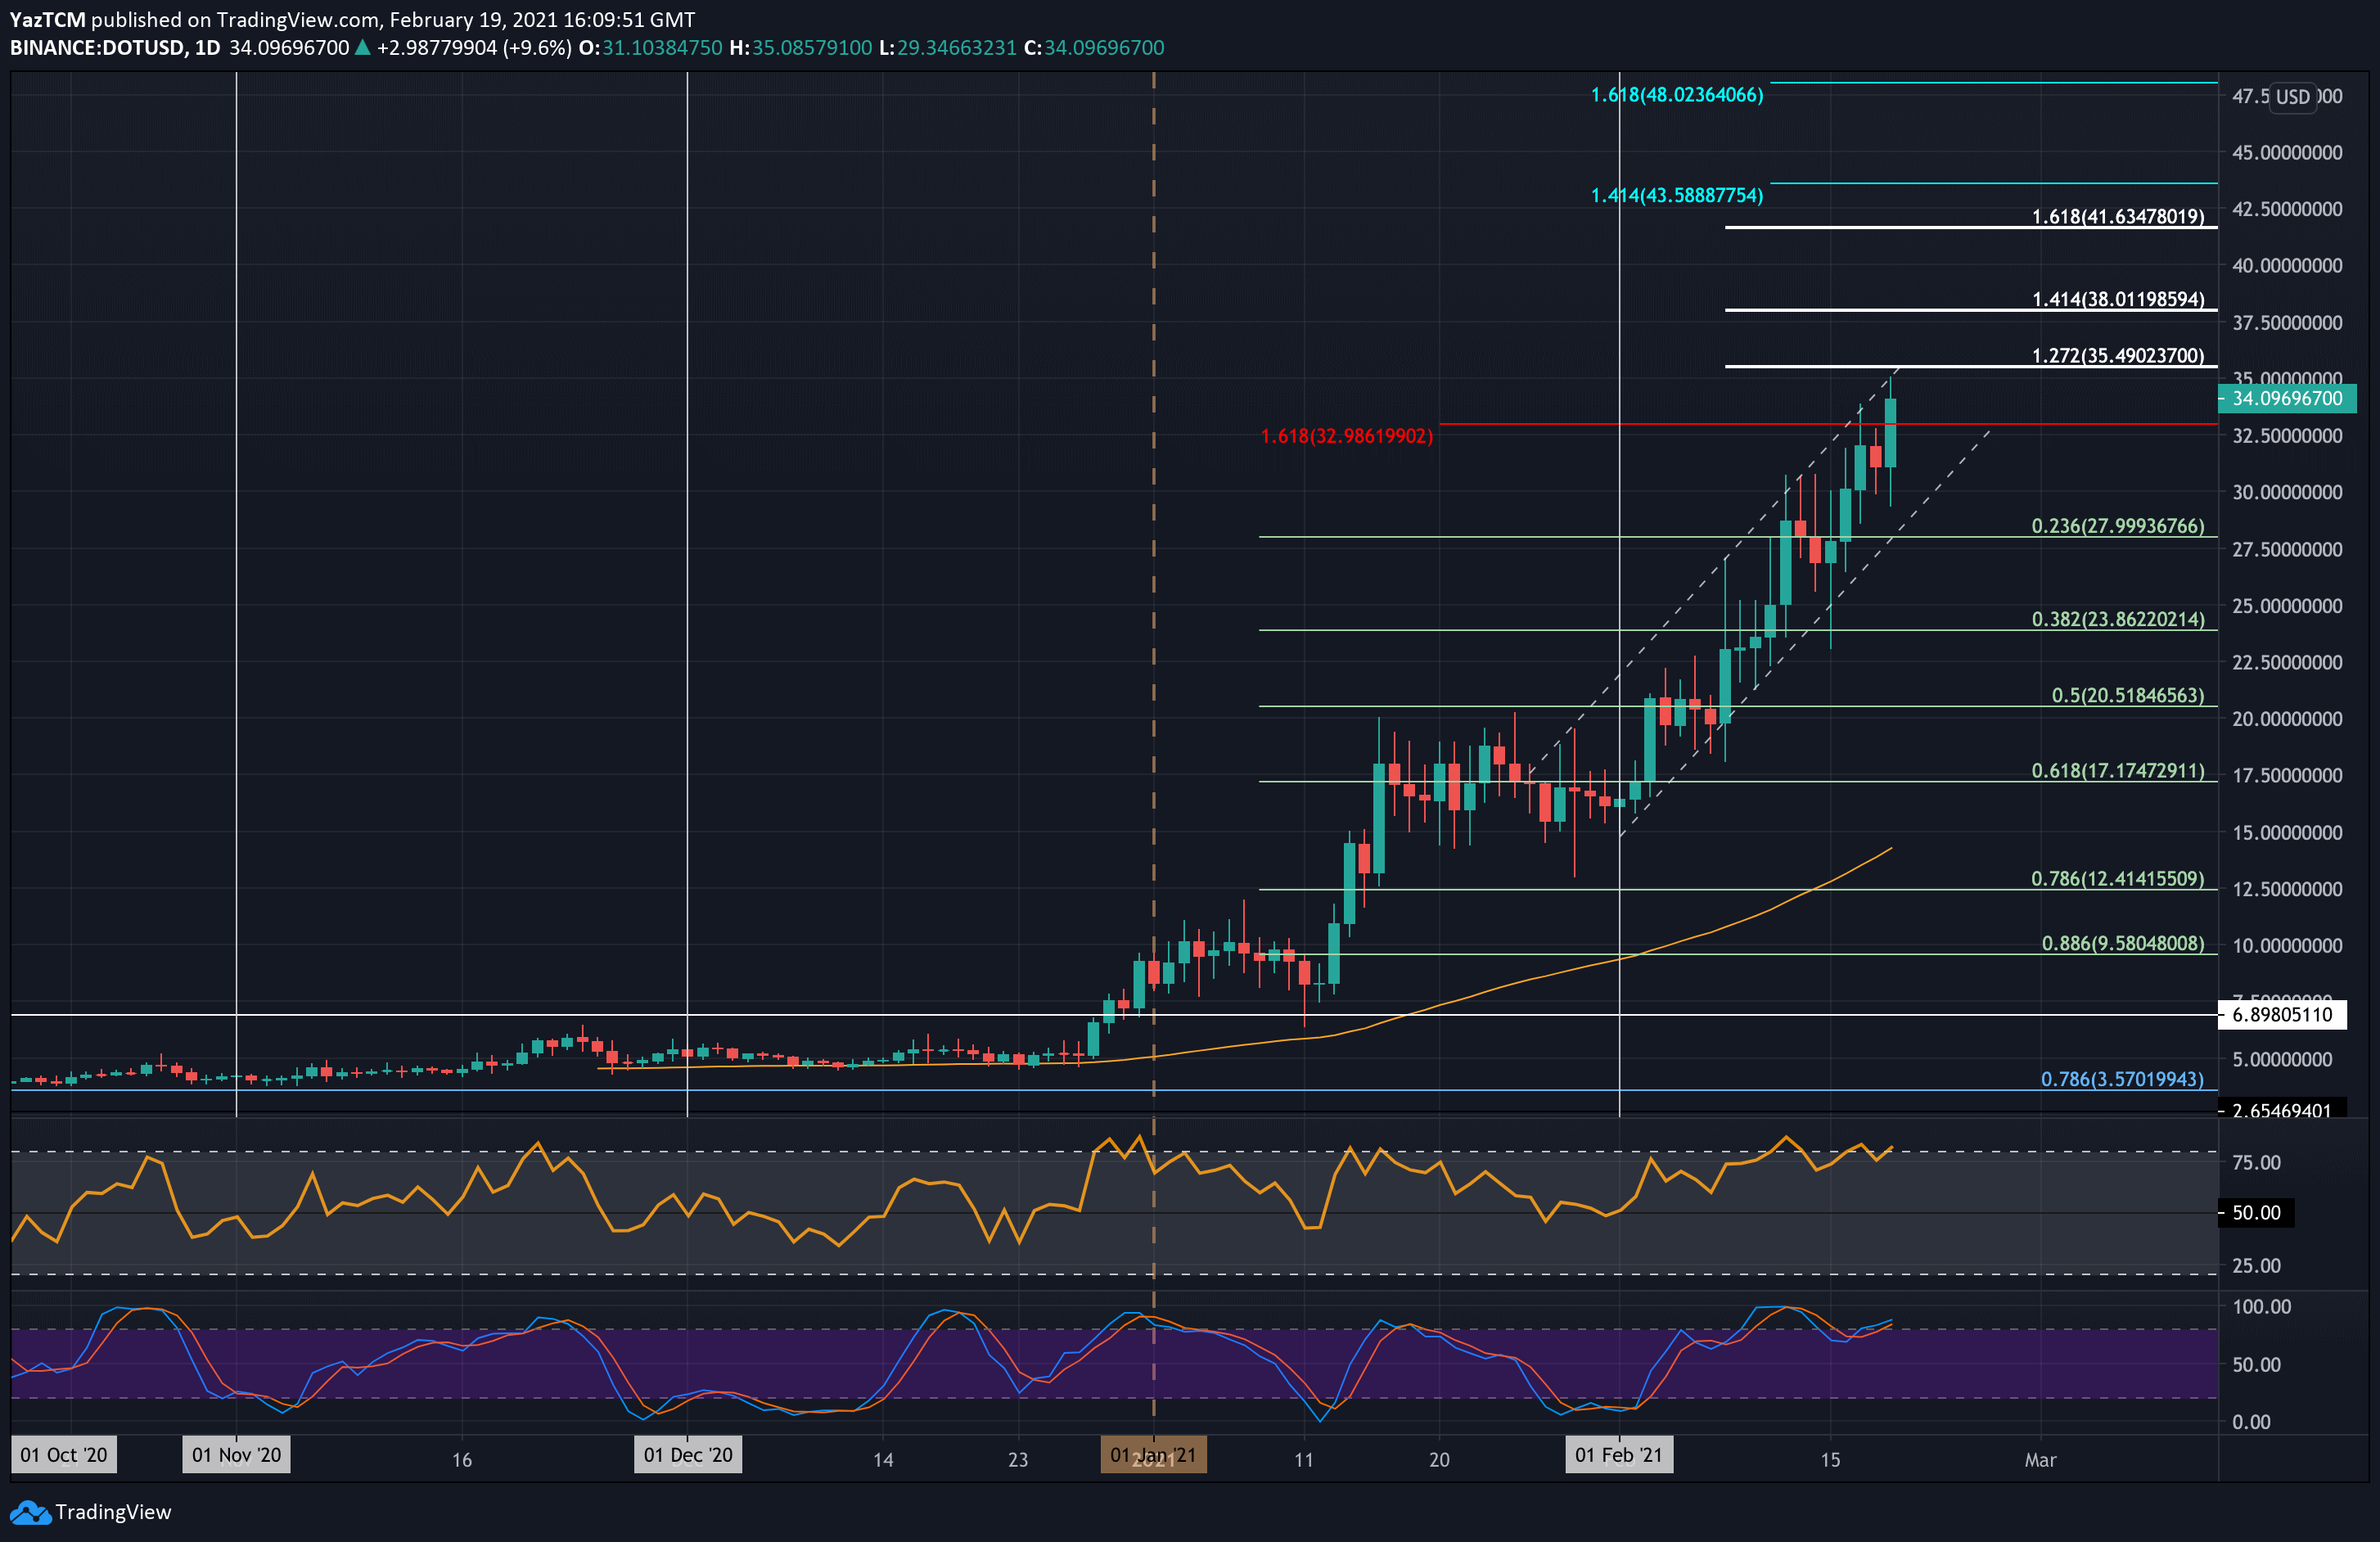
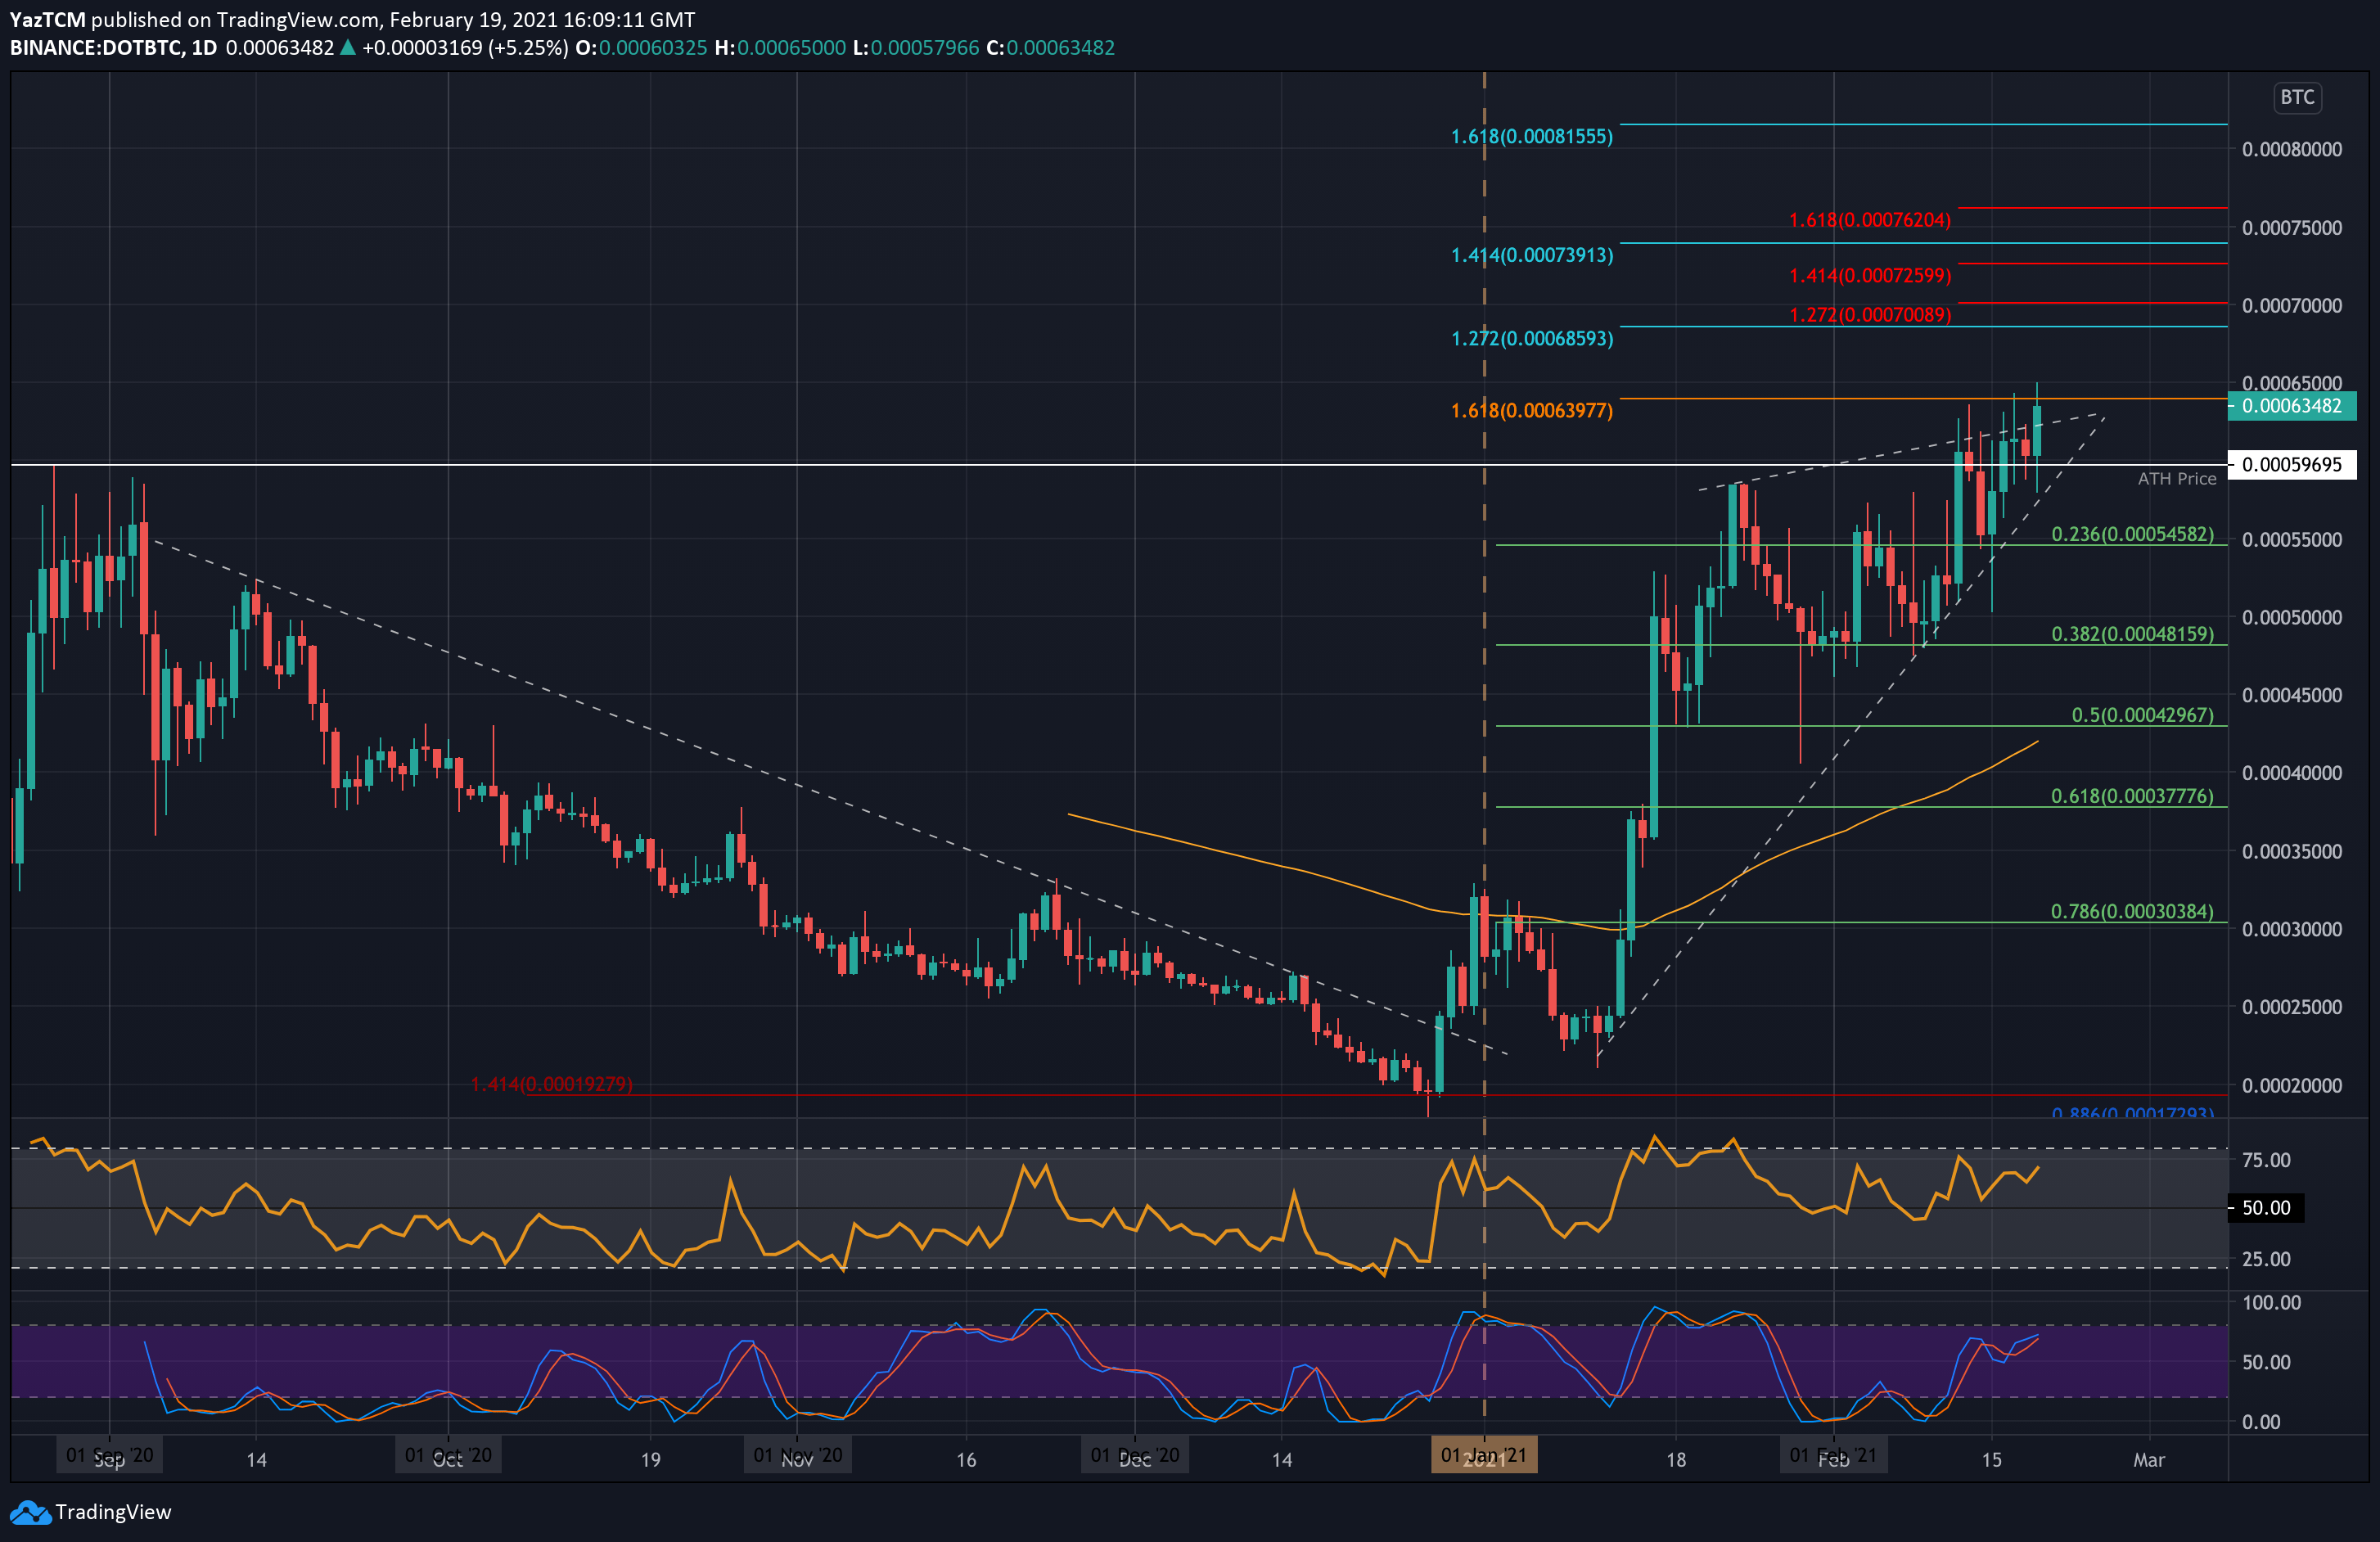
Likewise, DOT is also performing very well against Bitcoin. The cryptocurrency created a new ATH price at 0.00065 BTC today. It was trading inside a rising wedge but recently penetrated toward the upside of this wedge today. We will need a daily candle close above the wedge to confirm the breakout.
Looking ahead, the first level of resistance lies at 0.00065 BTC. This is followed by 0.000689 BTC (1.272 Fib Extension), 0.0007 BTC, 0.000726 BTC, and 0.000739 BTC (1.414 Fib Extnesion). Added resistance is found at 0.0008 BTC and 0.000815 BTC.
On the other side, the first support lies at 0.0006 BTC. This is followed by 0.000545 BTC (.236 Fib), 0.0005 BTC, and 0.000482 BTC (.382 Fib).