Bitcoin’s price is yet to recover above the K level after falling below a few days ago. However, the price is currently being supported at around ,000. Technical Analysis By: Edris The Daily Chart: On the daily timeframe, the price has been consolidating in a very tight range below the K level. The 50-day moving average is around the K mark at the moment. If it gets broken to the downside, the 200-day moving average located around the K level would be the next probable target in the short term. On the other hand, if the market rebounds and breaks above the K zone, a rally toward K would be expected. Source: TradingViewThe 4-Hour Chart: Looking at the 4-hour chart, the price has been painting lower highs and lows. The K level has turned into
Topics:
CryptoVizArt considers the following as important: Bitcoin (BTC) Price, BTC Analysis, BTCEUR, BTCGBP, btcusd, btcusdt
This could be interesting, too:
Mandy Williams writes Bitcoin Fear and Greed Index Hits 3.5-Year High: Does it Hurt BTC’s Chances for 0K?
Jordan Lyanchev writes BTC Crash Impending? Jim Cramer Calls Bitcoin a ‘Winner’
Wayne Jones writes VanEck Analyst Predicts Successive All-Time Highs for Bitcoin in Coming Months
Jordan Lyanchev writes Bitcoin’s Peak Above K, Ripple’s Price Explosion, Meme Coin Madness: Your Weekly Crypto Recap
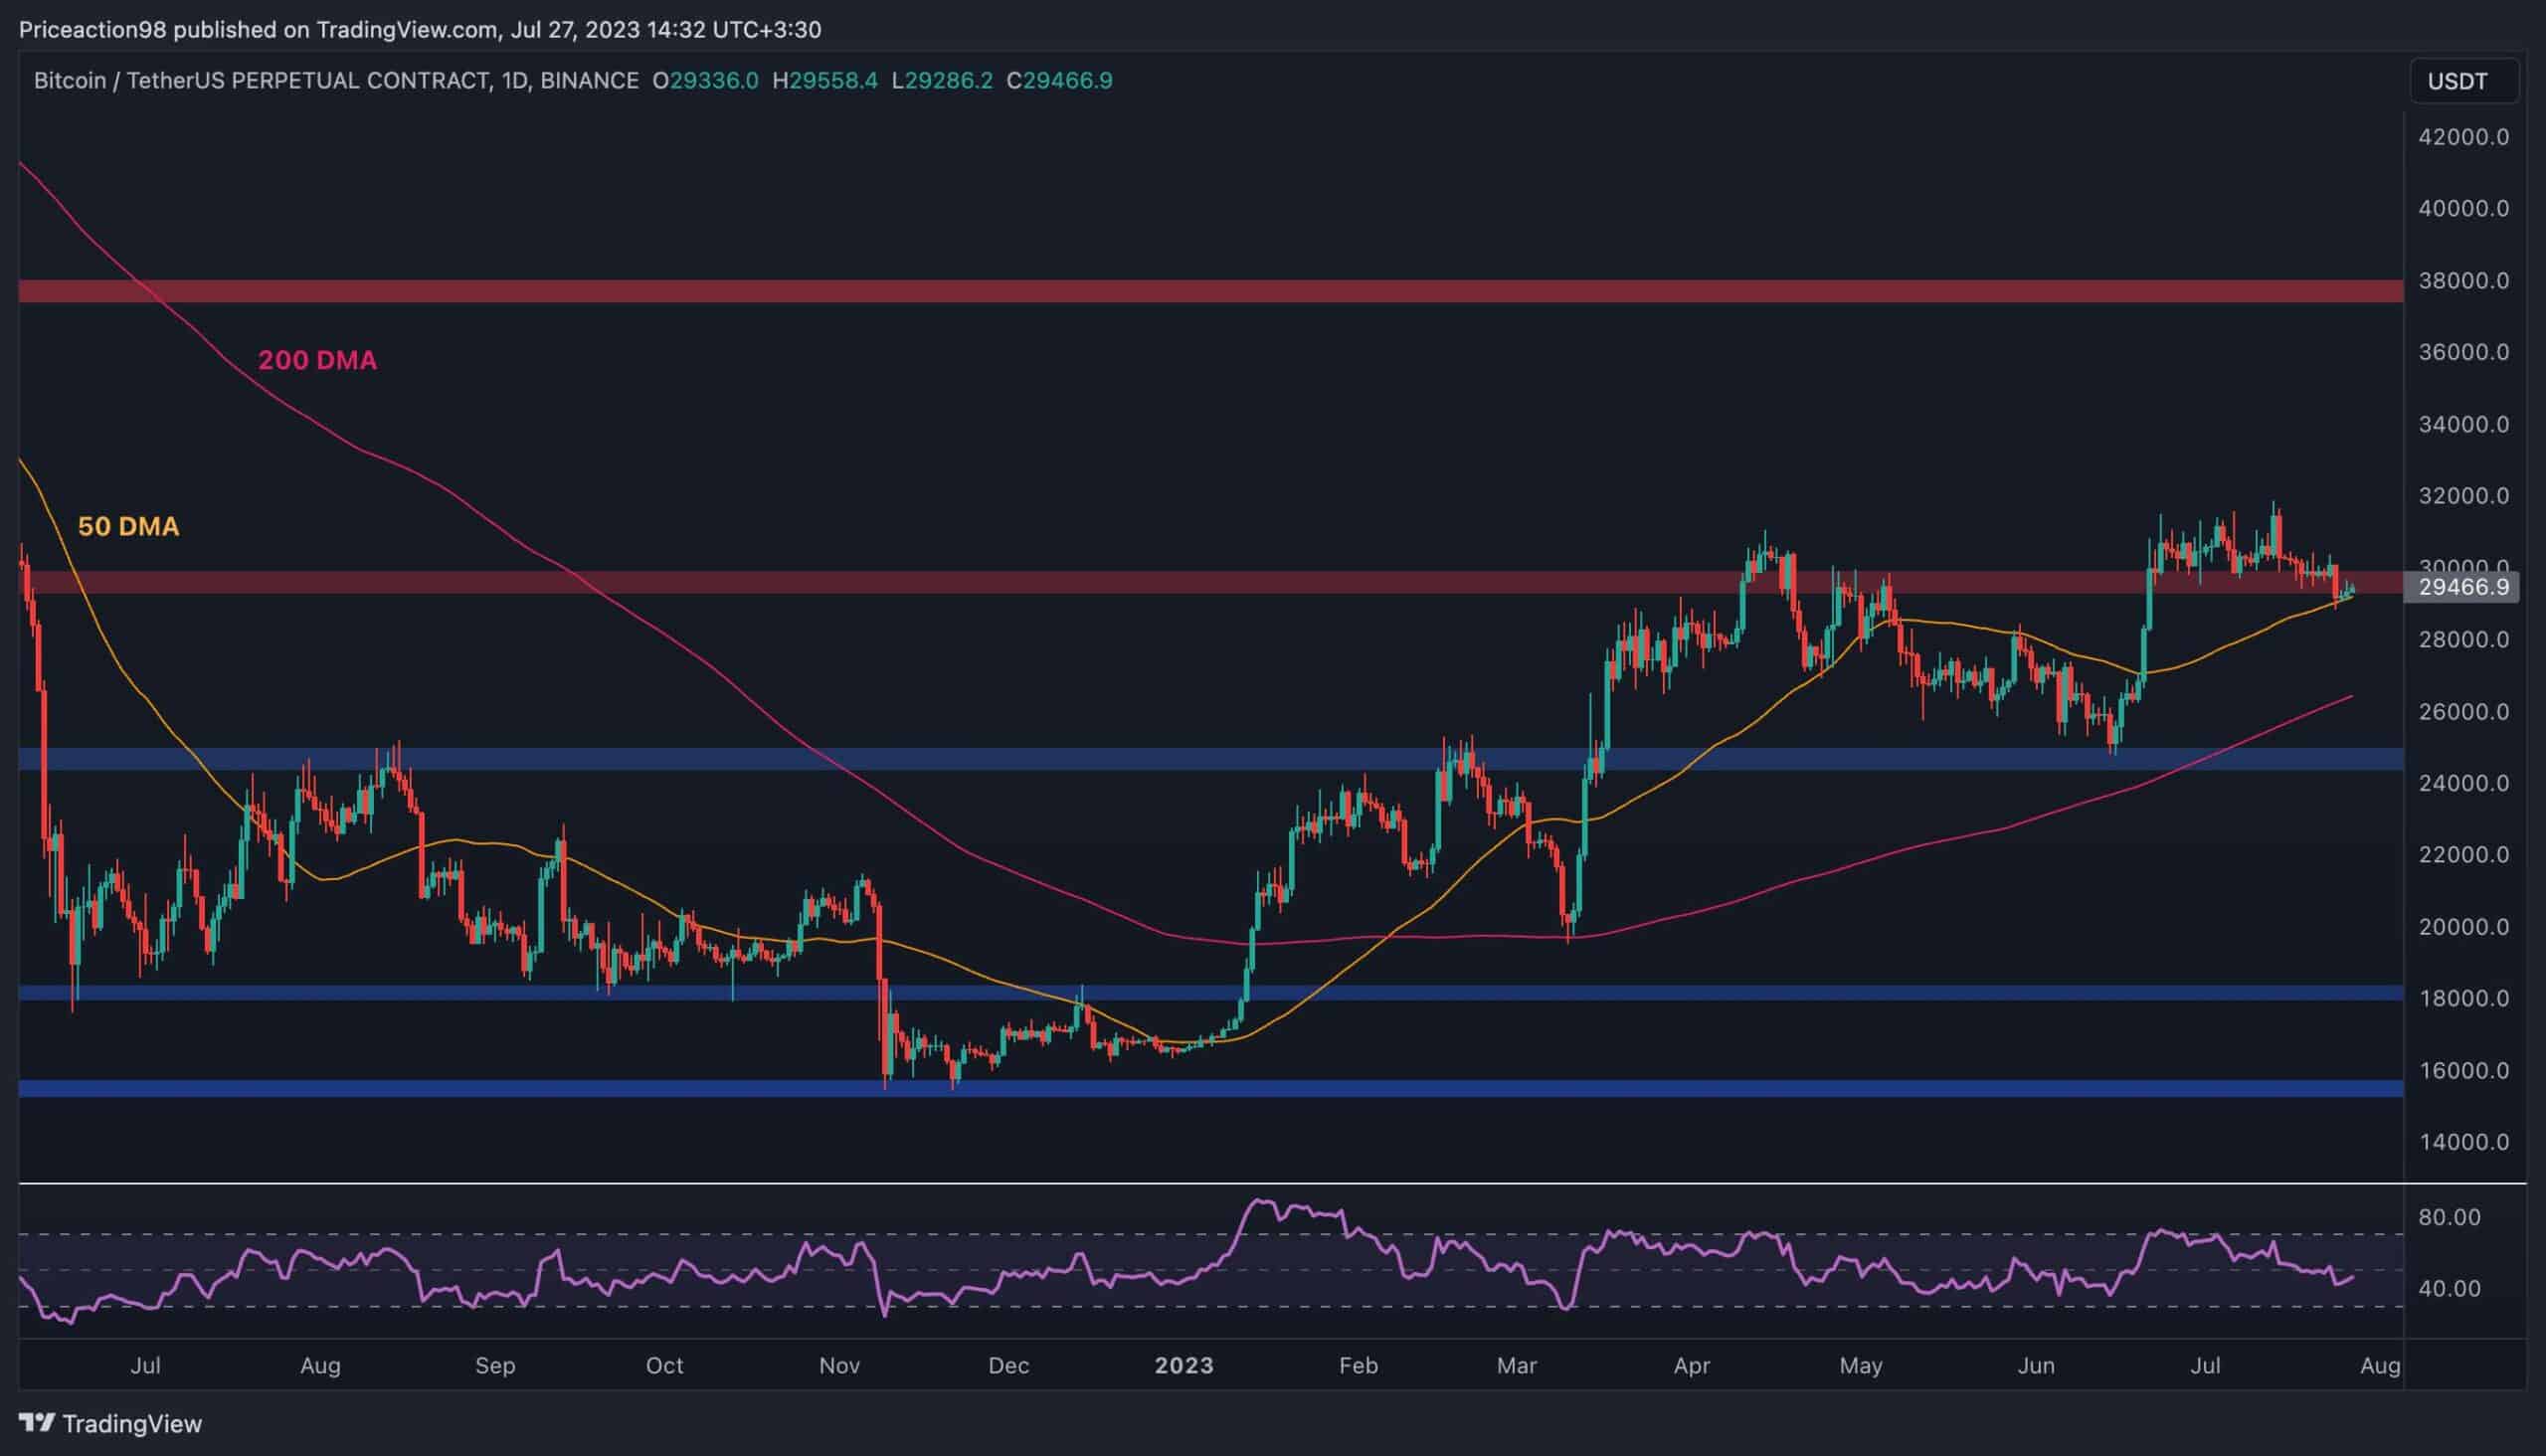
Bitcoin’s price is yet to recover above the $30K level after falling below a few days ago. However, the price is currently being supported at around $29,000.
Technical Analysis
By: Edris
The Daily Chart:
On the daily timeframe, the price has been consolidating in a very tight range below the $30K level. The 50-day moving average is around the $29K mark at the moment. If it gets broken to the downside, the 200-day moving average located around the $27K level would be the next probable target in the short term.
On the other hand, if the market rebounds and breaks above the $30K zone, a rally toward $38K would be expected.
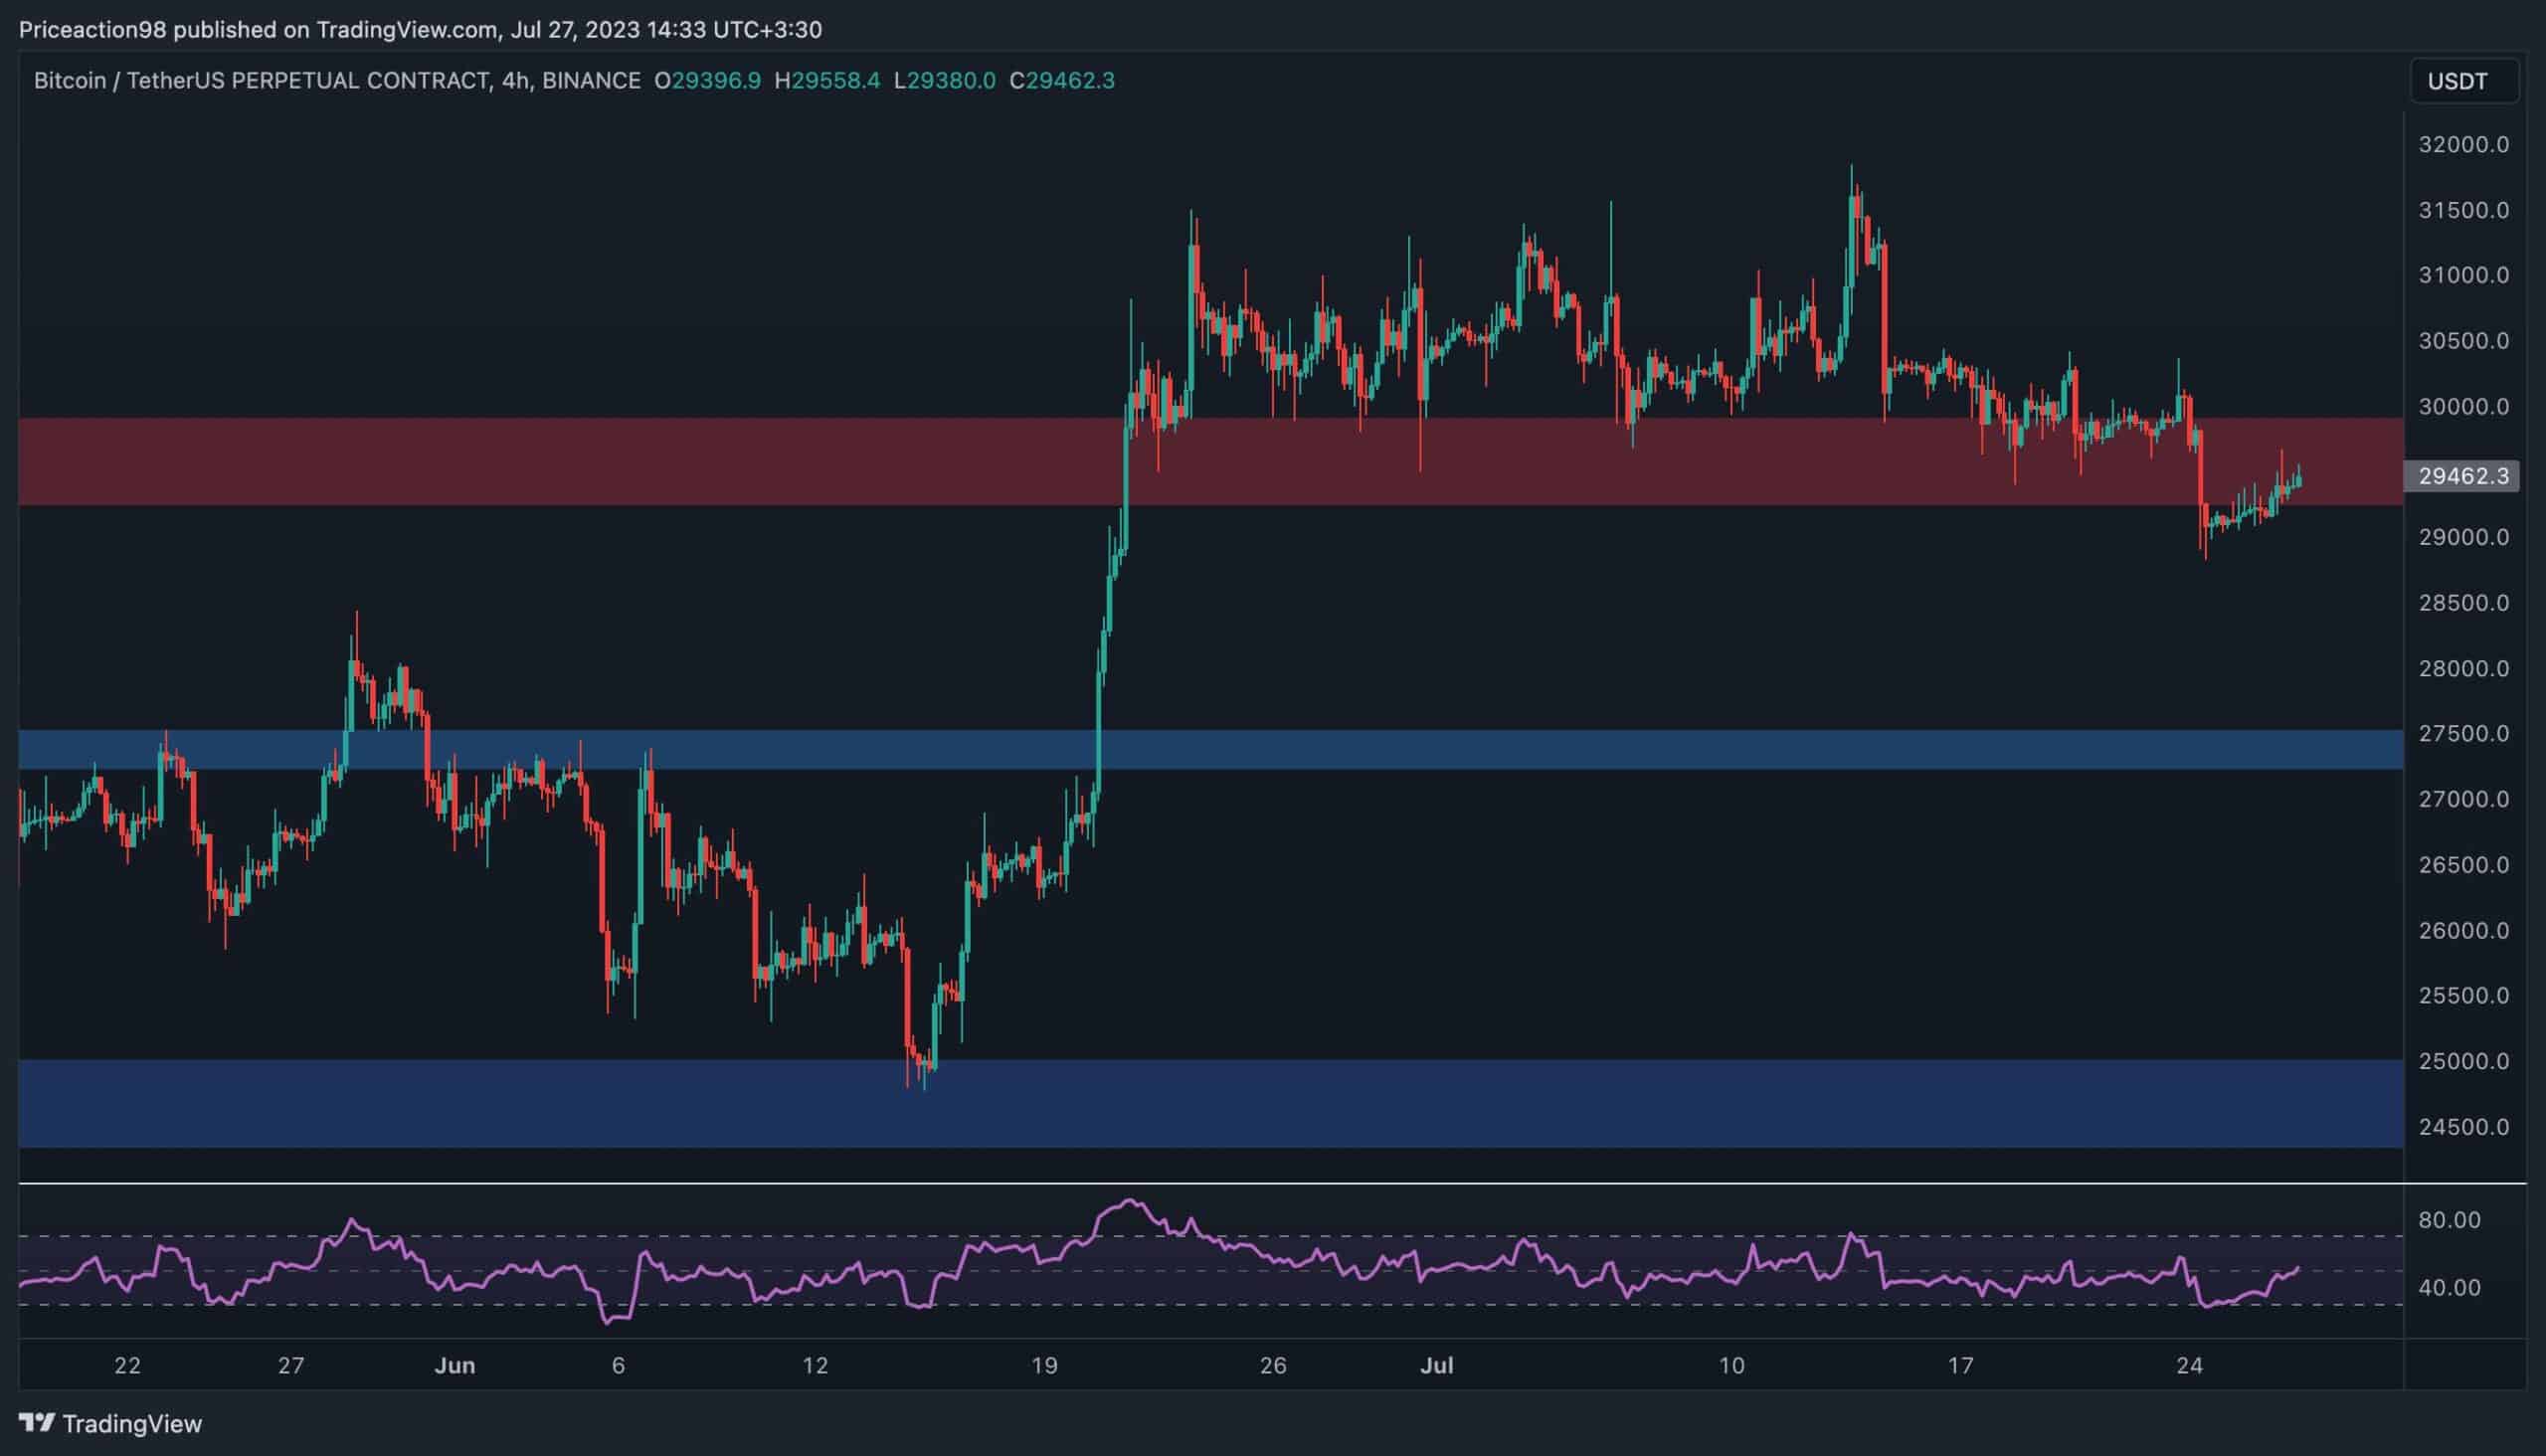
The 4-Hour Chart:
Looking at the 4-hour chart, the price has been painting lower highs and lows. The $30K level has turned into resistance, pushing it lower. In case Bitcoin fails to climb above $30K again, the $27,500 support level would likely get tested.
Moreover, the RSI indicator is also showing values around 50%, offering little insight into the potential direction for the short term. Therefore, the market is currently located in a key area, and the price action in the coming weeks relies on the reaction to this zone.
Onchain Analysis
By Shayan
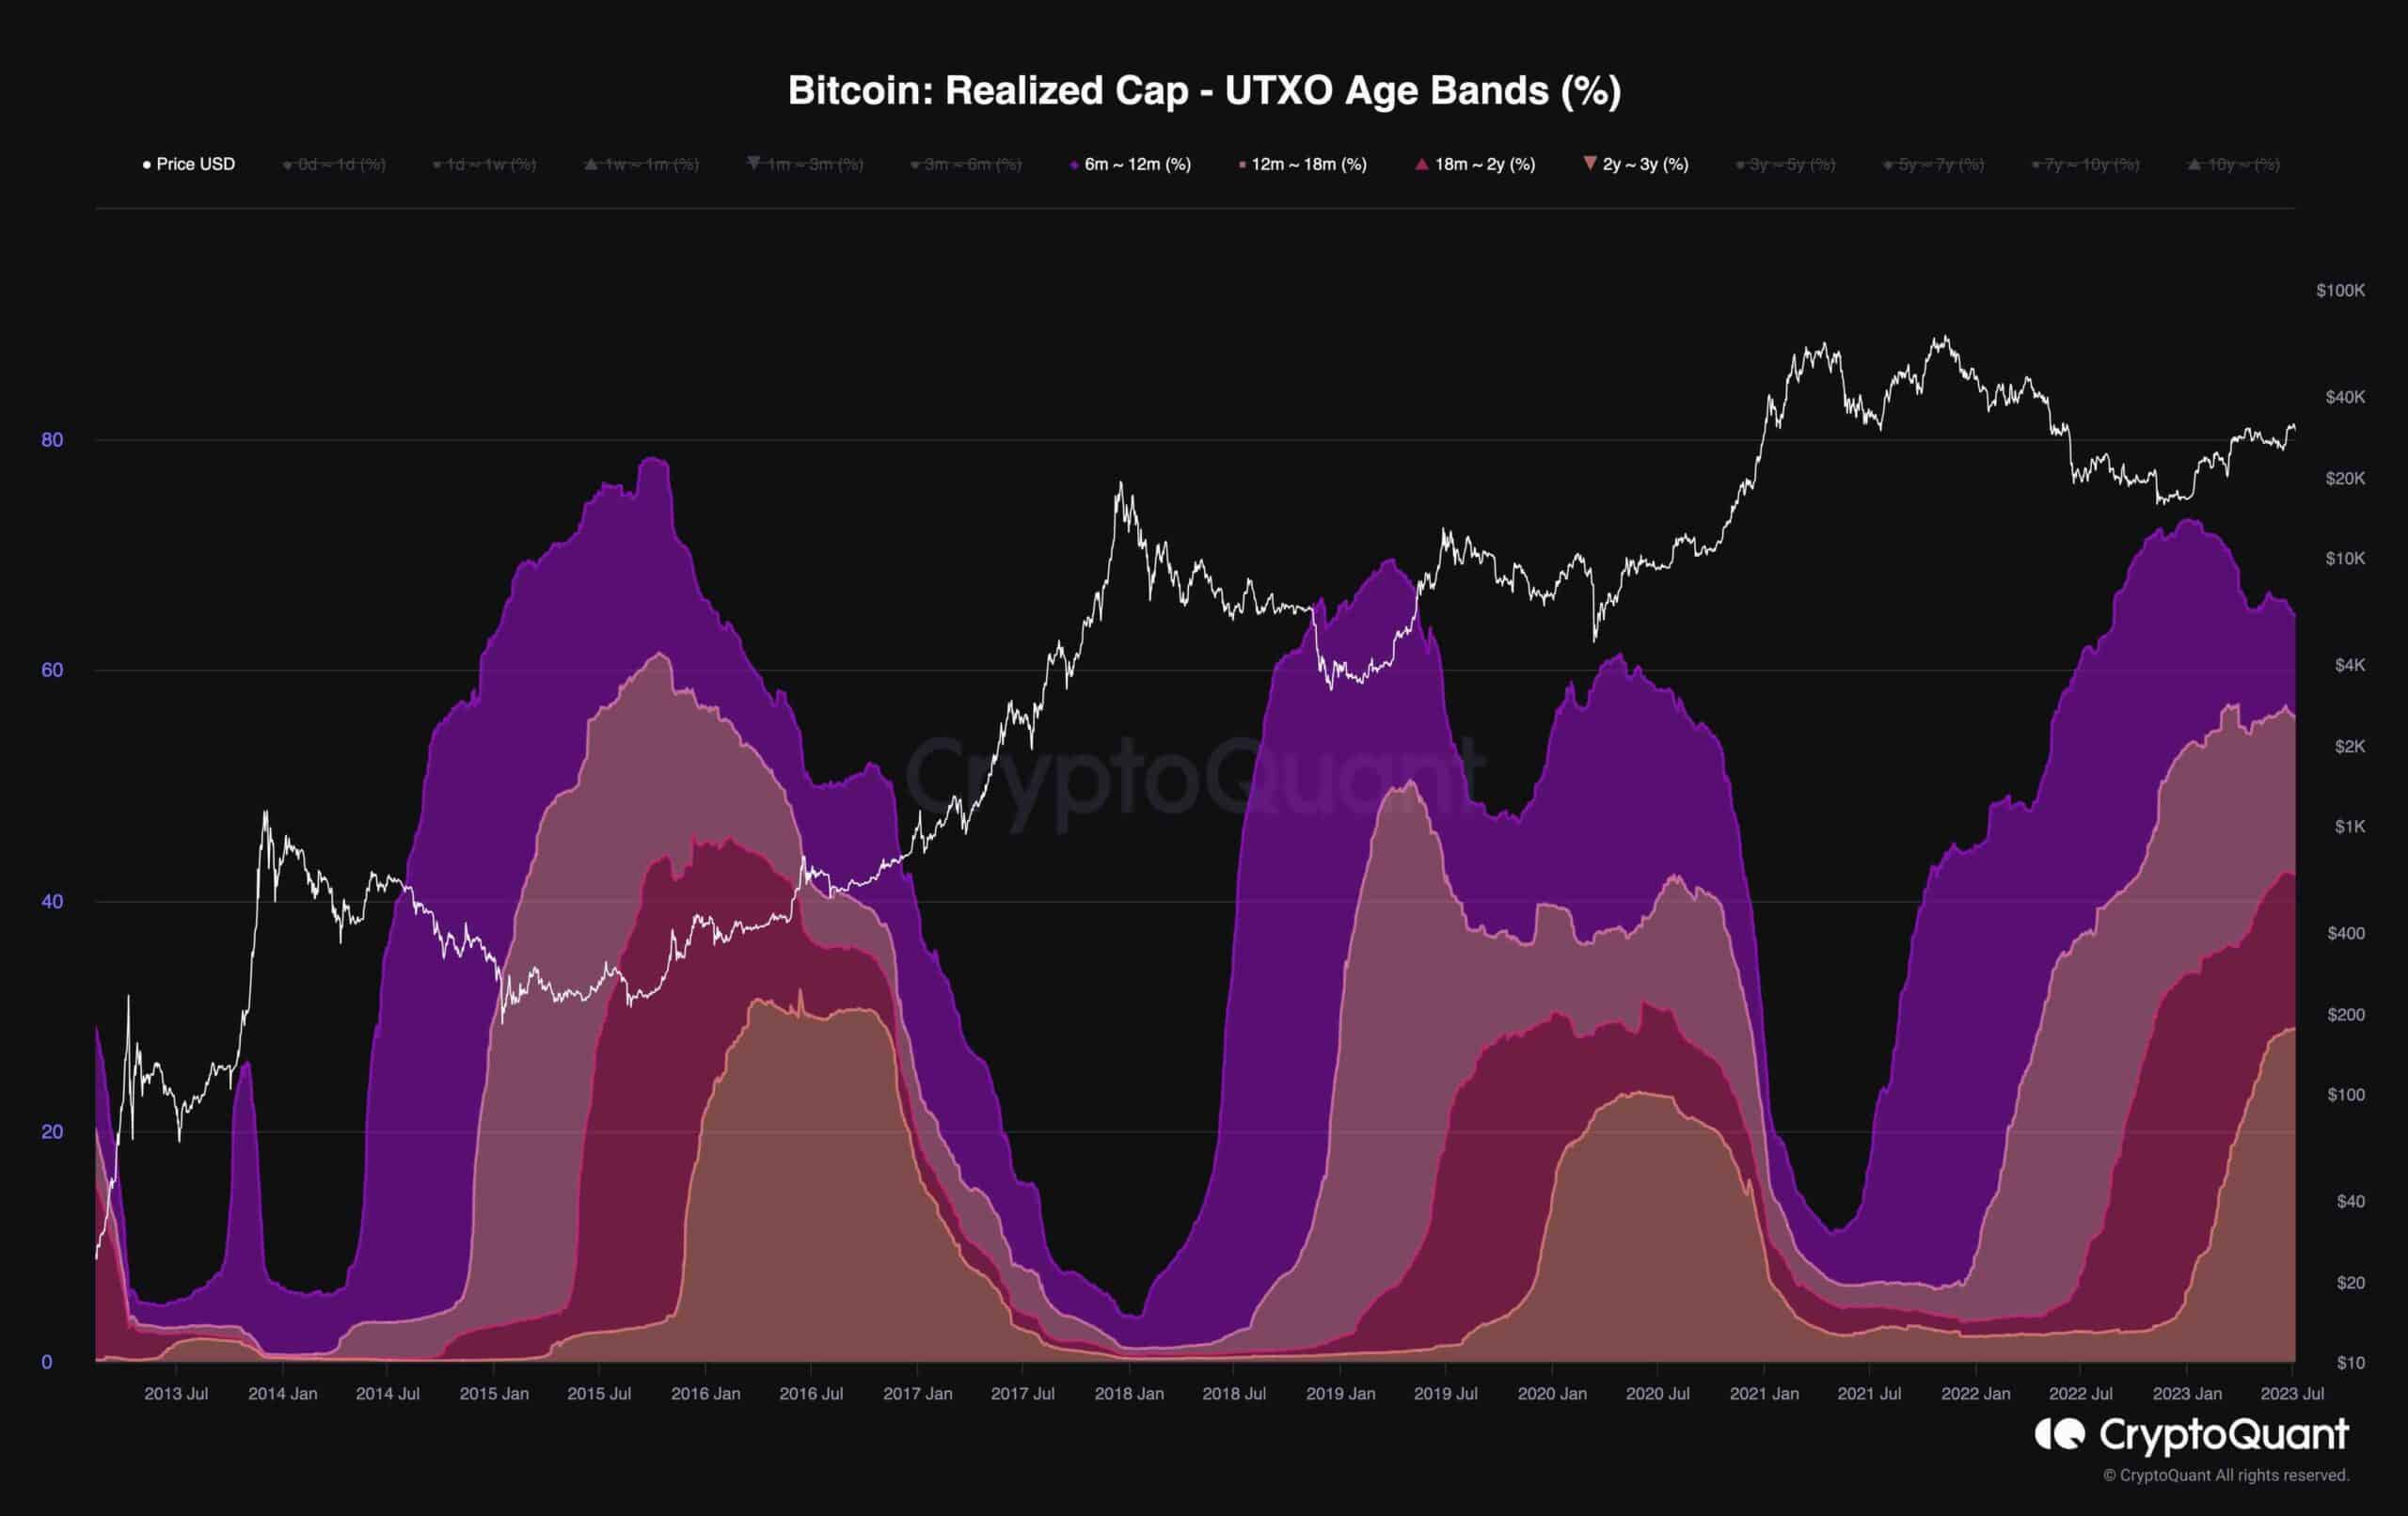
Bitcoin has experienced significant fluctuations in the past two years since it peaked at $69K and entered a bearish cycle. Various factors, such as the ongoing pandemic, inflation concerns, and the Russia-Ukraine war, have contributed to these unstable periods, resulting in an atmosphere of uncertainty and doubt prevailing in the financial markets.
The Realized Cap – UTXO Age Bands (%) metric can be employed to assess Bitcoin’s supply dynamics. This metric categorizes coins based on their lifetimes and the proportion of the total realized cap.
Despite the price plunging significantly below $20K in the recent bearish phase, the accumulation rate seems to have surpassed that of the 2018 bearish period. This observation suggests that many market participants still view Bitcoin as a valuable asset, reinforcing their confidence in its potential despite the challenges faced during this bearish cycle.