BNB/USD – Bulls Head Back Toward October HighsKey Support Levels: .17, , .Key Resistance Levels: , , .5.In the last week of September, Binance Coin dropped into the support at and rebounded to reach as high as .30 by the end of the month. As October started, BNB headed lower from this resistance but managed to find strong support at the level. A .5 Fib Retracement further bolstered this level at the .77 mark.BNB bounced from over the past couple of days and increased to above today.BNB/USD 4HR Chart. Source: TradingViewBNB-USD Short Term Price PredictionLooking ahead, the first level of resistance lies at . Above this, resistance lies at .30, .5, and .5. Additional resistance is expected at .On the other side, the first level of
Topics:
Yaz Sheikh considers the following as important: Binance Coin (BNB) Price, BNBBTC, bnbusd, Price Analysis
This could be interesting, too:
CryptoVizArt writes ETH’s Path to K Involves Maintaining This Critical Support (Ethereum Price Analysis)
Dimitar Dzhondzhorov writes Binance to Temporarily Suspend Deposits and Withdrawals on BNB Smart Chain Soon: Here’s Why
W. E. Messamore writes 4 Cryptocurrencies to Watch Following Jerome Powell Jackson Hole Update
Duo Nine writes Crypto Price Analysis June-29: ETH, XRP, ADA, DOGE, and DOT
BNB/USD – Bulls Head Back Toward October Highs
Key Support Levels: $27.17, $26, $25.
Key Resistance Levels: $30, $31, $32.5.
In the last week of September, Binance Coin dropped into the support at $23 and rebounded to reach as high as $29.30 by the end of the month. As October started, BNB headed lower from this resistance but managed to find strong support at the $26 level. A .5 Fib Retracement further bolstered this level at the $25.77 mark.
BNB bounced from $26 over the past couple of days and increased to above $29 today.

BNB-USD Short Term Price Prediction
Looking ahead, the first level of resistance lies at $30. Above this, resistance lies at $31.30, $32.5, and $33.5. Additional resistance is expected at $35.
On the other side, the first level of support lies at $27. This is followed by support at $26, $25 (.618 Fib), and $24.
The 4HR Stochastic RSI has reached overbought conditions which could suggest the market may be a little overextended.
BNB/BTC – Bulls Set Fresh October 2020 High
Key Support Levels: 0.00265 BTC, 0.0026 BTC, 0.0025 BTC.
Key Resistance Levels: 0.00274 BTC, 0.0028 BTC, 0.00285 BTC.
BNB is also performing relatively well against Bitcoin. The coin dropped lower into the support at 0.0025 BTC over the past couple of days which allowed it to rebound. After bouncing, BNB headed higher to break above the June 2018 high at 0.00265 BTC and reach the 0.00274 BTC resistance today – creating a fresh high for October.
A break above 0.00274 BTC should cause BNB to turn bullish in the short term as it heads back toward 0.003 BTC.
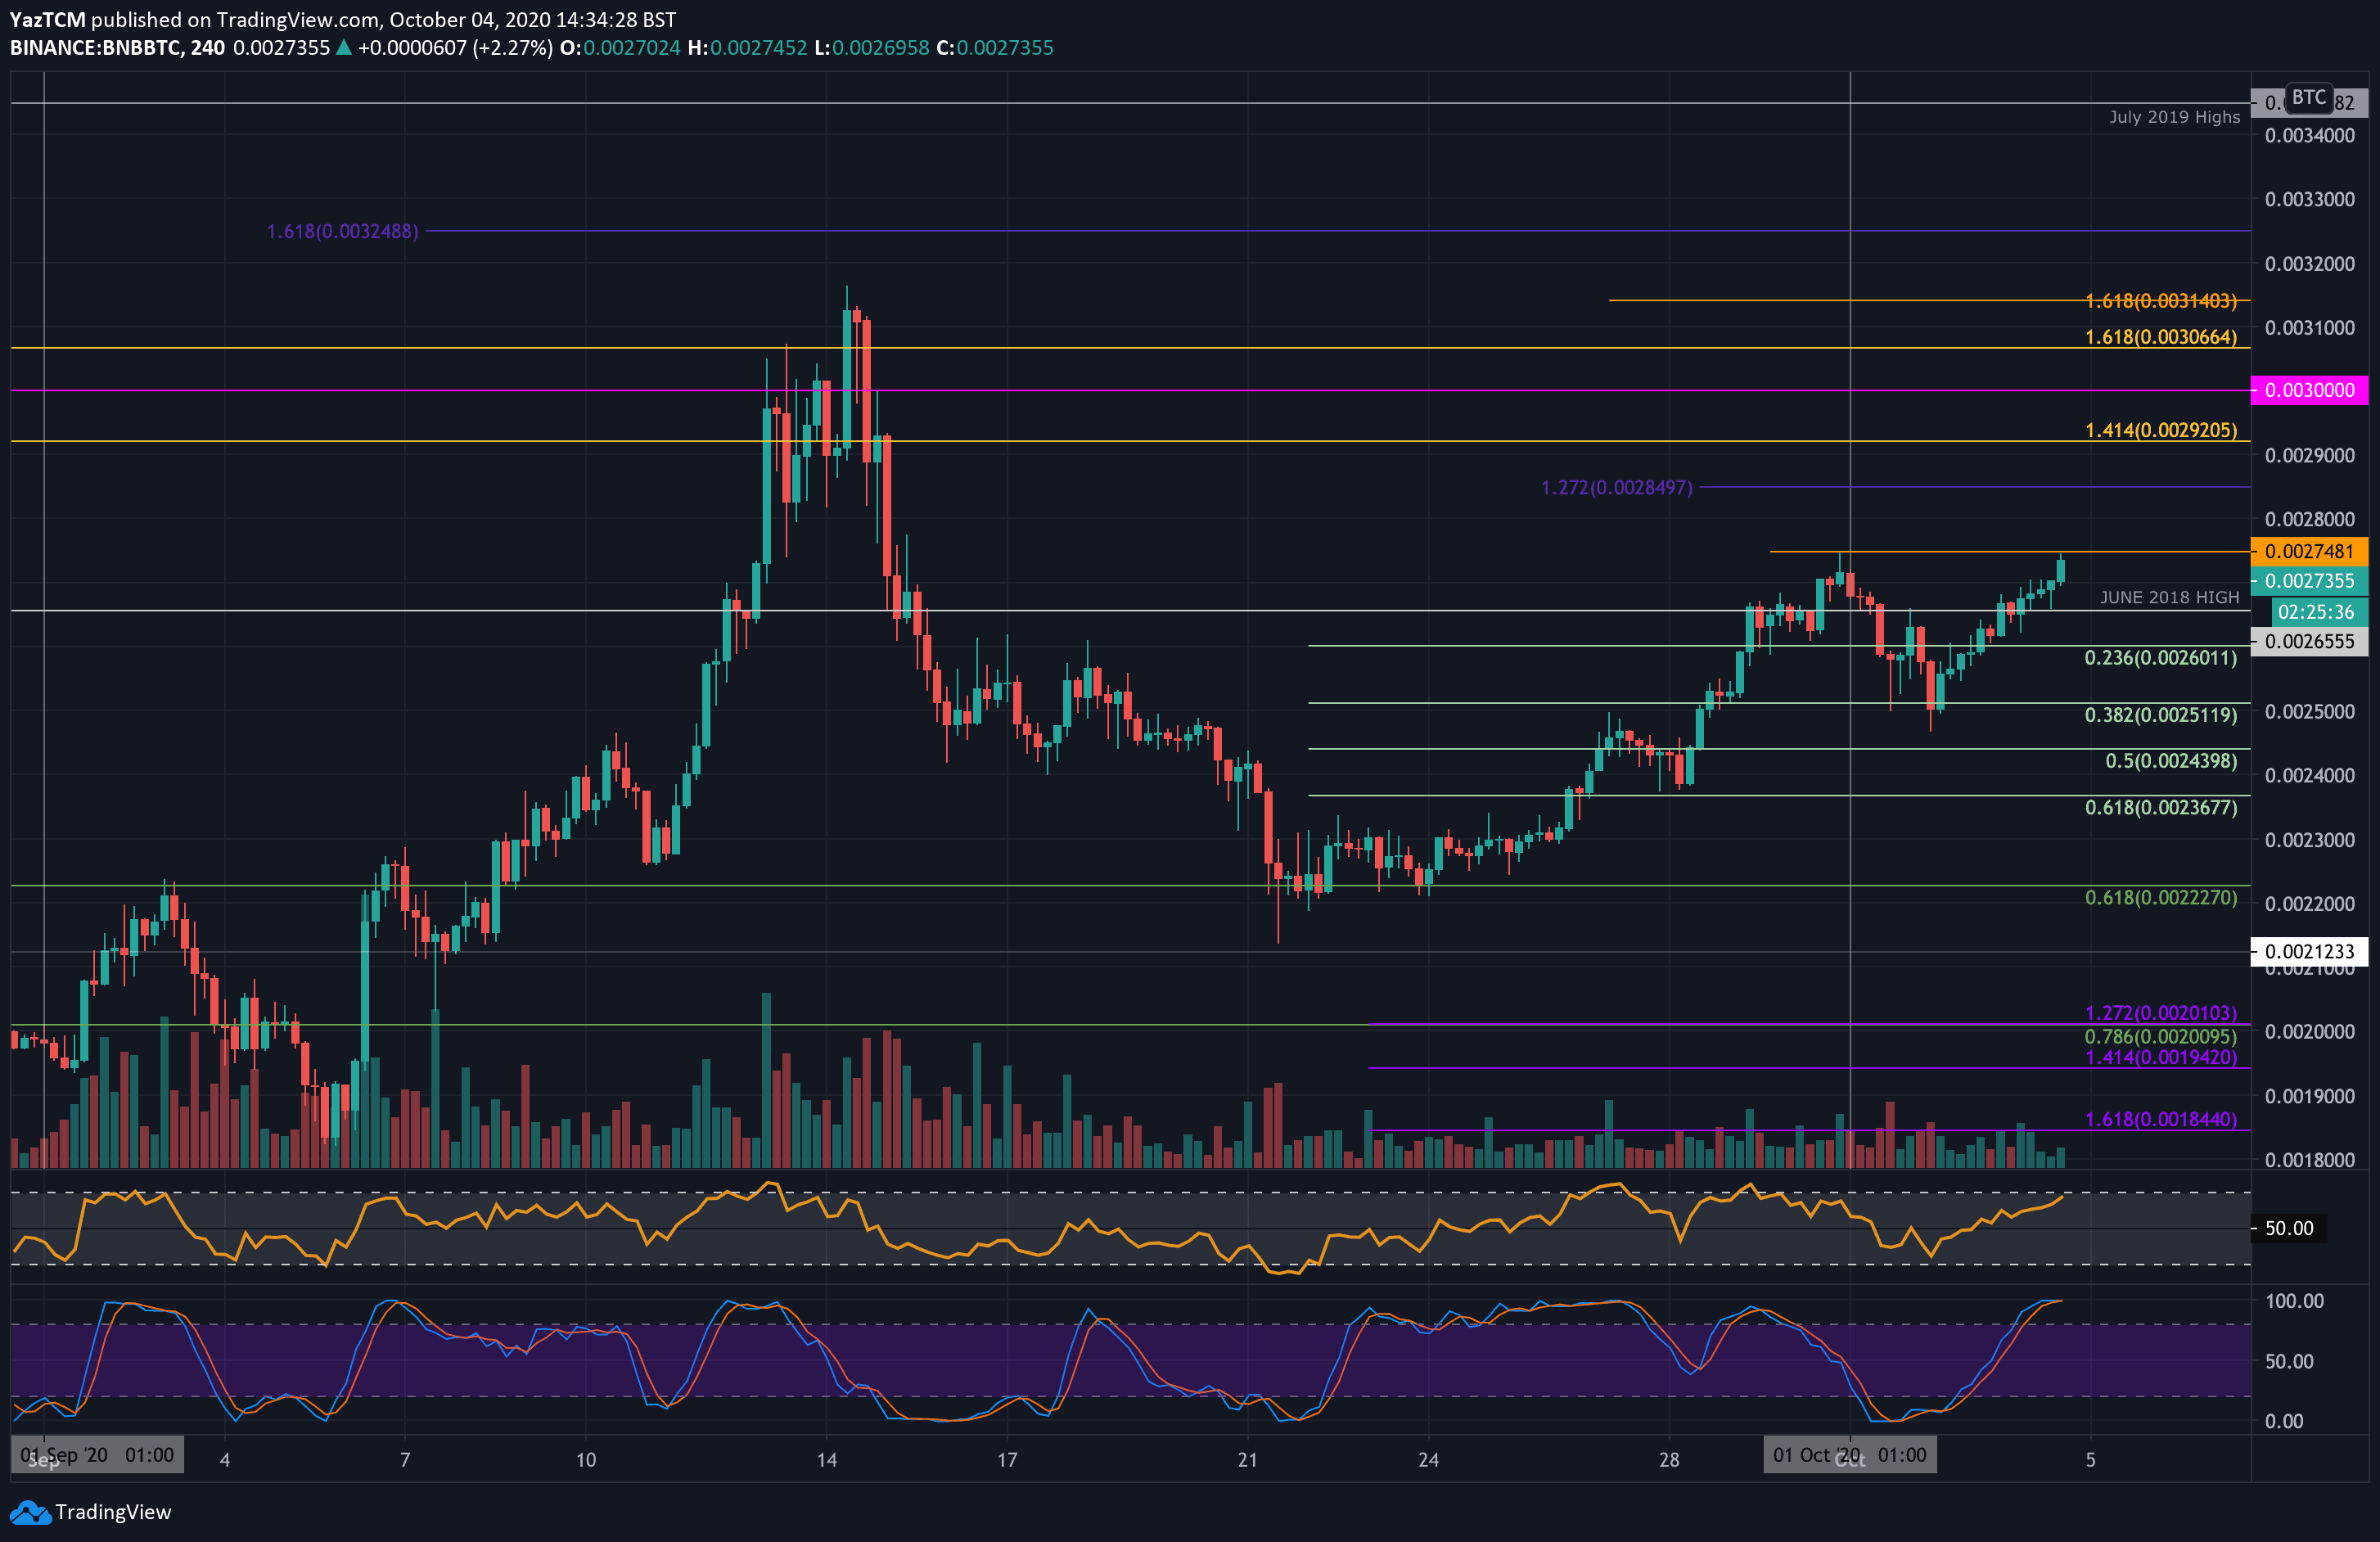
BNB-BTC Short Term Price Prediction
Moving forward, above 0.00274 BTC, resistance lies at 0.0028 BTC, 0.00285 BTC, and 0.00292 BTC (1.414 Fib Extension). This is followed by added resistance at 0.003 BTC and 0.00306 BTC (1.617 Fib Extension).
On the other side, the first level of support lies at 0.00265 BTC (June 2018 High). Beneath this, support lies at 0.0026 BTC (.236 Fib), 0.0025 BTC, and 0.00244 BTC (.5 Fib).
Likewise, the 4HR Stochastic RSI is also overbought here which could suggest the market may need to pull back slightly before heading higher again.