XRP/USD – Bulls Failing to break %excerpt%.261 Resistance Key Support Levels: %excerpt%.25, %excerpt%.245, 5, %excerpt%.24.Key Resistance Levels: %excerpt%.261, %excerpt%.271, %excerpt%.28. Last Thursday, XRP managed to rebound from the support at a rising trend line as it pushed higher. On Friday, it penetrated above the resistance at the 100-days EMA to reach as high as %excerpt%.26 – where lies the resistance at a falling trend line. It failed to penetrate above this line over the weekend and it headed lower. It spiked as low as %excerpt%.235 on Saturday, but the buyers quickly recovered on Sunday to push it back above %excerpt%.25. Today, XRP continues to trade sideways within the confines of this symmetrical triangle. The market has been extremely choppy between %excerpt%.23 and %excerpt%.26 for the past five weeks and must break one of these
Topics:
Yaz Sheikh considers the following as important: Ripple (XRP) Price, XRP Analysis, xrpbtc, xrpusd
This could be interesting, too:
Jordan Lyanchev writes 0M in Liquidations as Bitcoin Dumps Below K, Ripple Down 10% Daily
Mandy Williams writes Layer-1 Assets Rally as Market Anticipates Trump’s Pro-Crypto Administration: CryptoQuant
Jordan Lyanchev writes How High Can Ripple (XRP) Go With Gary Gensler Out of the Picture? (AI Bots Analyze)
George Georgiev writes Ripple (XRP) Price Pumps 5% Following News that Gary Gensler Will Quit
XRP/USD – Bulls Failing to break $0.261 Resistance
Key Support Levels: $0.25, $0.245, $235, $0.24.
Key Resistance Levels: $0.261, $0.271, $0.28.
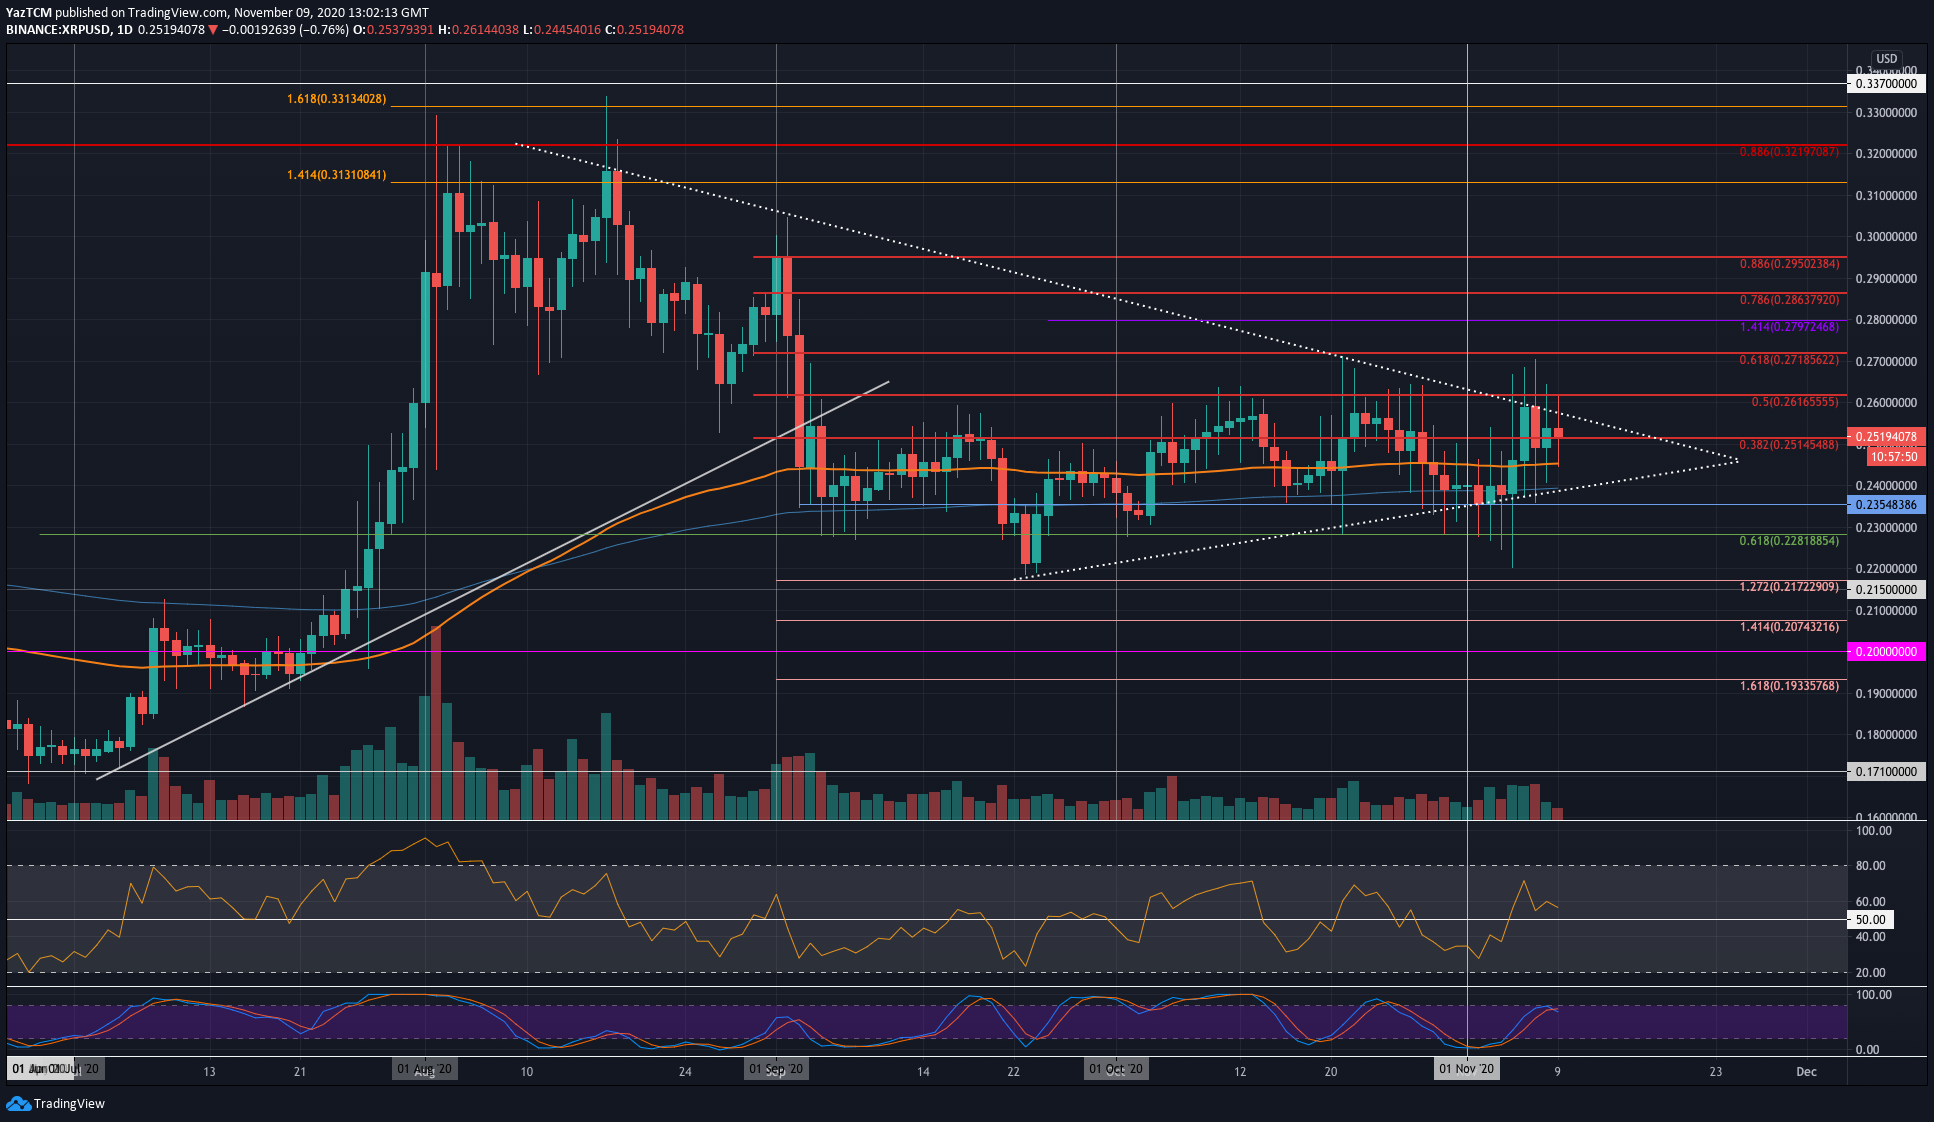
Last Thursday, XRP managed to rebound from the support at a rising trend line as it pushed higher. On Friday, it penetrated above the resistance at the 100-days EMA to reach as high as $0.26 – where lies the resistance at a falling trend line.
It failed to penetrate above this line over the weekend and it headed lower. It spiked as low as $0.235 on Saturday, but the buyers quickly recovered on Sunday to push it back above $0.25. Today, XRP continues to trade sideways within the confines of this symmetrical triangle.
The market has been extremely choppy between $0.23 and $0.26 for the past five weeks and must break one of these boundaries to start trending again.

XRP-USD Short Term Price Prediction
Moving forward, if the bulls can break the resistance at the upper boundary of the triangle, the first level of higher resistance is located at $0.261 (bearish .5 Fib Retracement). Above this, resistance is located at $0.271 (bearish .618 Fib Retracement) and $0.28.
On the other side, the first level of support lies at $0.25. Beneath this, support lies at the 100-days EMA at $0.245 and then the 200-days EMA at $0.24 (also lower boundary of the triangle). Added support is expected at $0.235 and $0.228 (.618 Fib).
The Stochastic RSI has produced a bearish crossover signal, which could push the market lower if it continues to follow through.
XRP/BTC – Bears Back On The Offensive
Key Support Levels: 1610 SAT, 1555 SAT, 1525 SAT.
Key Resistance Levels: 1700 SAT, 1755 SAT, 1800 SAT.
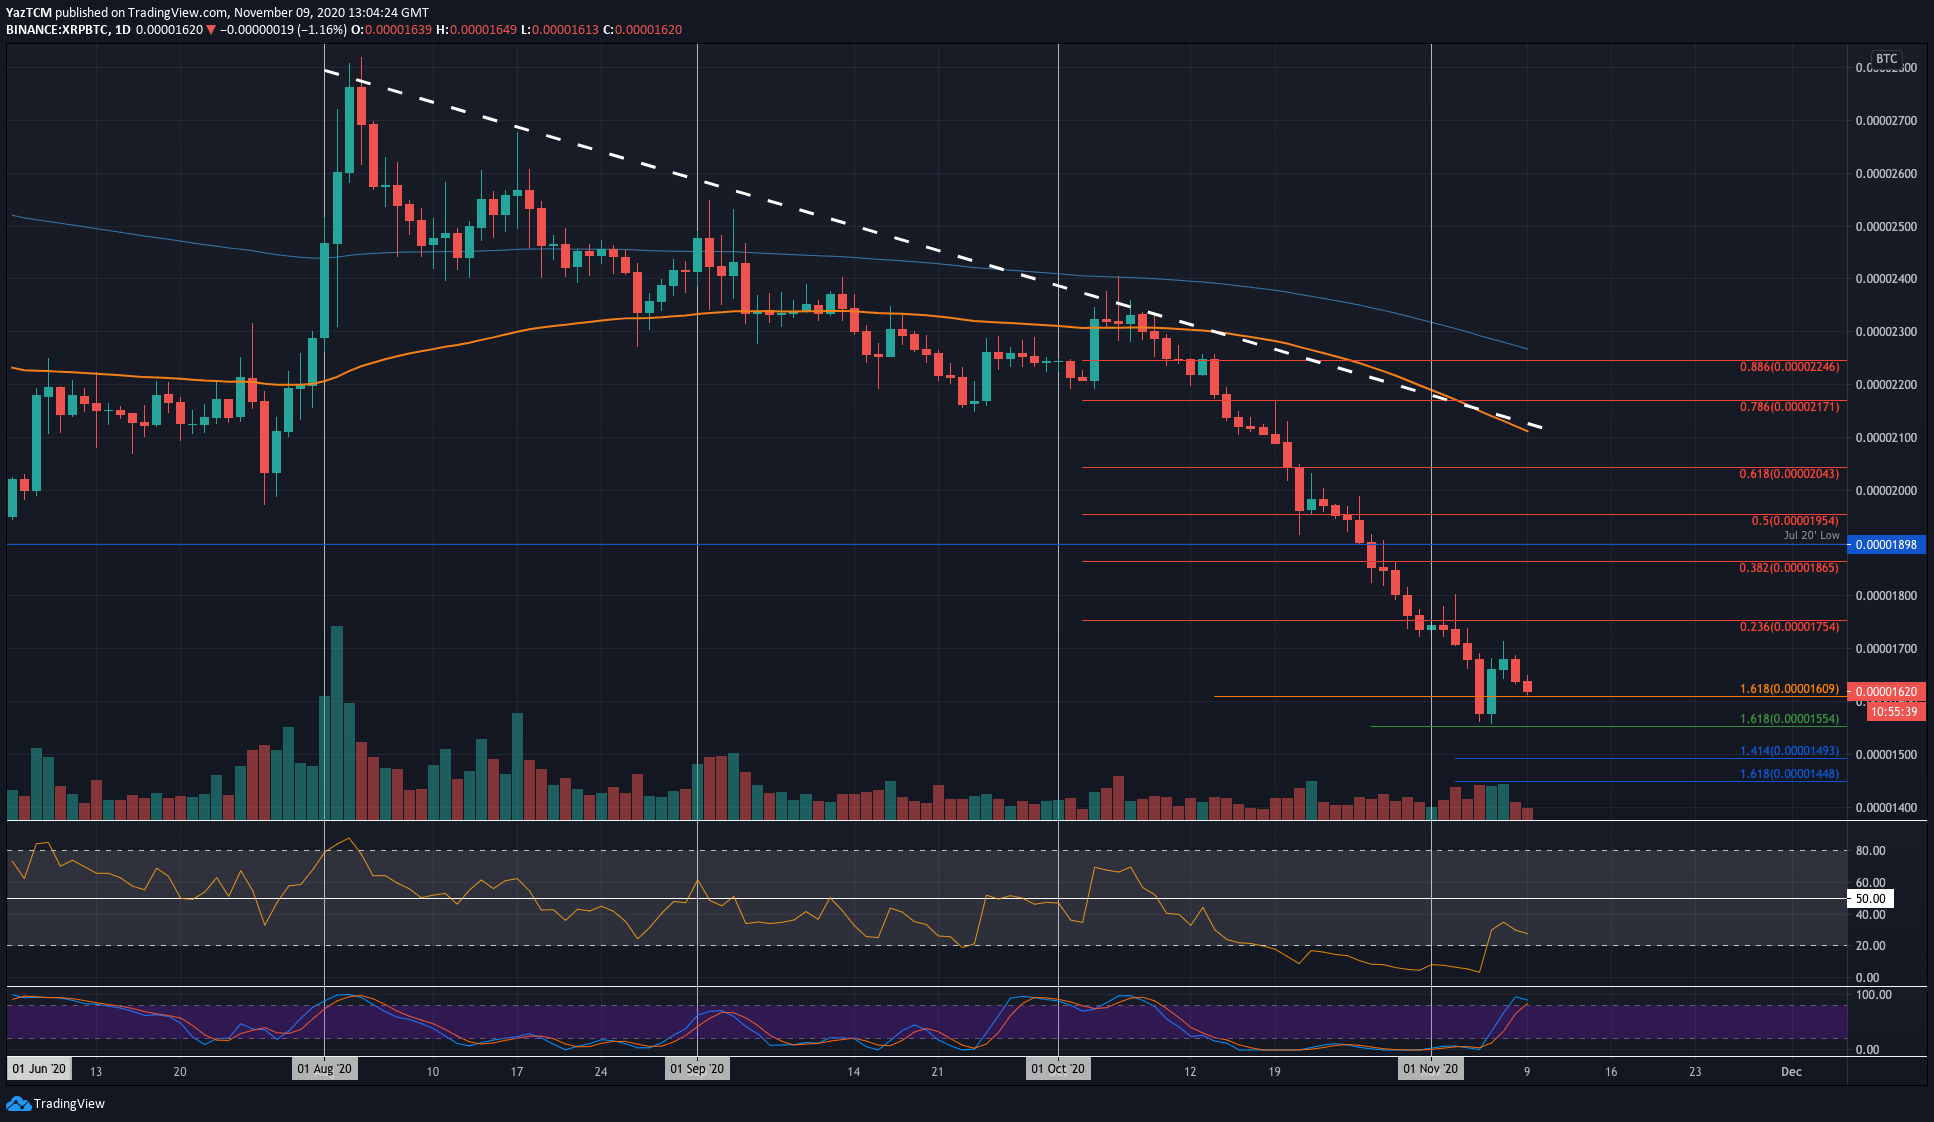
It seems that the sellers are shaping up for another push lower against Bitcoin. The bears pushed the market as low as 1555 SAT on Friday, which allowed a rebound to occur. The buyers were unable to continue above 1700 SAT on Saturday as the coin rolled over.
Today, the bears have pushed XRP back into the 1610 SAT support and are looking to drive the coin lower.

XRP-BTC Short Term Price Prediction
Looking ahead, if the sellers break beneath 1610 SAT and push XRP below 1600 SAT, the first level of support lies at 1555 SAT. Following this, support lies at 1493 SAT (downside 1.414 FIb Extension), 1450 SAT, and 1400 SAT.
On the other side, resistance lies at 1700 SAT, 1755 SAT (bearish .236 Fib Retracement), 1800 SAT, and 1865 SAT (bearish .382 FIb).
The Stochastic RSI is shaping up for a bearish crossover signal that should send the market lower. The RSI is also pointing lower to indicate the bearish momentum might start to increase again.
