SummaryEthereum saw some brief stabilization this week after the cryptocurrency rebounded from 5 and broke above the resistance at 0.Against Bitcoin, ETH surged higher from the 0.017 BTC support as it trades at 0.018 BTC.Despite the recent price rebound, Ethereum has still lost a total of 10% over the past 30 days of trading.Key Support & Resistance LevelsETH/USDSupport: 0, 8, 0, 8.Resistance: 5, 2, 0.ETH/BTC:Support: 0.0171 BTC, 0.0169 BTC, 0.0164 BTC.Resistance: 0.0179 BTC, 0.0184 BTC, 0.019 BTC.ETH/USD – ETH Finally Makes Ground Above 3.50 Since our last analysis, ETH initially fell lower from the resistance at 3.50 but managed to find support at 5. Over the past couple of days, it started to increase even higher, allowing it to break above the
Topics:
Yaz Sheikh considers the following as important: ETH Analysis
This could be interesting, too:
CryptoVizArt writes Will Weak Momentum Drive ETH to .5K? (Ethereum Price Analysis)
CryptoVizArt writes Ethereum Price Analysis: Following a 15% Weekly Crash, What’s Next for ETH?
CryptoVizArt writes ETH Seems Primed to Take Down K After Recent Rebound: Ethereum Price Analysis
CryptoVizArt writes Ethereum Price Analysis: Can ETH Take Down K Resistance After Gaining 10% Weekly?
Summary
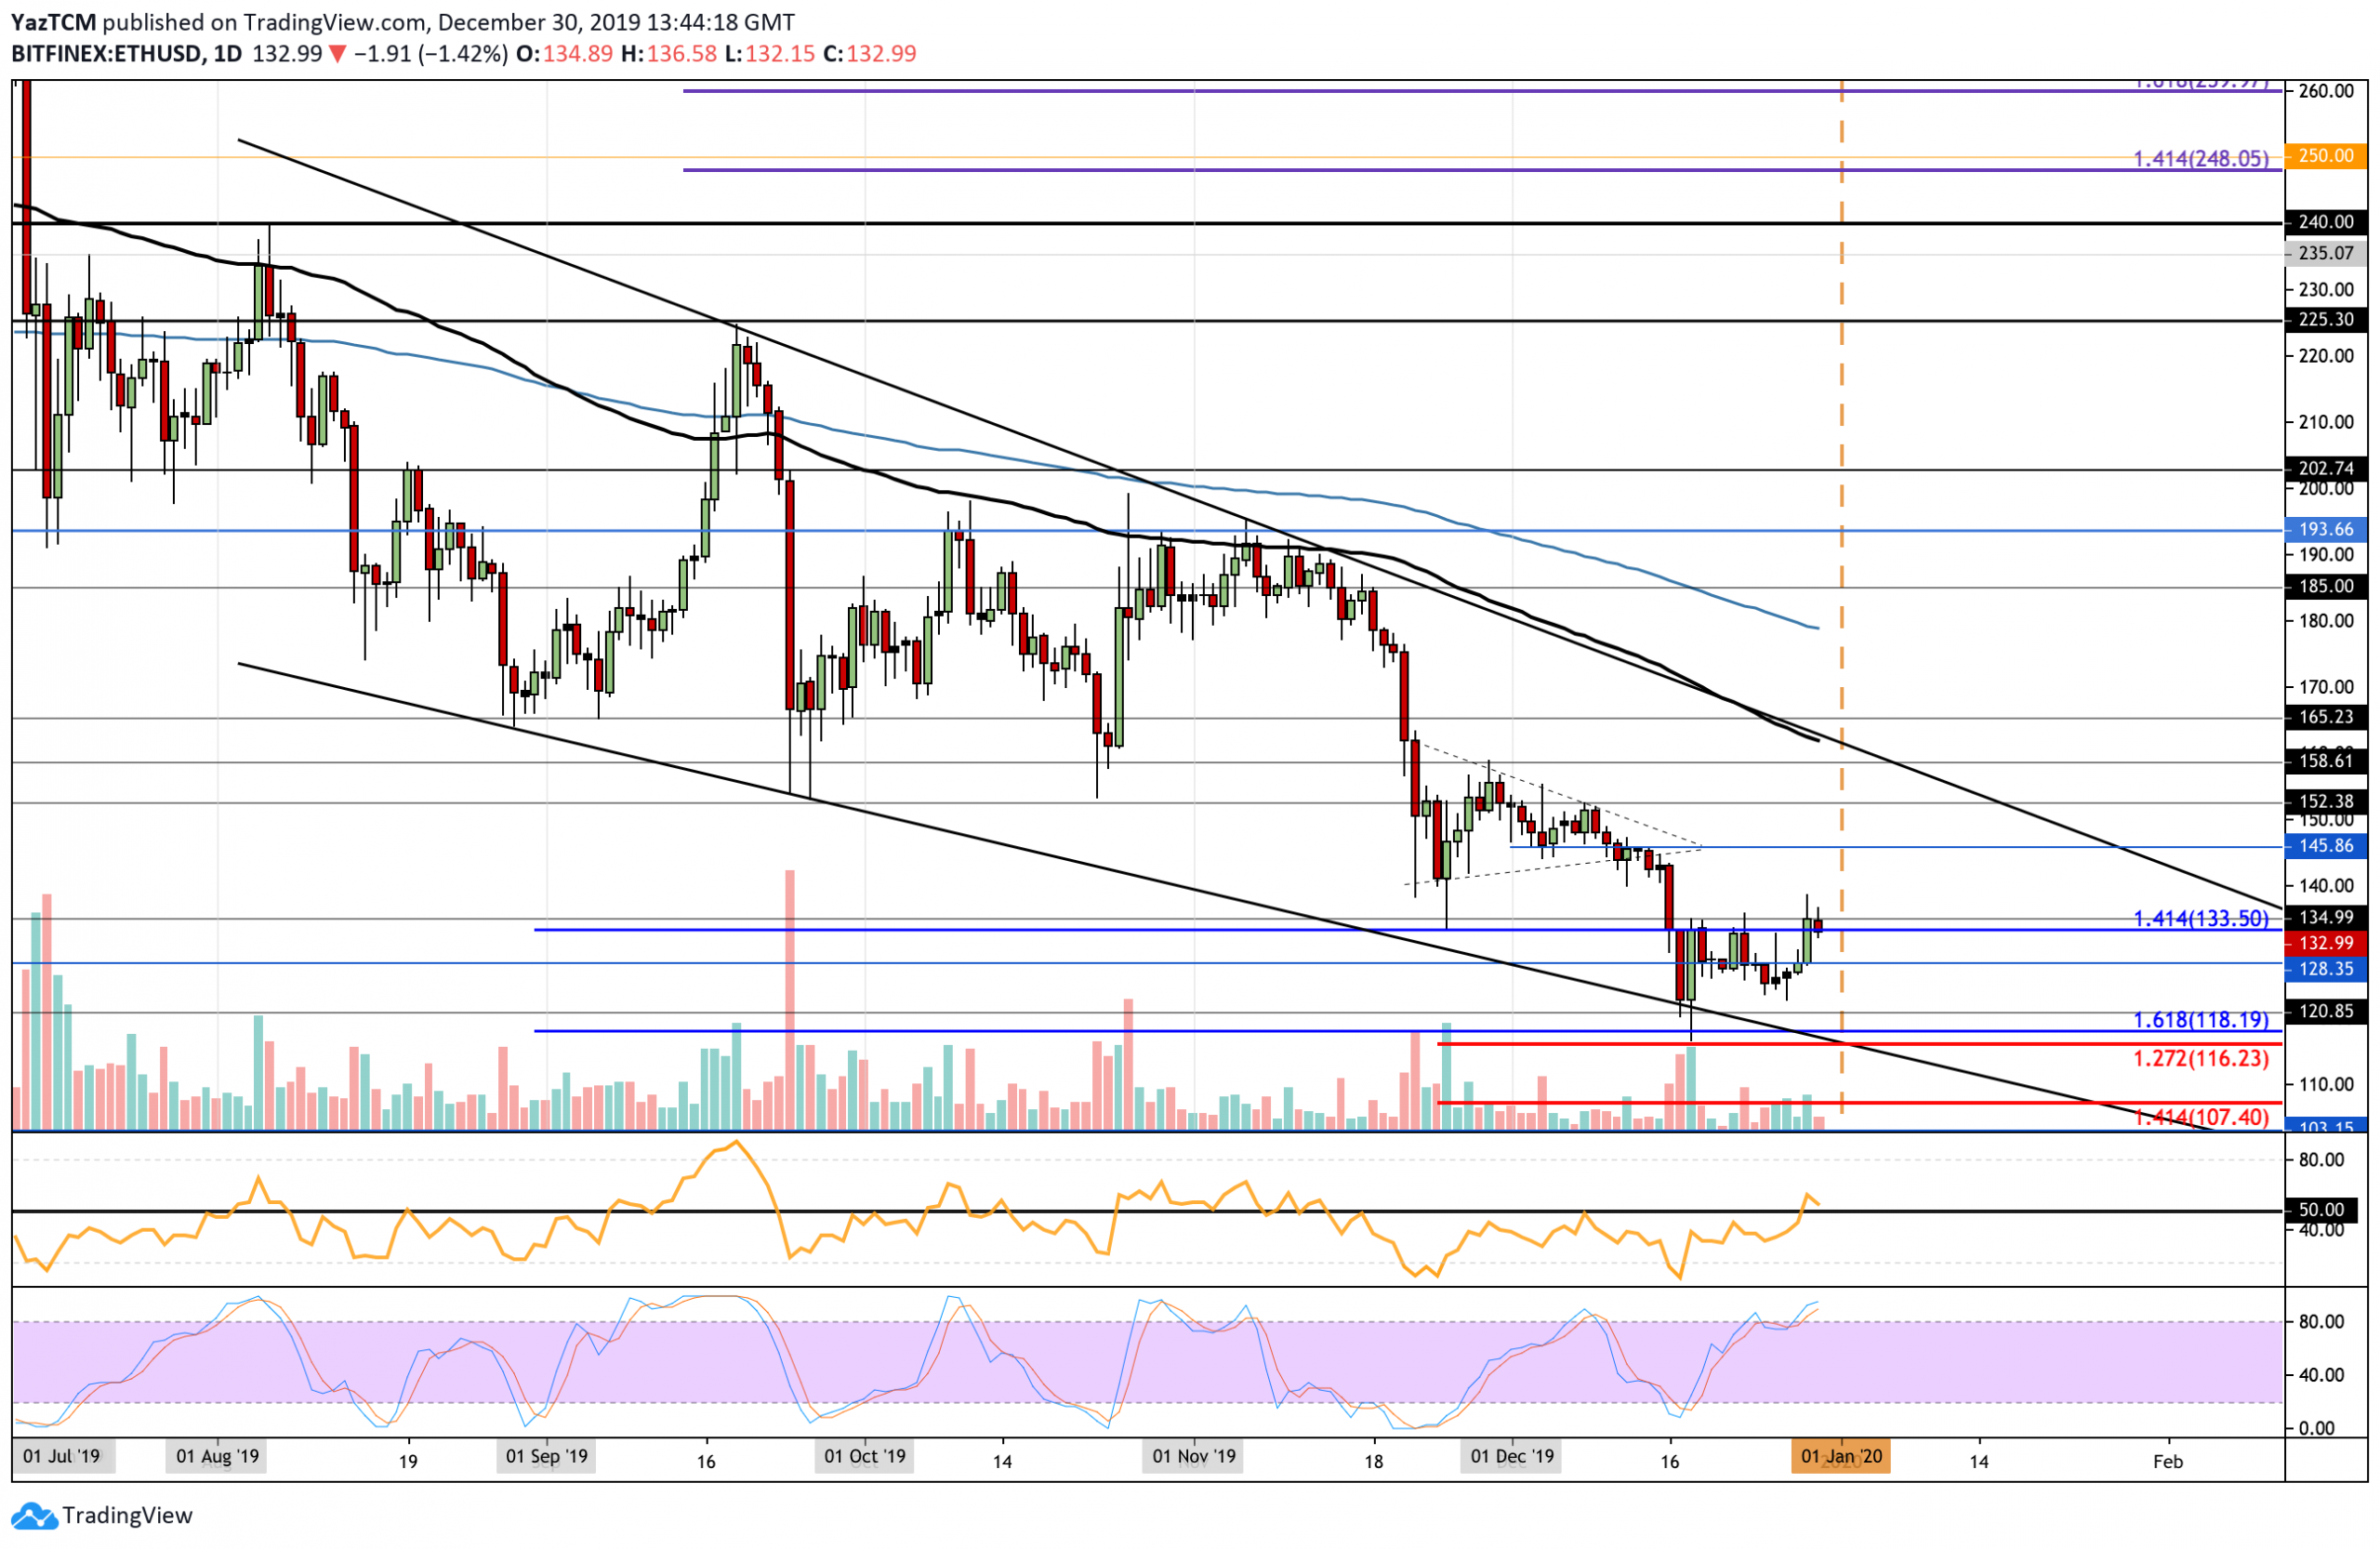
- Ethereum saw some brief stabilization this week after the cryptocurrency rebounded from $125 and broke above the resistance at $130.
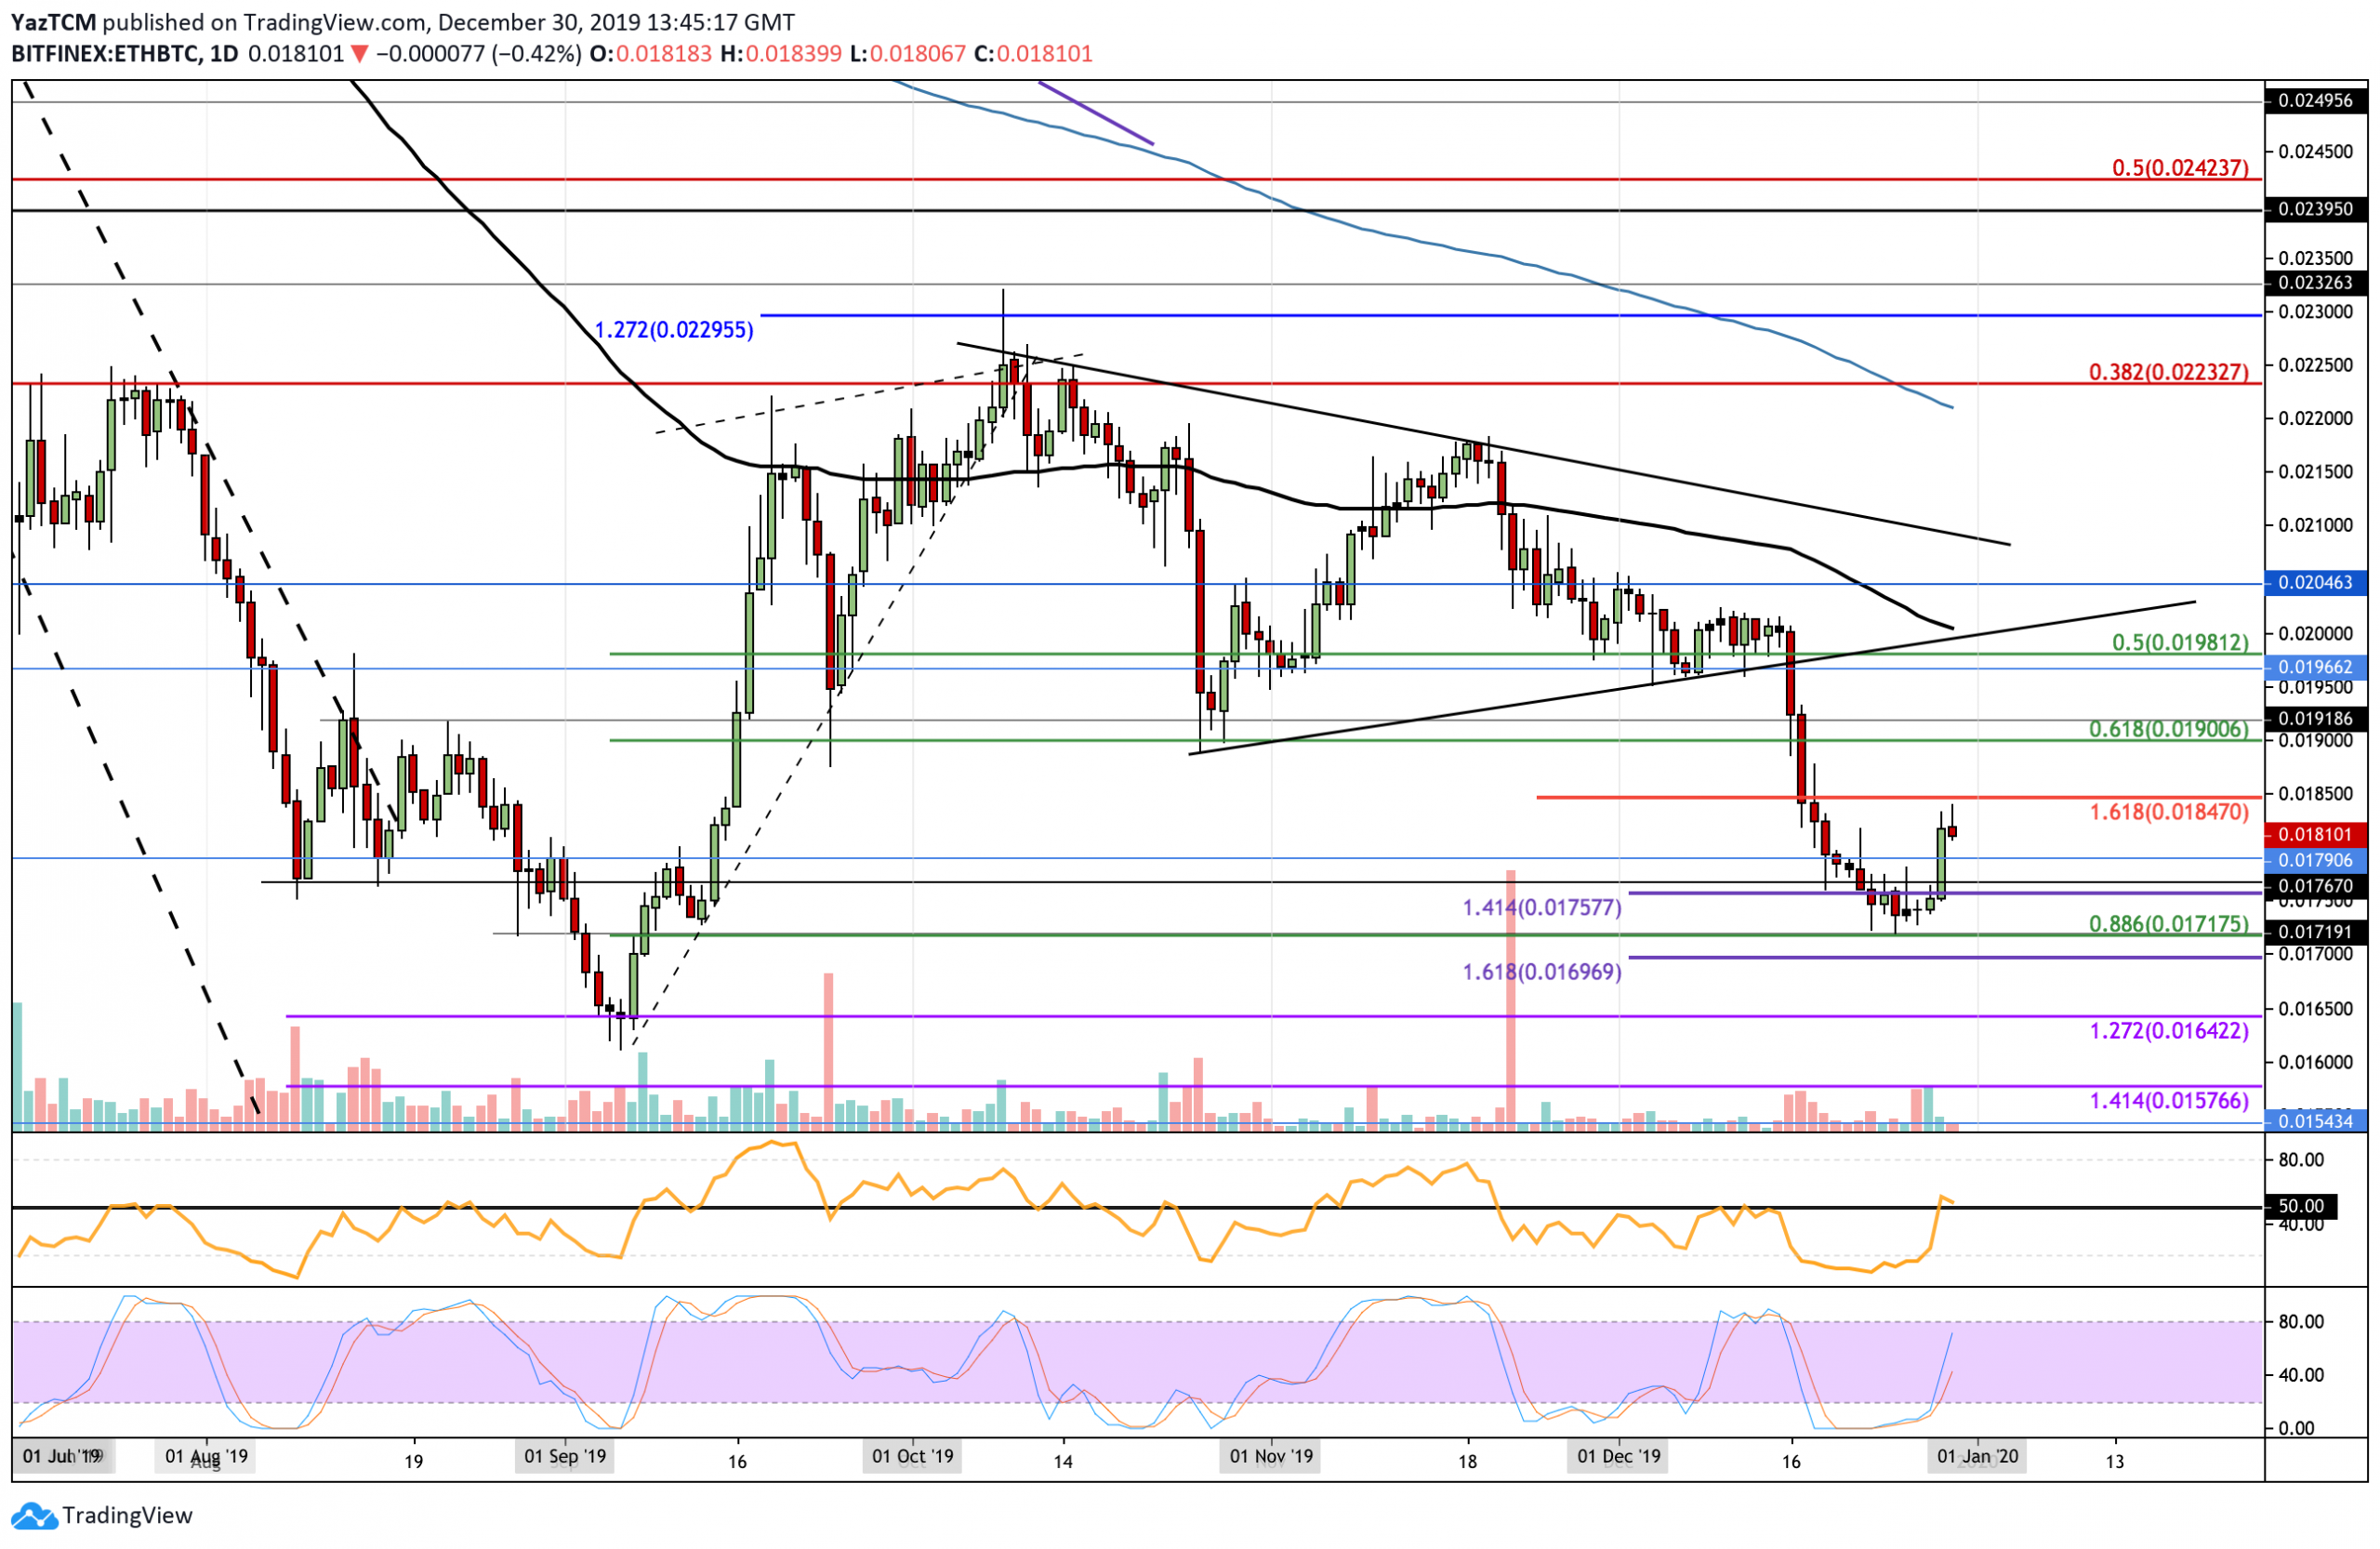
- Against Bitcoin, ETH surged higher from the 0.017 BTC support as it trades at 0.018 BTC.
- Despite the recent price rebound, Ethereum has still lost a total of 10% over the past 30 days of trading.
Key Support & Resistance Levels
ETH/USD
Support: $130, $128, $120, $118.
Resistance: $145, $152, $160.
ETH/BTC:
Support: 0.0171 BTC, 0.0169 BTC, 0.0164 BTC.
Resistance: 0.0179 BTC, 0.0184 BTC, 0.019 BTC.
ETH/USD – ETH Finally Makes Ground Above $133.50
Since our last analysis, ETH initially fell lower from the resistance at $133.50 but managed to find support at $125. Over the past couple of days, it started to increase even higher, allowing it to break above the resistance at $133.50 to reach the $135 level. Ethereum was unable to break the resistance at $133.50, causing it to roll over toward support at $130.
Ethereum is still a long way to be considered as bullish. A break above the December highs at $152 would confirm a bullish trend. If ETH was to drop beneath the support at $125, the market would then be considered as bearish.
Ethereum Short Term Price Prediction
If the bulls continue to push Ethereum beyond the $135 resistance, initial higher resistance is expected at the $145 and $152 levels. Above this, higher resistance lies at $158, $160 (100-days EMA), and $165. On the other hand, if the sellers push lower from $135, initial support is found at $128 and $125. Beneath this, additional support is found at $120, $118, and $116.
The RSI has recently penetrated above the 50 level, which shows the buyers are starting to gain control over the market momentum. If the RSI can remain above 50 and continue to travel higher, ETH should be headed toward $150. However, the Stochastic RSI is trading in overbought conditions and is primed for a bearish crossover signal that would send the market lower.
ETH/BTC – ETH Rebounds Strongly From 0.0171 BTC Support
Against Bitcoin, ETH tested the support at 0.0171 BTC (.886 Fibonacci Retracement) again before rebounding higher from this support. After rebounding, ETH started to rocket higher as it reaches the 0.018 BTC level.
For this market to be considered ‘bullish,’ ETH must continue to rise further higher and break above the resistance at 0.02 BTC. For this market to be considered as bearish, ETH must fall and break beneath the support at 0.0171 BTC.
Ethereum/BTC Short Term Price Prediction
If the bulls can continue to drive further higher from the resistance at 0.018 BTC, higher resistance lies at 0.0185 BTC and 0.019 BTC (0.618 Fib Retracement). Above this, resistance is found at 0.0198 BTC, 0.020 BTC (100-days EMA), and 0.0204 BTC. Alternatively, if the bears start to push the market lower, initial support is found at 0.0179 BTC. Beneath this, support is found at 0.0175 BTC, 0.0171 BTC, and 0.0169 BTC.
The RSI has recently poked above the 50 level, which shows the bulls attempting to take control over the market momentum. Similarly, the Stochastic RSI recently produced a bullish crossover signal that helped to send the market higher.


