Ethereum saw a sharp 7.65% price plummet over the past 24 hours and it currently trades at 9.6. This price decline is largely a result of Bitcoin dropping by a steep 9% as it collapses beneath the ,700 support. ETH remains promising against BTC which might even stall the decline against the USD. Ethereum is the second-largest cryptocurrency with a market cap of .39 billion. Looking at the ETH/USD 1-day chart:Since our previous ETH/USD analysis, the cryptocurrency collapsed beneath the support at 1 and continued further towards the support at 8.61 where the market rebounded briefly.From above: The nearest level of resistance lies at 5.42. Above this, resistance lies at 0, 1.97, 6.48, and 0. If the bulls can climb above 0, resistance is found at 5, 3.66
Topics:
Yaz Sheikh considers the following as important: ETH Analysis
This could be interesting, too:
CryptoVizArt writes Will Weak Momentum Drive ETH to .5K? (Ethereum Price Analysis)
CryptoVizArt writes Ethereum Price Analysis: Following a 15% Weekly Crash, What’s Next for ETH?
CryptoVizArt writes ETH Seems Primed to Take Down K After Recent Rebound: Ethereum Price Analysis
CryptoVizArt writes Ethereum Price Analysis: Can ETH Take Down K Resistance After Gaining 10% Weekly?
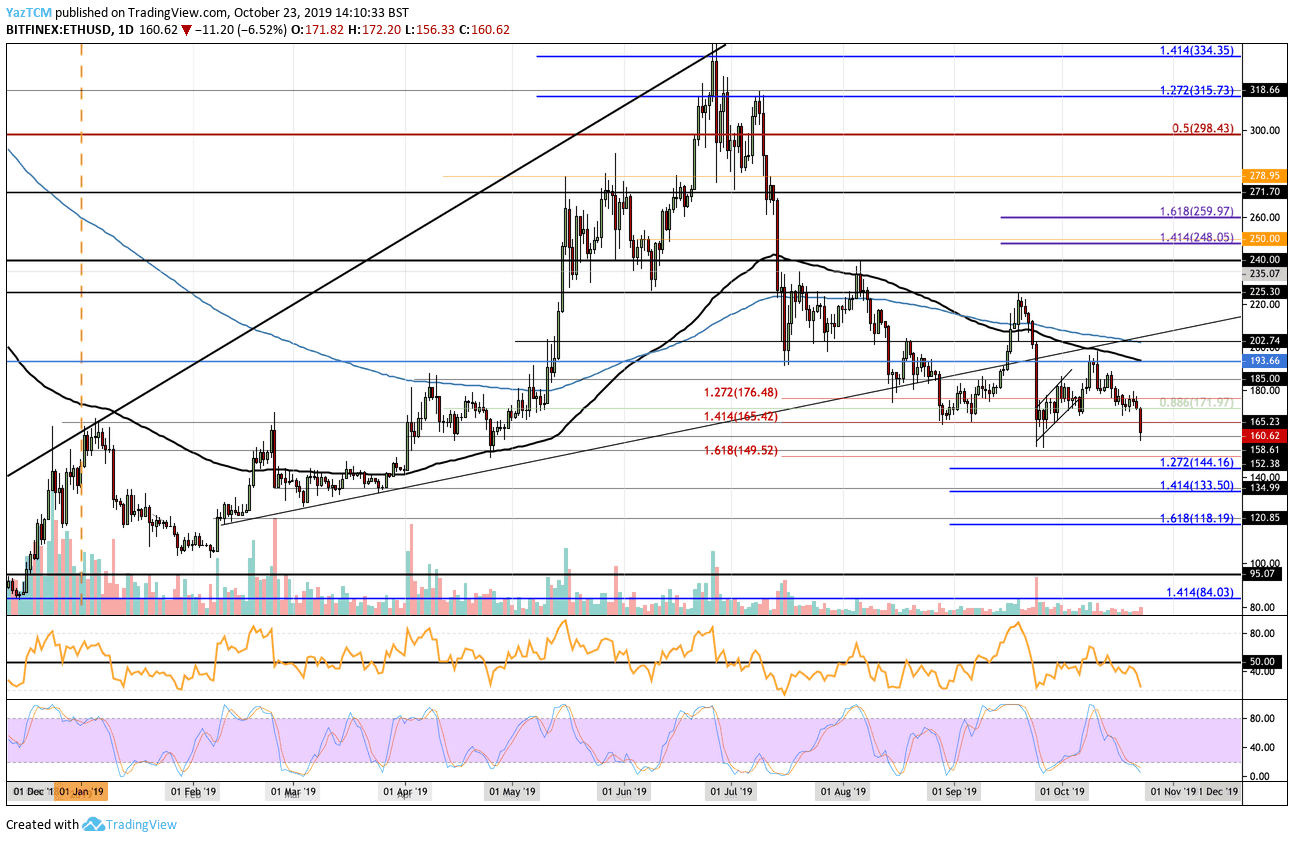
Ethereum saw a sharp 7.65% price plummet over the past 24 hours and it currently trades at $159.6. This price decline is largely a result of Bitcoin dropping by a steep 9% as it collapses beneath the $7,700 support. ETH remains promising against BTC which might even stall the decline against the USD.
Ethereum is the second-largest cryptocurrency with a market cap of $17.39 billion.
Looking at the ETH/USD 1-day chart:
- Since our previous ETH/USD analysis, the cryptocurrency collapsed beneath the support at $171 and continued further towards the support at $158.61 where the market rebounded briefly.
- From above: The nearest level of resistance lies at $165.42. Above this, resistance lies at $170, $171.97, $176.48, and $180. If the bulls can climb above $180, resistance is found at $185, $193.66 (100-days EMA), and $200.
- From below: The nearest level of support lies at $158.61. Beneath this, support is at $155 and $152.50 (September low). If the selling continues beneath $150, support can be found at $149.52, $144.16 (downside 1.272 Fib Extension), $140, and $133.50 (downside 1.414 Fib Extension).
- The trading volume remains relatively low.
- The RSI has plummeted toward the bearish favor as it lies beneath the 50 level. The Stochastic RSI has reached oversold conditions which could suggest that the selling may be concluding as we wait for a bullish crossover signal to send us higher.
Looking at the ETH/BTC 1-day chart:
- Against BTC, ETH fell lower but managed to remain strongly supported at the 0.021 BTC level. It looks strong during this current BTC sell-off and may help to prevent the cryptocurrency from dropping too heavily.
- From above: The nearest level of resistance lies at 0.02155 BTC. Above this, resistance is located at 0.022 BTC, 0.002232 BTC (bearish .382 Fib Retracement), 0.02295 BTC, 0.02363 BTC, and 0.024 BTC.
- From below: The nearest level of support is at 0.021 BTC. Beneath this, support lies at 0.0204 BTC, 0.02 BTC, 0.01966 BTC, and 0.019 BTC.
- The trading volume has surged significantly in today’s market bloodbath.
- The RSI is beneath the 50 level but the Stochastic RSI is in extreme oversold conditions and is primed for a bullish crossover signal. This suggests that a potential bull run is incoming for ETHBTC.


