XRP rebounded at the %excerpt%.18 support this week but failed to climb above the resistance at %excerpt%.20.Against BTC, it is still on the bearish footing as the momentum lies with the sellers.The cryptocurrency remains the 3rd largest project with a total market cap value of .40 billion.Key Support & Resistance LevelsXRP/USDSupport: %excerpt%.181, %excerpt%.17, %excerpt%.167. Resistance: %excerpt%.19, %excerpt%.20, %excerpt%.212.XRP/BTC:Support: 2600 SAT, 2530 SAT, 2455 SAT.Resistance: 2750 SAT, 2900 SAT, 3000 SAT.XRP/USD: Bounces From The %excerpt%.18 SupportThe daily chart shows XRP rebounding from the support at %excerpt%.181, allowing it to climb higher toward %excerpt%.20. However, it is struggling to break above %excerpt%.20, leading to the cryptocurrency to trade sideways during the last few days. If XRP were to reverse and drop beneath the support at %excerpt%.181,
Topics:
Yaz Sheikh considers the following as important: Ripple (XRP) Price, XRP Analysis
This could be interesting, too:
Mandy Williams writes Ripple Releases Institutional DeFi Roadmap for XRP Ledger in 2025
Jordan Lyanchev writes ChatGPT and DeepSeek Analyze Ripple’s (XRP) Price Potential for 2025
CryptoVizArt writes XRP Breakout Imminent? Ripple Price Analysis Suggests a Decisive Move
Dimitar Dzhondzhorov writes 6 Reasons Why This Finance Expert Dumped His Ripple (XRP) Holdings
- XRP rebounded at the $0.18 support this week but failed to climb above the resistance at $0.20.
- Against BTC, it is still on the bearish footing as the momentum lies with the sellers.
- The cryptocurrency remains the 3rd largest project with a total market cap value of $8.40 billion.
Key Support & Resistance Levels
XRP/USD
Support: $0.181, $0.17, $0.167.
Resistance: $0.19, $0.20, $0.212.
XRP/BTC:
Support: 2600 SAT, 2530 SAT, 2455 SAT.
Resistance: 2750 SAT, 2900 SAT, 3000 SAT.
XRP/USD: Bounces From The $0.18 Support
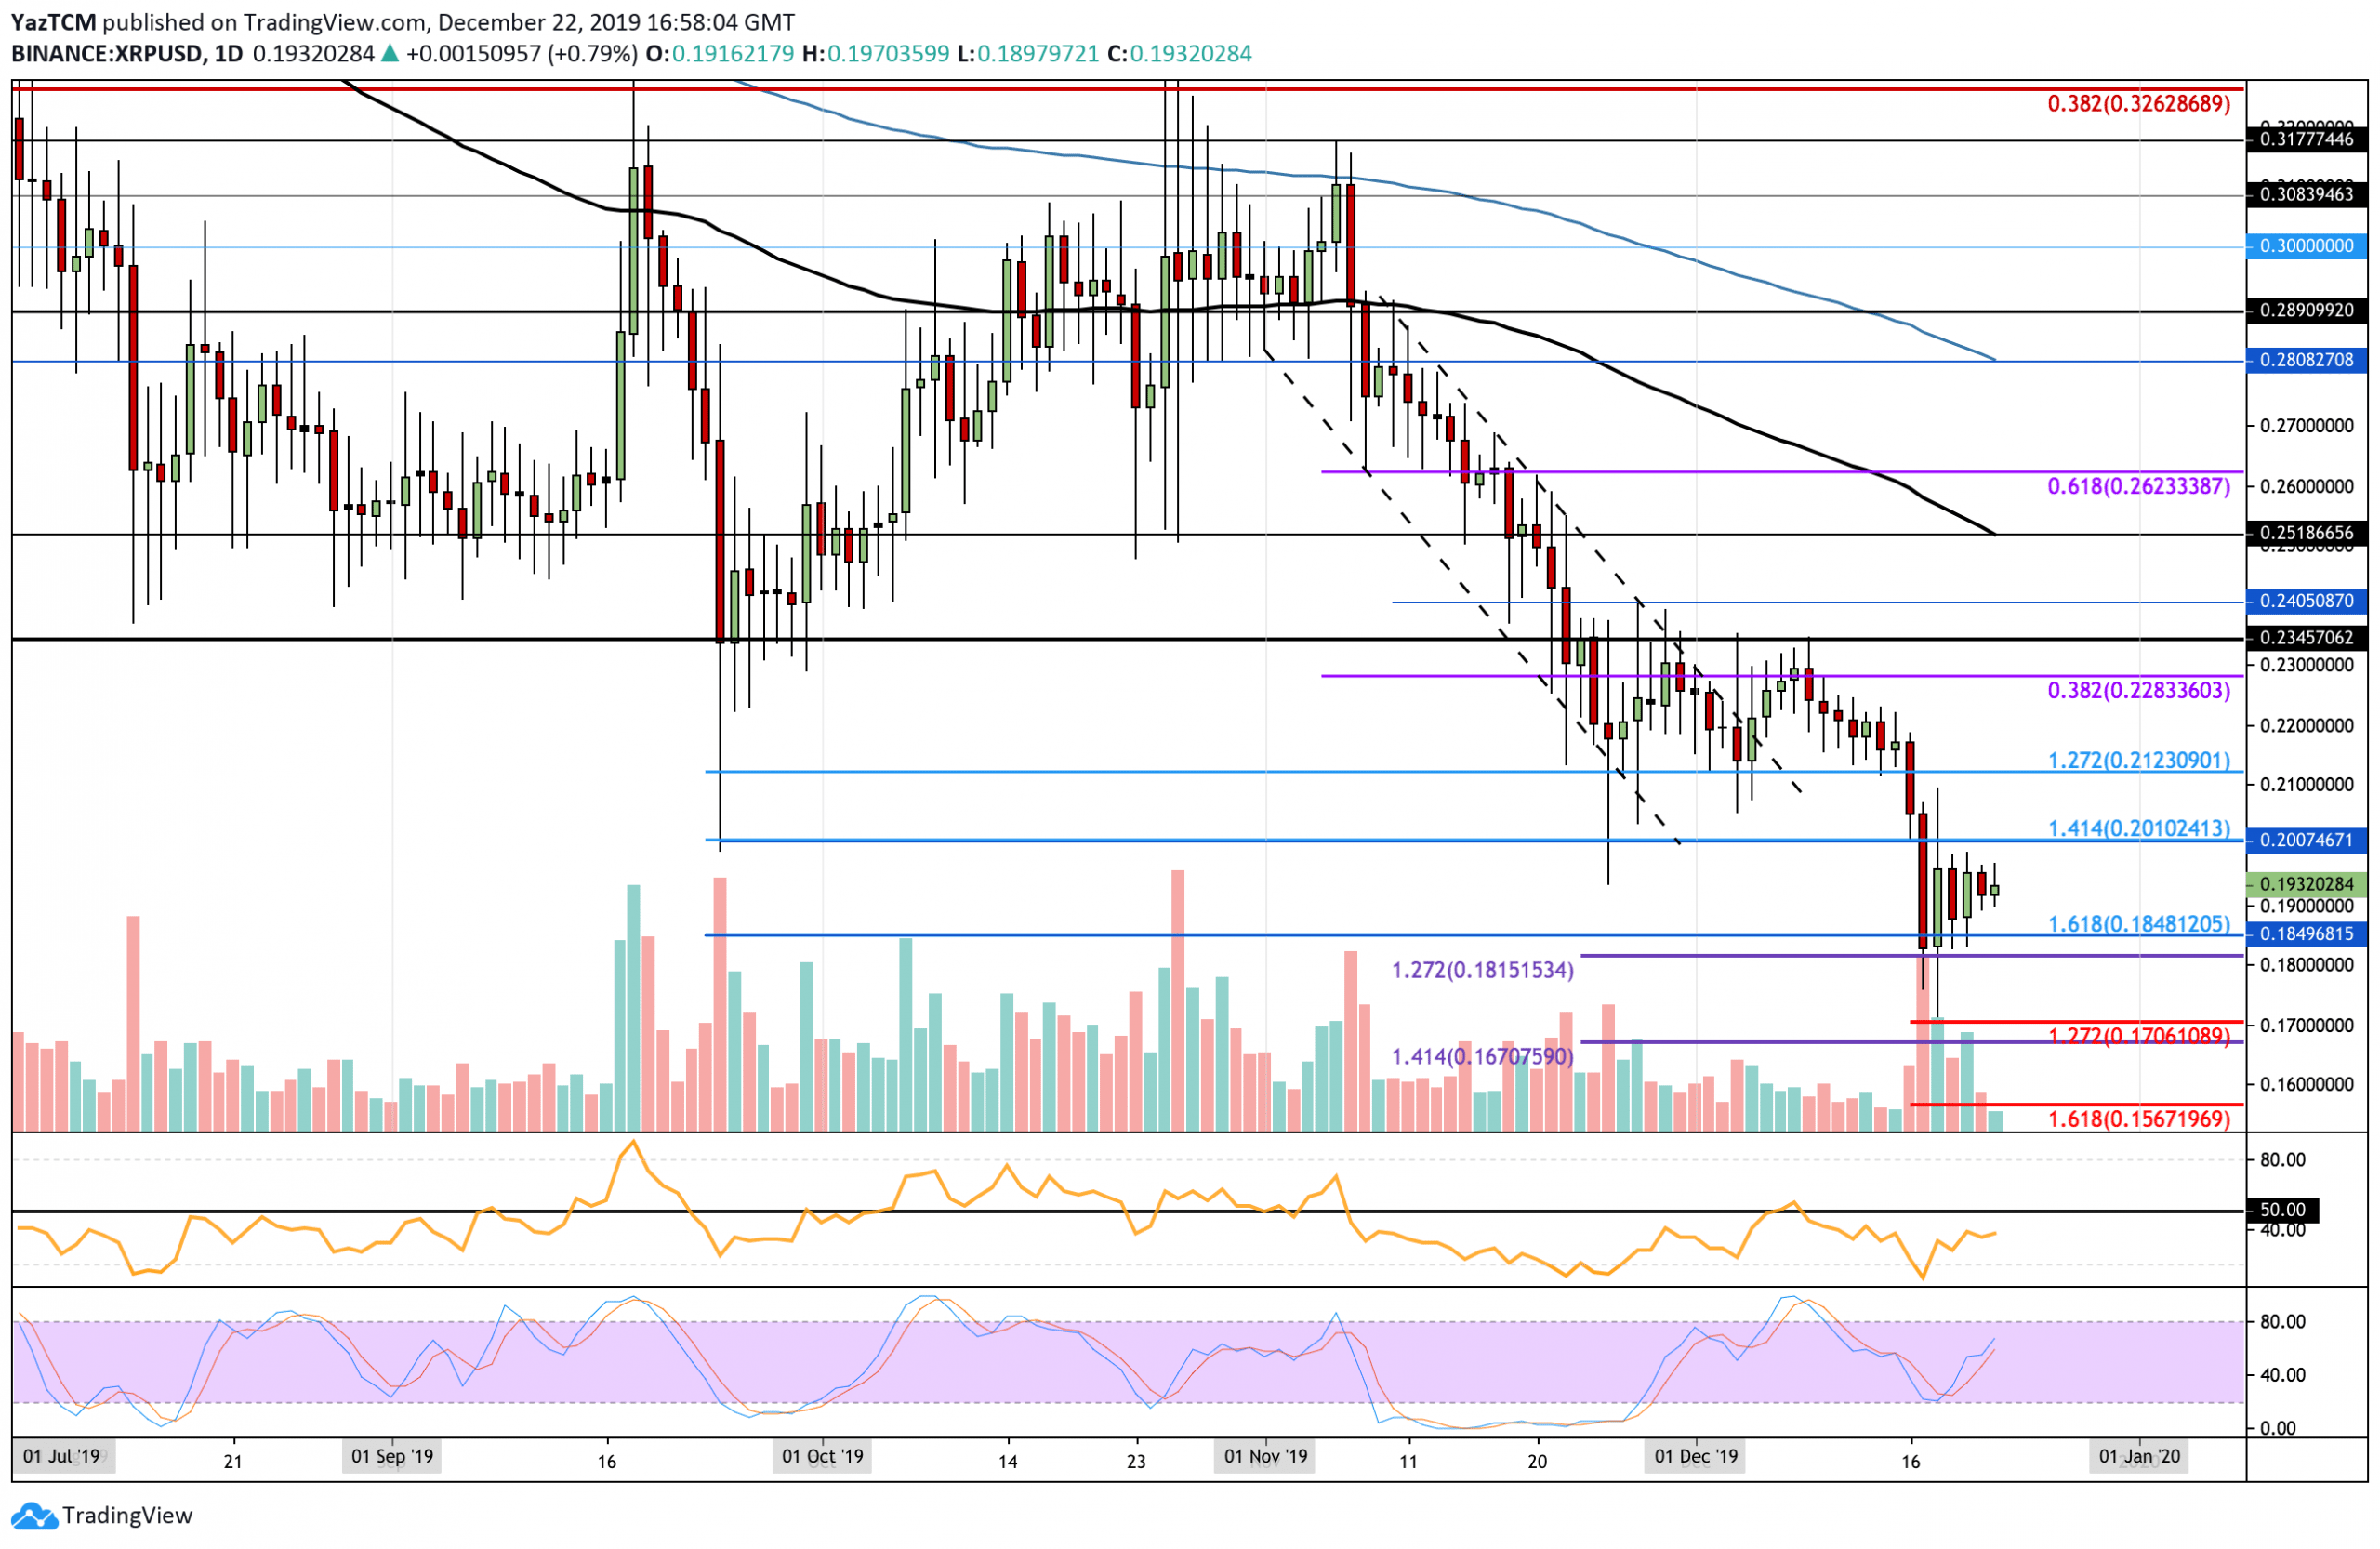
The daily chart shows XRP rebounding from the support at $0.181, allowing it to climb higher toward $0.20. However, it is struggling to break above $0.20, leading to the cryptocurrency to trade sideways during the last few days.
If XRP were to reverse and drop beneath the support at $0.181, it would turn strongly bearish again. For the cryptocurrency to become bullish, it must break above $0.20 and continue to create a fresh high above the December high at $0.2345.
XRP Short Term Price Prediction
If the bulls start to push higher above $0.20, initial strong resistance is located at $0.2120. This is followed by resistance at $0.2280 and $0.2345 (December high). Above the December highs, additional resistance is expected at $0.251, where lies the 100-days EMA. Alternatively, toward the downside, initial strong support is expected at $0.1815. Beneath this, support can be found at $0.17, $0.167, and $0.156.
The RSI has been rising, which shows that the previous selling momentum is fading. However, the RSI is failing to get anywhere near the 50 level, which shows that the sellers are still not ready to give up their control over the market momentum.
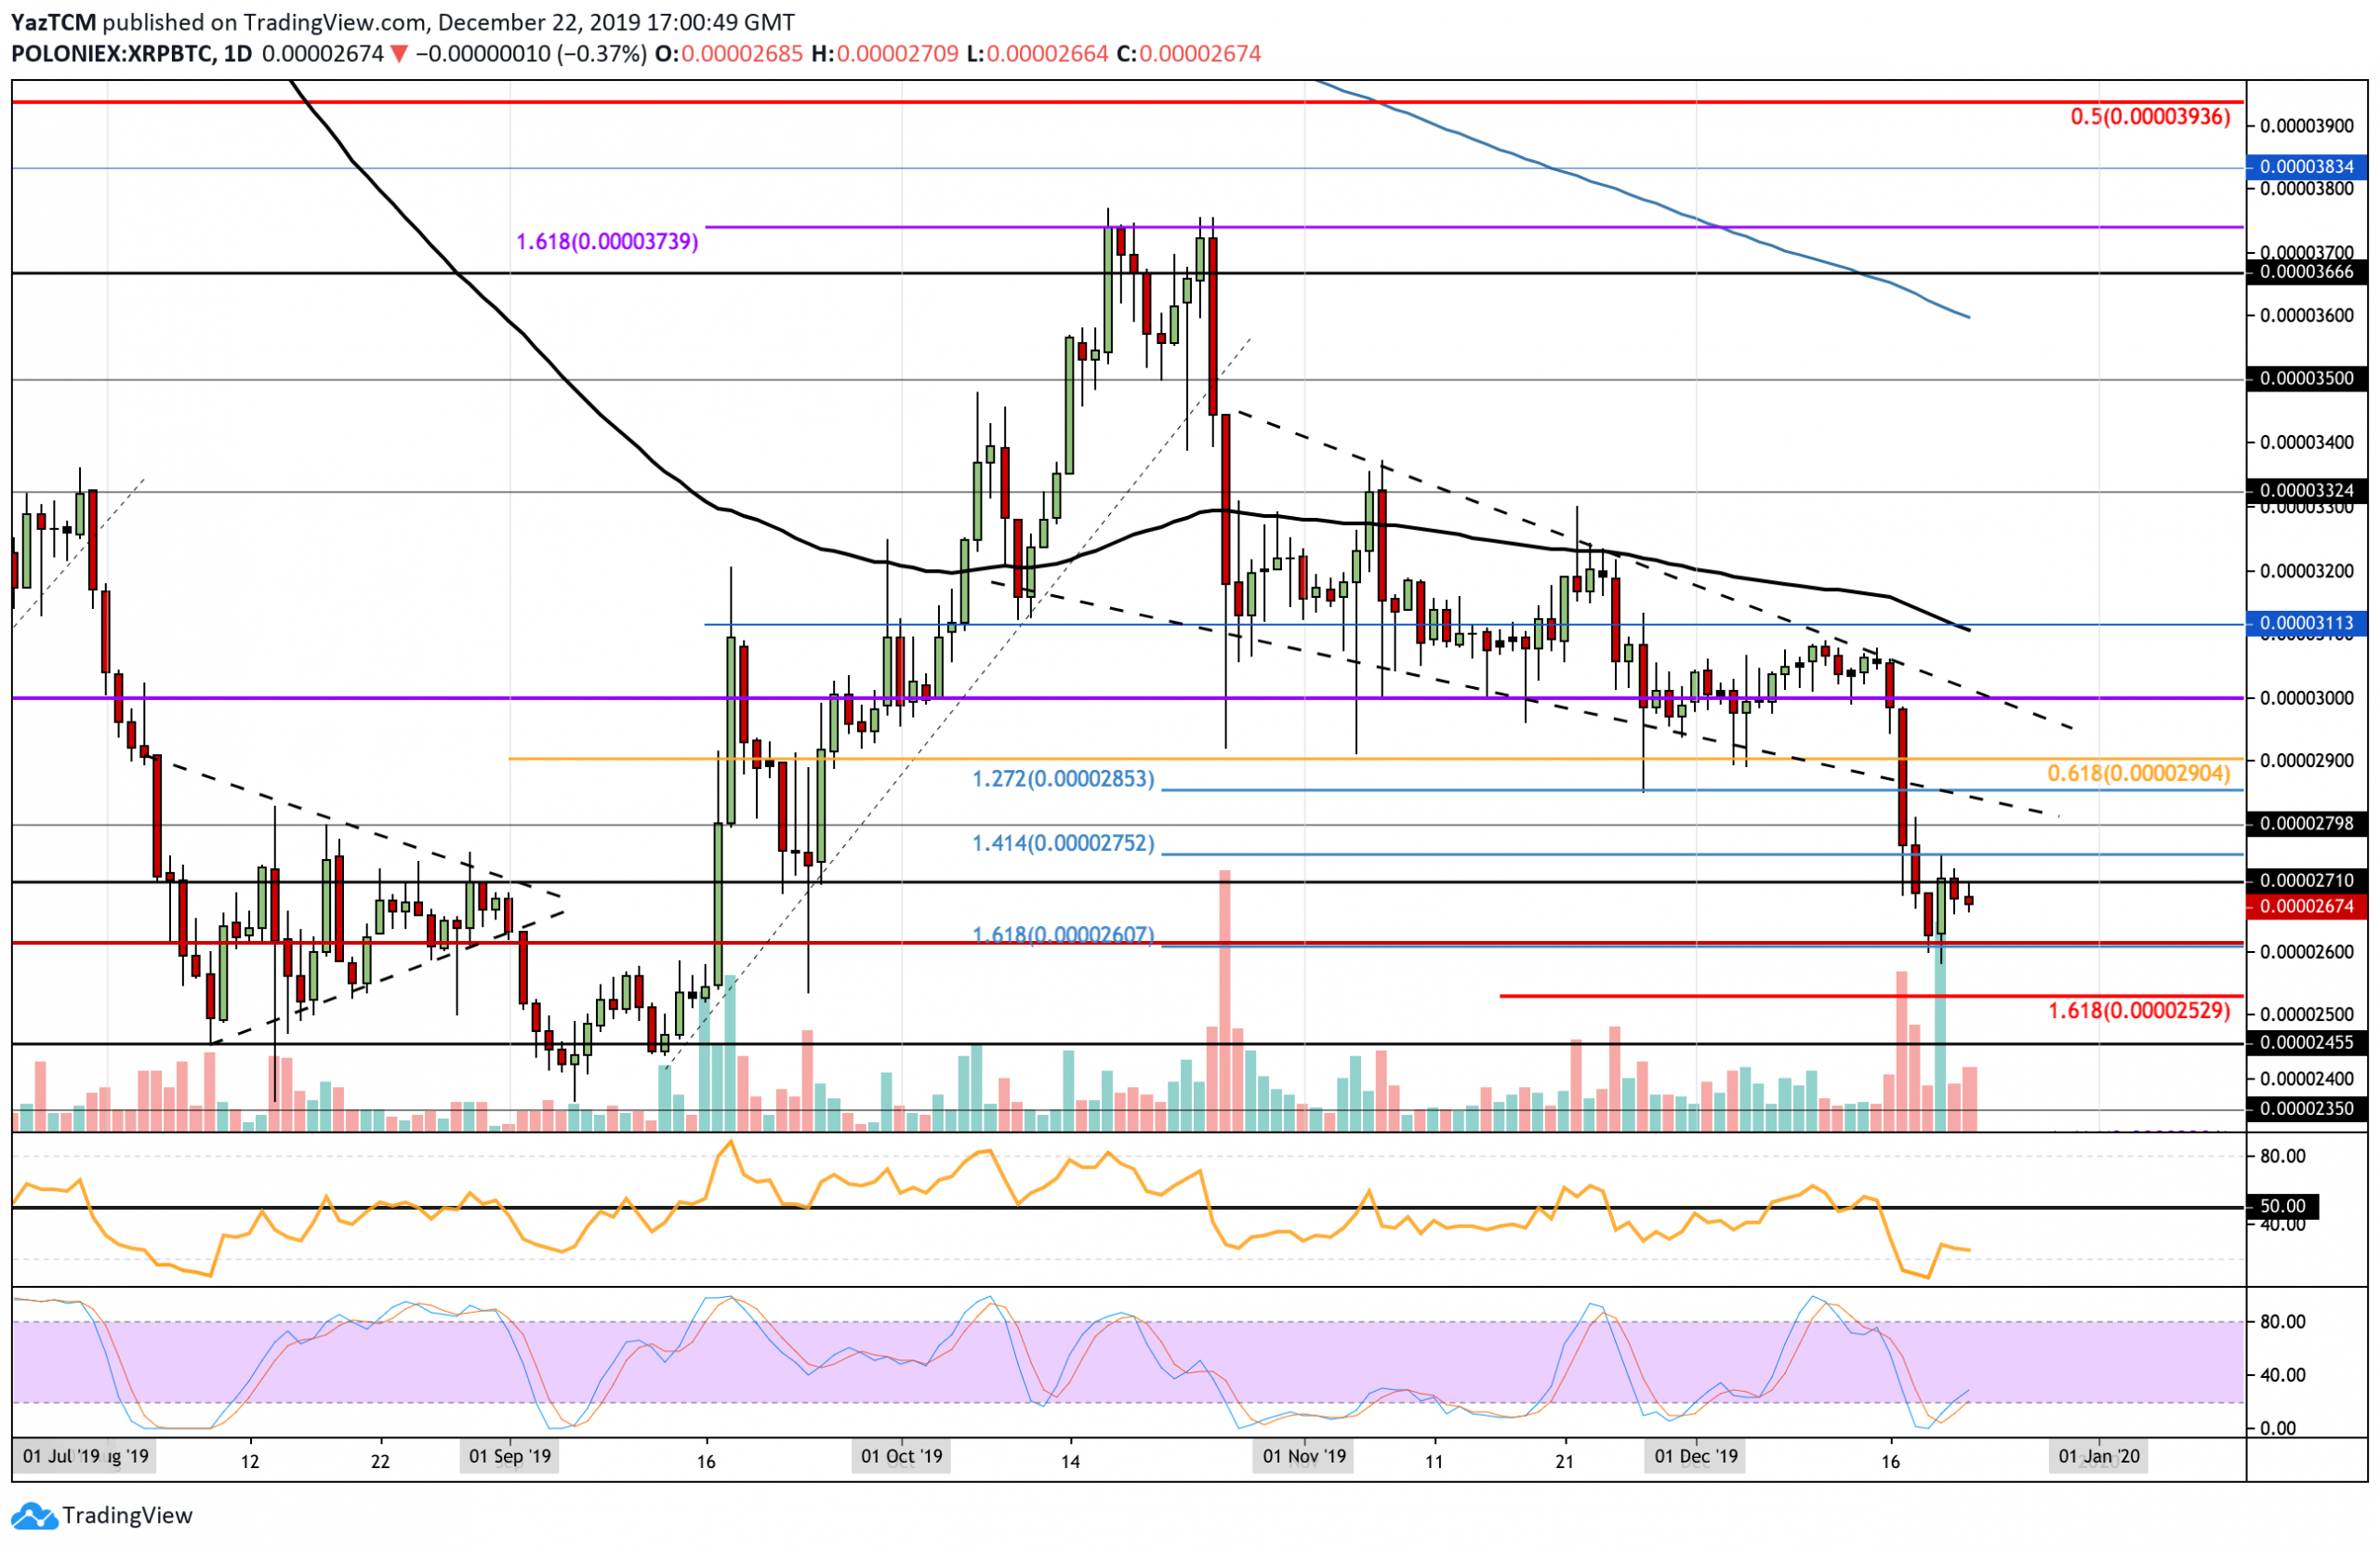
Against BTC, XRP continued to drop further beneath the 2700 support to reach lower support at 2600 SAT. It bounced from this support but was unable to break the resistance at 2750 SAT, causing it to roll-over to the current 2675 SAT level.
If XRP were to fall beneath the 2600 SAT level, the market would continue its bearish trajectory. Alternatively, if it were to rise and climb back above 3110 SAT (100-days EMA), the market would turn bullish.
XRP Short Term Price Prediction
If the bears continue to dominate the market and push it lower, initial strong support is located at 2600 SAT. Beneath this, additional support can be located at 2530 SAT (downside 1.618 Fib Extension), 2455 SAT, and 2400 SAT. On the other hand, if the buyers can push past the resistance at 2752 SAT, higher resistance is located at 2800 SAT, 2900 SAT, and 3000 SAT.
The Stochastic RSI recently produced a bullish crossover signal that allowed the coin to rebound from 2600 SAT. However, the RSI is still within the bearish favor. For a bullish recovery, the RSI must rise higher above the 50 level to show that the bulls are in control over the market momentum.


