Bitcoin price fell sharply on Saturday after failing to break beyond ,000. | Source: ShutterstockThe bitcoin price abruptly dropped by more than five percent ,949 to ,204 in the past 24 hours at a point which technical analysts described as a critical moment for bitcoin.The bitcoin price has dropped by more than 0 overnight against the USD (source: coinmarketcap.com)As the bitcoin price initially made its way to ,900, traders anticipated the dominant cryptocurrency to break out of a crucial resistance level and potentially retest ,400 with the possibility of it rising to ,000 in the short term.However, similar to how bitcoin reacted when it tested ,900, the asset immediately broke down to the low ,000 region, unable to cleanly climb over a range that has been
Topics:
Joseph Young considers the following as important: Bitcoin Price News, Cryptocurrency News, News
This could be interesting, too:
Bilal Hassan writes Coinbase Expands in Nigeria with Onboard Global Partnership
Guest User writes XRP Price Faces Potential Drop: Leading KOL Warns of Imminent Correction with TD Sequential Sell Signal!
Bilal Hassan writes Bitget Expands in South Africa with Callpay Integration
Bilal Hassan writes Infini Loses Million in Suspected Developer Breach


The bitcoin price abruptly dropped by more than five percent $10,949 to $10,204 in the past 24 hours at a point which technical analysts described as a critical moment for bitcoin.
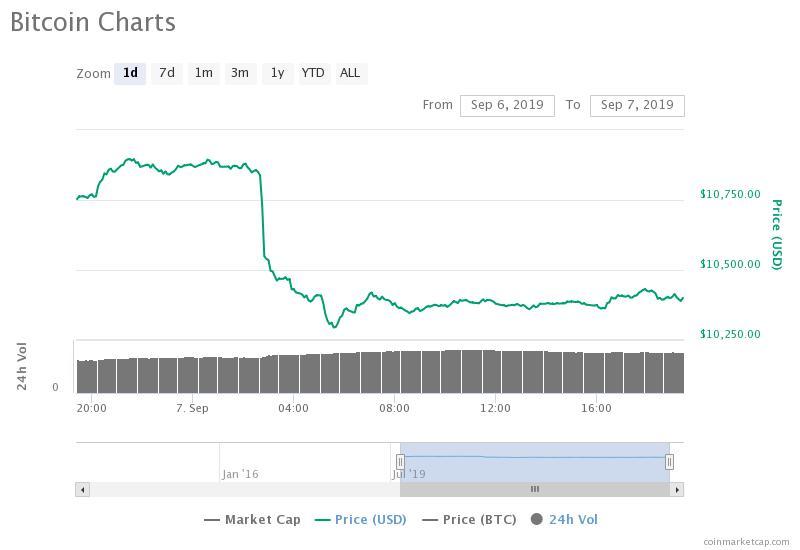
As the bitcoin price initially made its way to $10,900, traders anticipated the dominant cryptocurrency to break out of a crucial resistance level and potentially retest $11,400 with the possibility of it rising to $12,000 in the short term.
However, similar to how bitcoin reacted when it tested $10,900, the asset immediately broke down to the low $10,000 region, unable to cleanly climb over a range that has been regarded as heavy resistance since early August.
Where is bitcoin likely to test next?
Some traders have started to indicate the likelihood of bitcoin testing the $9,000 region before it rebounds as it did in the last week of August.
Josh Rager, a cryptocurrency trader, said that as BTC fell, $10,900 turned into a resistance level and it could demonstrate a short term downside movement to the $9,000 region. But, Rager said that he intends to enter if it goes below $9,000, suggesting that if BTC drops to lower support levels, it is likely to recover swiftly.
"BTC Looks like price has flipped support to resistance on the 4 hours. Will continue to watch how this plays out - but I'm not worried and will certainly be a buyer if Bitcoin trends back down towards $9k," he said.
Cred, a cryptocurrency technical analyst, said earlier this week prior to the test of BTC at $10,900 that charts suggest the upward movement could be a trap. As soon as bitcoin hit $10,900, which Cred described as immediate resistance, it fell by six percent within an hour.
He stated:
"$10k level that was broken support failed to provide resistance when retested. This is usually evidence of a trap (bearish continuation sellers on the S/R flip caught offside). HTF directional bias favours upside, clearing $10,460s (intraday range high) would cement that."
With the launch of Bakkt on September 23 and the emergence of regulated trading venues like VanEck's "limited bitcoin ETF," traders expect bulls to fight off sell pressure as BTC moves to test lower support levels.
Click here for a real-time bitcoin price chart.