The popular cryptocurrency data analytics and trade execution service skew outlined an exciting comparison between current realized volatility levels and those before the crash to ,200 back in November 2018.Bitcoin’s 10-Day Realized volatility at 20%According to information from skew, Bitcoin’s 10-day realized volatility is currently sitting at 20% – a figure that’s historically very low.The company makes an analogy and relates the metric to Bitcoin’s price:Bitcoin ten days realized volatility = 20%.Last time we reached that level, we had the great sell-off of November 2018 shortly after.Realized BTC Volatility Levels. Source: SkewIndeed, November 2018 marked an important period for Bitcoin’s price. It was during November that the price started plunging from ,500 to reach a low of
Topics:
George Georgiev considers the following as important: AA News, Bitcoin (BTC) Price, btcusd, btcusdt
This could be interesting, too:
Chayanika Deka writes SEC Closes Investigation Into Gemini, Winklevoss Seeks Reimbursement
Wayne Jones writes CZ Criticizes Safe Wallet’s Post-Mortem on Bybit Hack
Mandy Williams writes Bitcoin ETFs Record Over .6B in Outflows in the Past 2 Weeks
Wayne Jones writes This Trending AI Token Hits New ATH After Binance Listing
The popular cryptocurrency data analytics and trade execution service skew outlined an exciting comparison between current realized volatility levels and those before the crash to $3,200 back in November 2018.
Bitcoin’s 10-Day Realized volatility at 20%
According to information from skew, Bitcoin’s 10-day realized volatility is currently sitting at 20% – a figure that’s historically very low.
The company makes an analogy and relates the metric to Bitcoin’s price:
Bitcoin ten days realized volatility = 20%.
Last time we reached that level, we had the great sell-off of November 2018 shortly after.
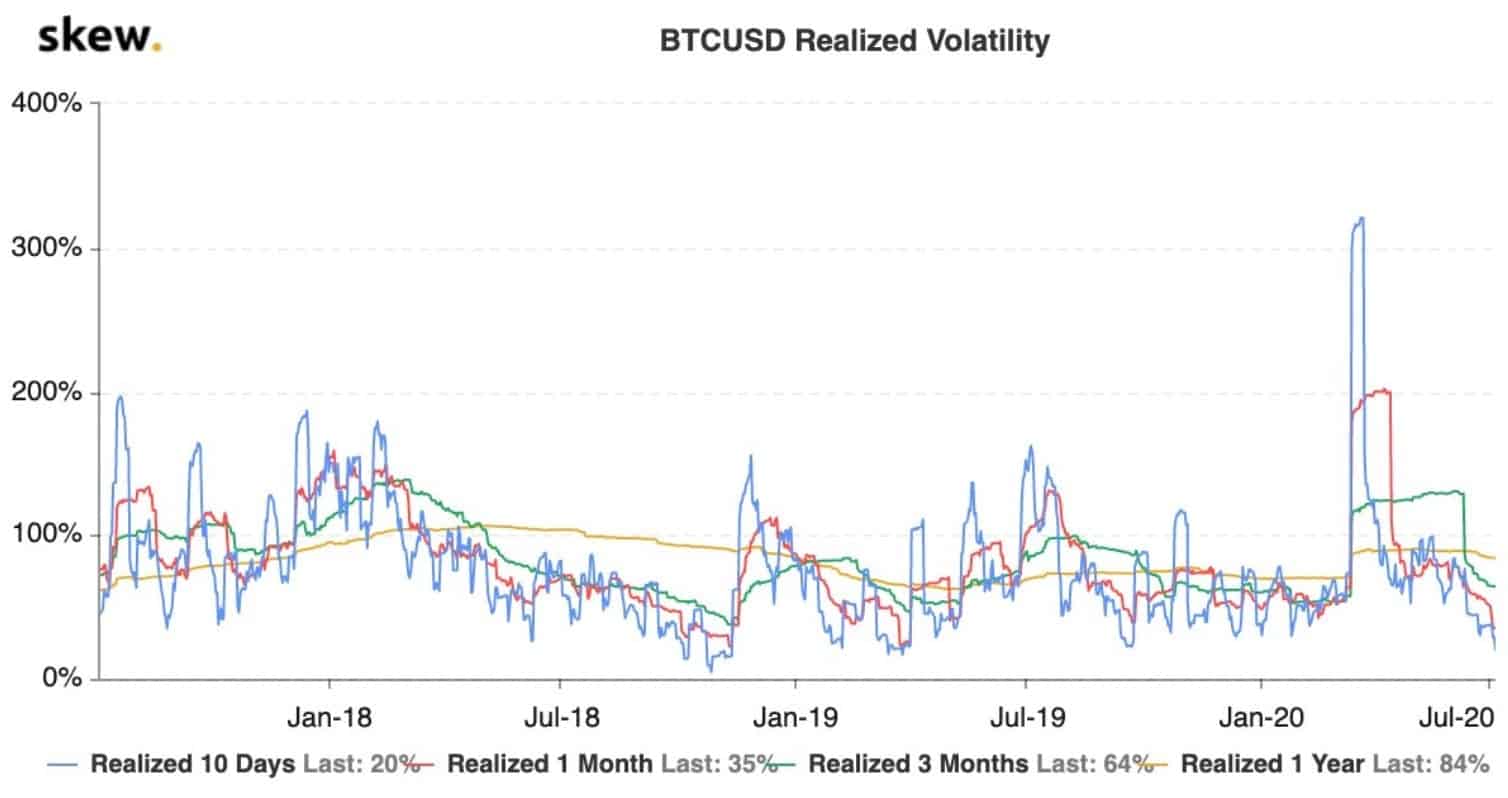
Indeed, November 2018 marked an important period for Bitcoin’s price. It was during November that the price started plunging from $6,500 to reach a low of around $3,200 at the beginning of December – the cryptocurrency’s lowest price since 2017.
Volatility and Bitcoin’s Price
Realized volatility is a term that’s also commonly referred to as historic volatility, and it describes volatility levels in the past. Implied volatility, on the other hand, refers to the market’s assessment of future volatility.
The last few weeks were rather stagnant in terms of price developments. With a few exceptions, Bitcoin was mainly rangebound.
In fact, this has reflected on the overall trading volume on different spot exchanges. Even though the price is up 78% from March, spot volumes are down 28%. At the same time, Bitcoin’s realized cap hit a new high of $107 billion recently, reaffirming that long-term investors are confident in the market.
According to a reputed cryptocurrency trader and analyst, Josh Rager, Bitcoin’s chart displays visible charts of compression, which “is leading to some heavy volatility in the coming weeks.”
In other words, it’s very common for Bitcoin’s price to take a serious swing at either direction after prolonged periods of substantially reduced volatility.
It’s also worth noting that reduced volatility could be linked to increased HODLing as people don’t feel incentivized to sell their BTC.