A senior analyst at RoboForex shares his insights into the future scenarios for Bitcoin, Ethereum, Litecoin, XRP and Bitcoin Cash price movement.Dmitriy Gurkovskiy, a senior analyst at foreign exchange broker RoboForex, provides his vision of the possible tendencies in price changes for Bitcoin as well as for other major cryptos.Cryptocurrencies are still correcting and volatility is reducing, so we may expect some good movements in the nearest future. As a rule, low volatility is often followed by a high one. At the moment, there are risks of seeing another decline in the entire cryptocurrency market. However, this decline won’t be a continuation of the descending tendency. In many charts, assets are forming rising patterns to confirm further growth, that’s why tests of the lows may only
Topics:
Dmitriy Gurkovskiy considers the following as important: bch, bchusd, Bitcoin Cash, Bitcoin News, BTC, btcusd, crypto analysis, crypto price, Cryptocurrency News, ETH, ethusd, Guest Posts, LTC, ltcusd, News, Reports, roboforex, XRP, xrpusd
This could be interesting, too:
Emily John writes Ripple Unveils Institutional Roadmap Driving XRP Ledger Growth
Chayanika Deka writes Bitcoin Whales Offload 6,813 BTC as Selling Pressure Mounts
Bilal Hassan writes Coinbase Expands in Nigeria with Onboard Global Partnership
Wayne Jones writes Bitcoin Sentiment Hits 2022 Lows as Fear & Greed Index Falls to 10
A senior analyst at RoboForex shares his insights into the future scenarios for Bitcoin, Ethereum, Litecoin, XRP and Bitcoin Cash price movement.
Dmitriy Gurkovskiy, a senior analyst at foreign exchange broker RoboForex, provides his vision of the possible tendencies in price changes for Bitcoin as well as for other major cryptos.
Cryptocurrencies are still correcting and volatility is reducing, so we may expect some good movements in the nearest future. As a rule, low volatility is often followed by a high one. At the moment, there are risks of seeing another decline in the entire cryptocurrency market. However, this decline won’t be a continuation of the descending tendency. In many charts, assets are forming rising patterns to confirm further growth, that’s why tests of the lows may only help to complete these patterns. For instance, in the chart of Litecoin, there is a bullish pattern that indicates a potential growth towards $90 but the price may yet fall to test $27 before starting the above-mentioned growth. On the other hand, shorter timeframes of almost all digital assets hint at a short-term downtrend.
Bitcoin
Bitcoin is still trading below the resistance level. At the moment, there are chances to see a further decline to test the support at $4,195. After the test, the price is highly likely to form a Double Bottom reversal pattern, which may indicate a rebound and the start of a new growth with the predicted target at $10,405. Another confirmation of the above-mentioned growth is the formation of a Head & Shoulders pattern on the RSI. However, the pattern lacks the right Shoulder right now, so the current decline will complete the pattern. Still, this bullish scenario may no longer be valid if the asset plummets and fixes below $4,195. In this case, the downtrend line will be broken, thus making the instrument plunge much deeper.
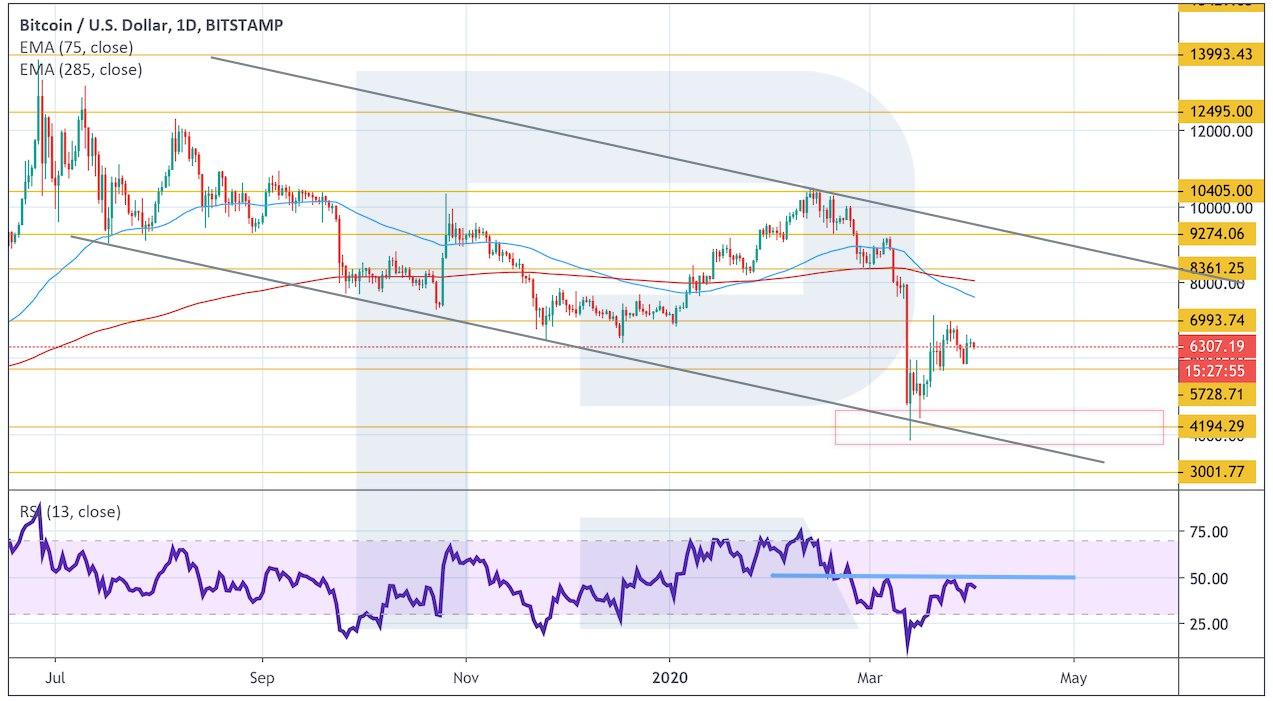
Photo: Roboforex / TradingView
In the H4 сhart, the price is rebounding from the area between Moving Averages, thus indicating that the downtrend is still quite strong. There is a potential of formation of a Head & Shoulders reversal pattern. In this case, the pair is expected to start falling from the current levels with the predicted target at $4,195. To confirm this scenario, the asset must break the support level and fix below $5,725, thus indicating a breakout of the reversal pattern’s Neckline. However, this scenario may be canceled if the instrument skyrockets and breaks $7,280. In this case, the pair won’t complete the reversal pattern and may continue growing towards $8,365 instead.
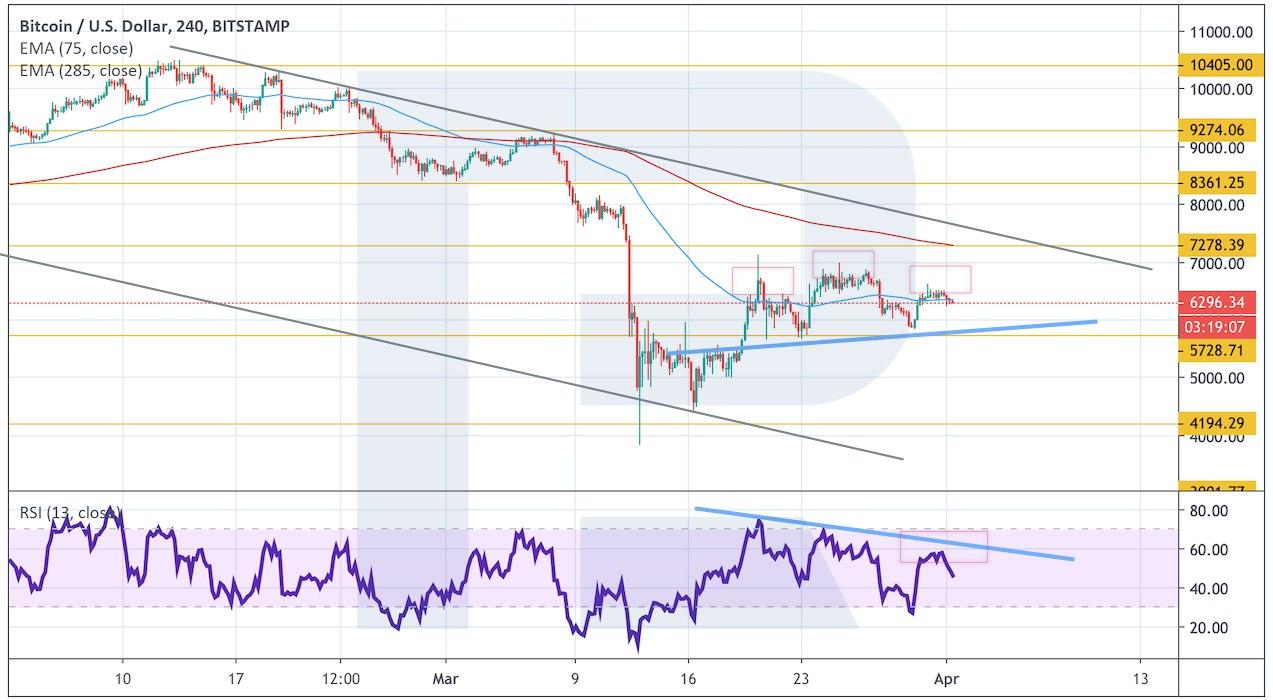
Photo: Roboforex / TradingView
Ethereum
In the daily chart, bulls haven’t been able to fix above the resistance level. The key trading idea implies the formation of a “Wolfe Wave” rising pattern. In this case, the pair is expected to fall towards $85 and then quickly rebound from this area to start a new growth with the target at $180 to finish the pattern. An excellent signal in favor of this scenario is another test of the support level at the RSI. However, this scenario may no longer be valid if the instrument falls and breaks $55. In this case, the asset may continue plunging.
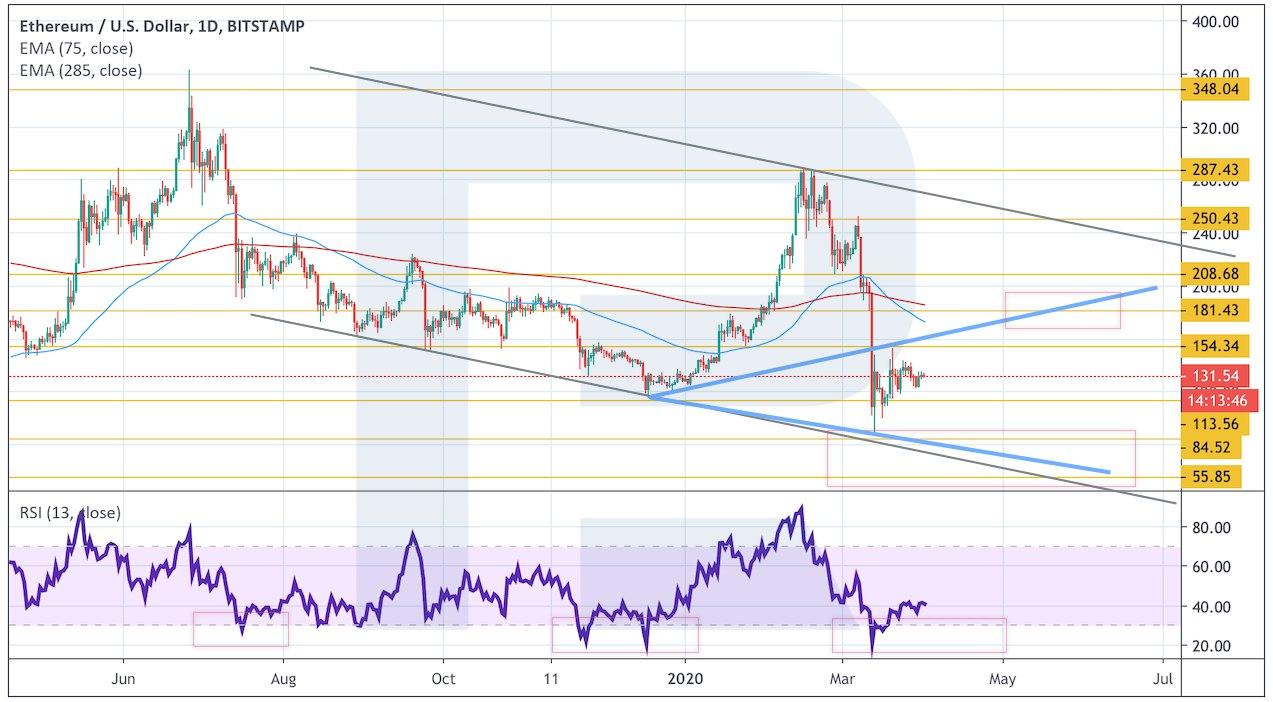
Photo: Roboforex / TradingView
As we can see on shorter timeframes, Ethereum is stuck inside a Triangle pattern. The price is rebounding for a quick Moving Average, which indicates a bearish pressure. There are risks of seeing further decline with the target at $85. To confirm this trading idea, the pair must break the pattern’s downside border and fix below $113.55. Another signal in favor of this scenario will be a rebound from the resistance line on the RSI. However, the negative scenario may be canceled if the instrument skyrockets and breaks $155. In this case, the asset may continue growing.
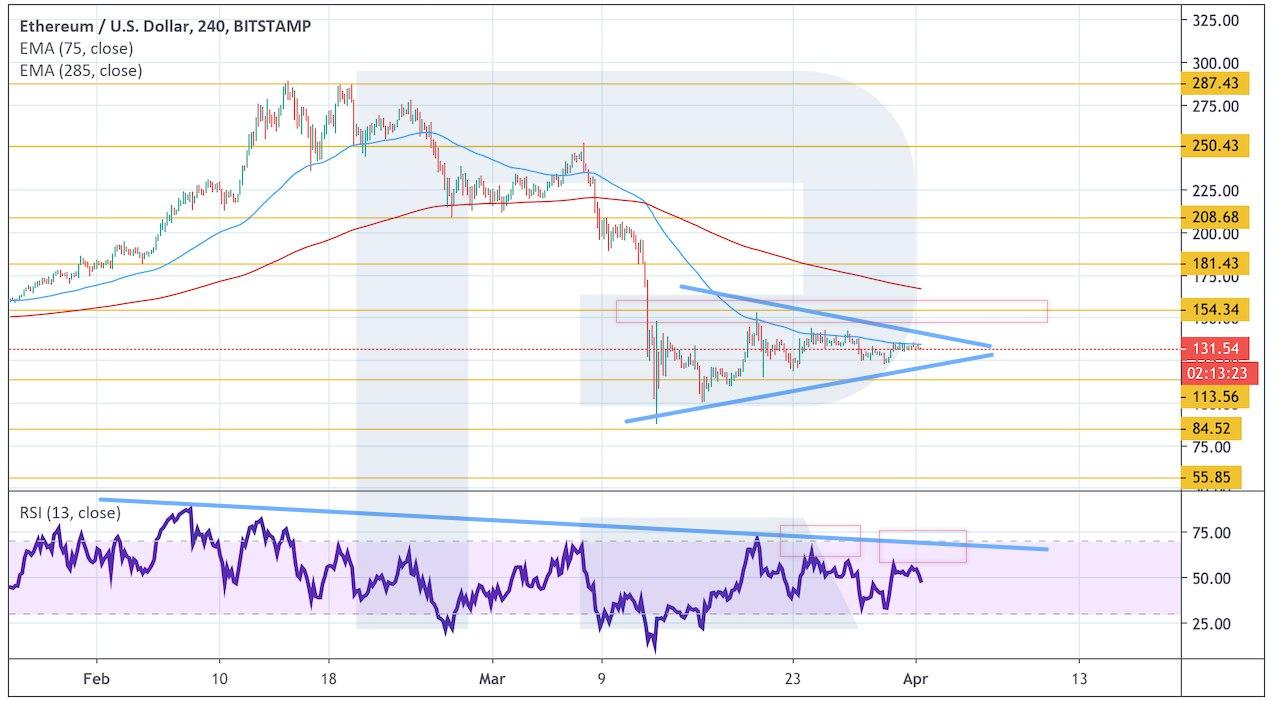
Photo: Roboforex / TradingView
Litecoin
LTCUSD continues the correction but the potential remains for the formation of a “Wolfe Wave” rising pattern. However, one shouldn’t exclude another attempt of the price to fall and test the pattern’s downside border at $30. If it happens, there might be a Head & Shoulder reversal pattern at the RSI, which will indicate a reversal and a new growth with the predicted target at $90. Still, this scenario may no longer be valid if the instrument breaks the pattern’s downside border and fixes below $20.
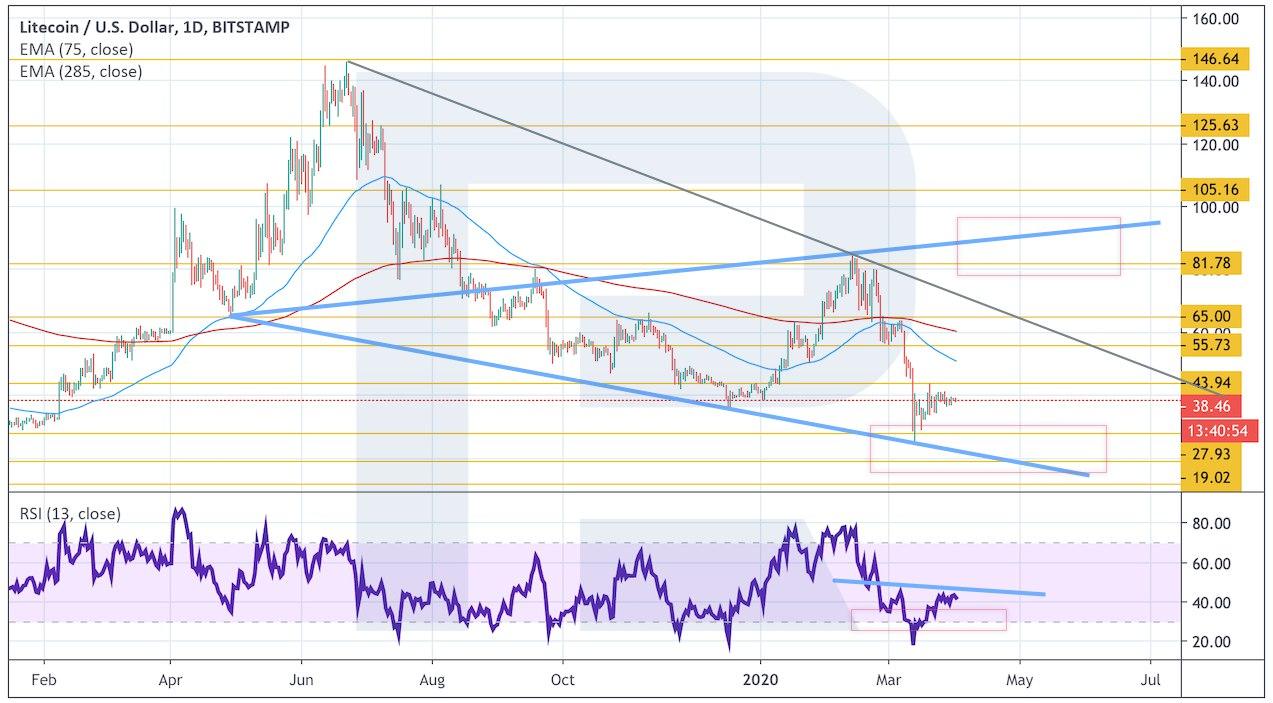
Photo: Roboforex / TradingView
As we can see in the H4 chart, the pair is also stuck inside a Triangle pattern. As a rule, the market may break such patterns both upwards and downwards. Under the current circumstance, the pair is more likely to rebound from a Moving Average and break the pattern’s downside border to continue falling and test $27. A strong signal in favor of this idea is a rebound from the resistance line at the RSI. To confirm further decline, the asset must break the support area and fix below $34. However, this scenario may be canceled if the instrument grows to break $44. In this case, the market may start a new growth with the first target at $55.
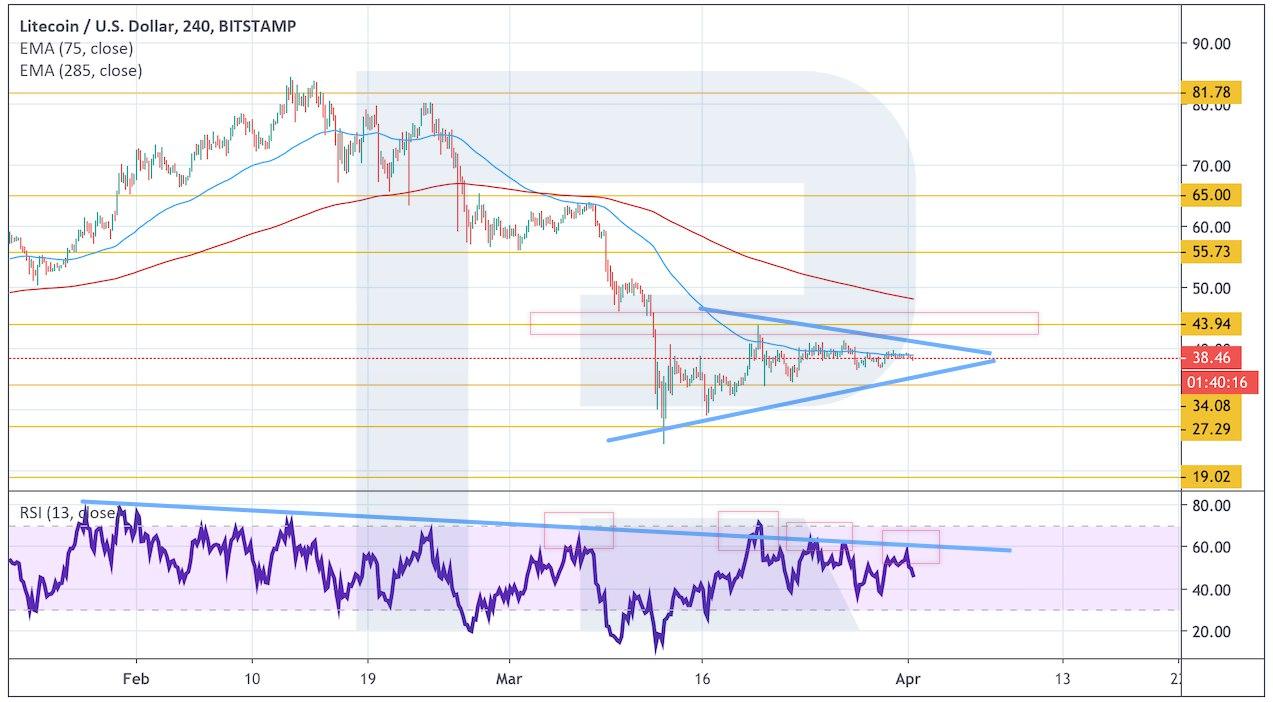
Photo: Roboforex / TradingView
XRP
As we can see in the daily chart, after rebounding from the downside border of an Expanding Formation pattern, XRP is testing the resistance level. At the moment, there are risks of seeing another decline and a test of $0.1430. Later, this decline may be followed by one more attempt to rebound and a new growth of XRPUSD with the potential target at $0.3770. An excellent signal in favor of this idea will be a rebound from the descending channel’s downside border at the RSI. However, this scenario may no longer be valid if the instrument falls and fixes below $0.0725.
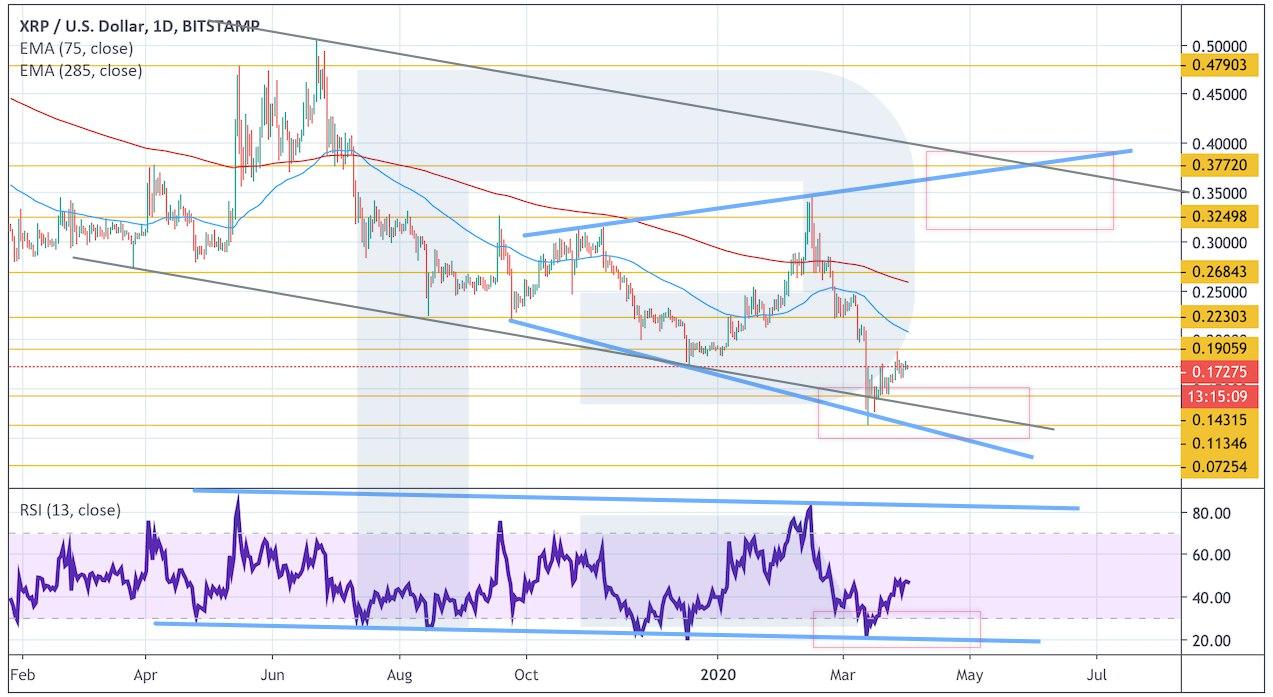
Photo: Roboforex / TradingView
Shorter timeframes also indicate the possibility of further decline. As we can see, the price is forming a Wedge reversal pattern, which hints at a potential decline down to $0.1135. A strong signal in favor of this idea is the formation of a Head & Shoulders reversal pattern at the RSI. To confirm the above-mentioned decline, the asset must break the downside border of the Wedge pattern and fix below $0.1430. However, this scenario may be canceled if the instrument skyrockets and breaks $0.1905. In this case, the pair may continue trading upwards with the first target at $0.2230.
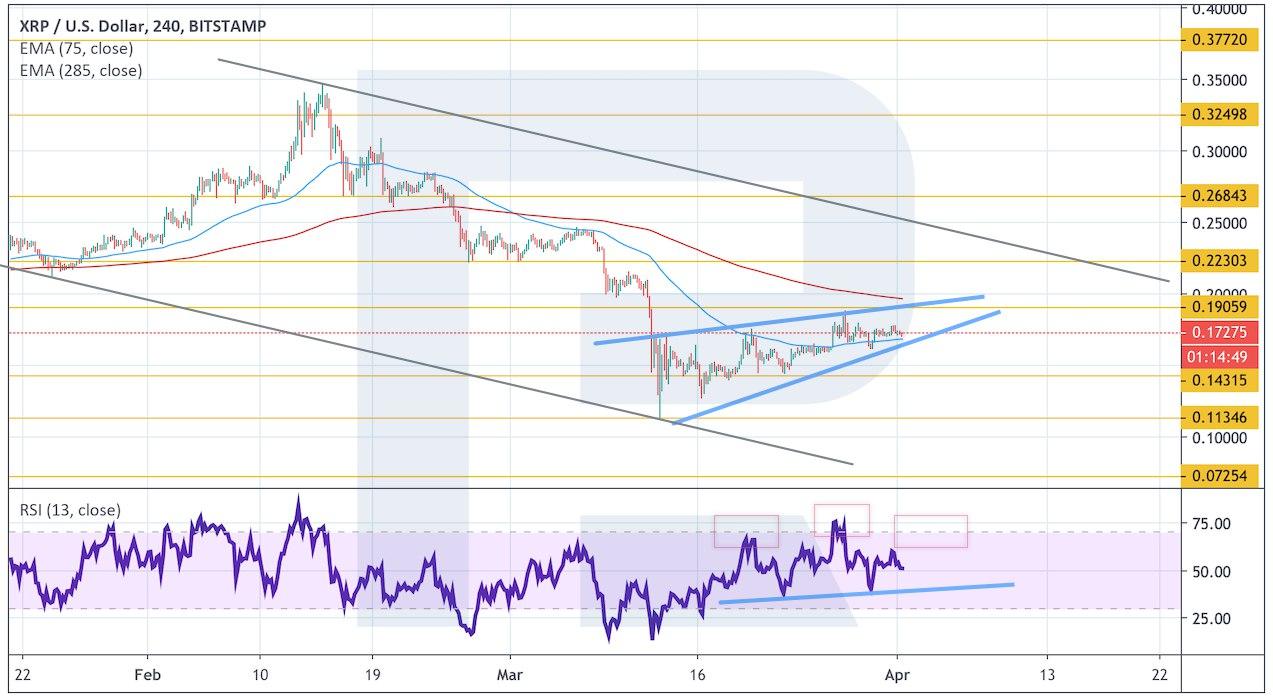
Photo: Roboforex / TradingView
Bitcoin Cash
In the daily chart, there is also a potential of formation of a Wolfe Wave bullish pattern, that’s why after a decline towards $136, the pair may rebound and start a strong ascending movement with the first target at $295. A strong signal to confirm this idea will be a completion of a reversal pattern at the RSI. However, this scenario may no longer be valid if the instrument breaks $100. In this case, the asset is expected to fall towards $70.
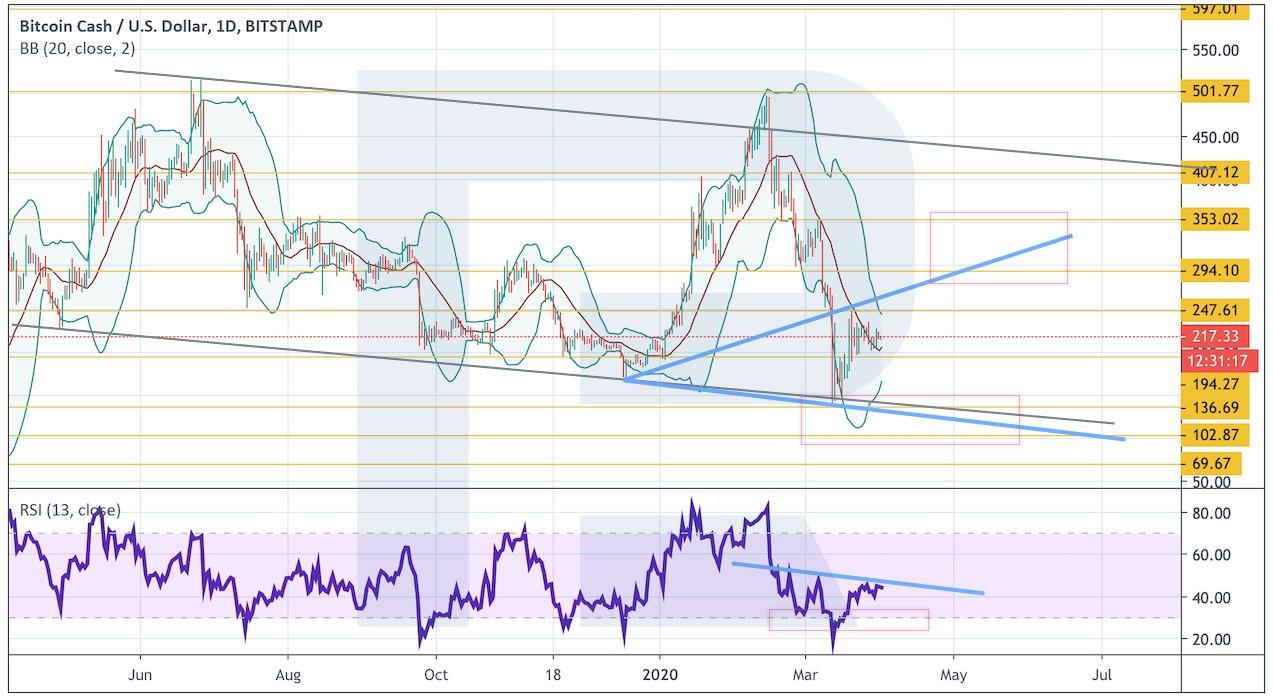
Photo: Roboforex / TradingView
On shorter timeframes, the price has rebounded from the resistance level; right now. it is still correcting inside a Triangle pattern. There are risks of seeing a breakout of the pattern’s downside border and further decline with the first target at $136. To confirm this idea, the pair must fix below $195. A strong signal in favor of this scenario is a rebound from the resistance line at the RSI. However, this scenario may be canceled if the instrument skyrockets to break the pattern’s upside border and fix above $250. In this case, the asset may continue growing to reach $355.
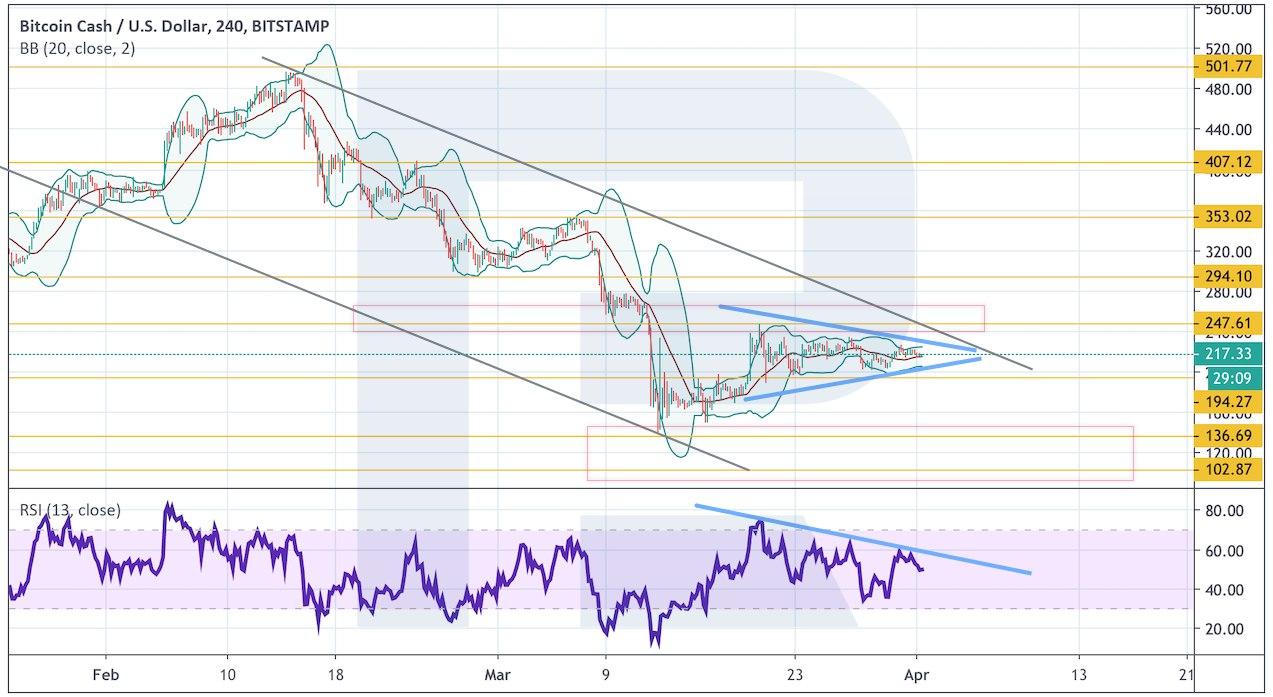
Photo: Roboforex / TradingView
Disclaimer: Any predictions contained herein are based on the authors' particular opinion. This analysis shall not be treated as trading advice. RoboForex shall not be held liable for the results of the trades arising from relying upon trading recommendations and reviews contained herein.

Dmitriy Gurkovskiy is a senior analyst at RoboForex, an award-winning European online foreign exchange forex broker.