Bitcoin was looking promising to take on the ,500 level yesterday after finally breaking above a critical down-trending resistance.Unfortunately, the breakout was nothing more than an orchestrated trading strategy used commonly by Bitcoin whales to shake out retail traders and likely accumulate more BTC.And it worked.The Bitcoin-Bashing Bart Simpson PatternWhenever there’s low liquidity, Whale traders need to create volume in order to place large sell orders and reduce slippage as much as possible. A common way to achieve this is to pump the price into an area of high liquidity, in this case, above the down-trending resistance that has held back BTC for the last 36 days.The idea is that once the price has entered this area, retail traders will begin to place buy orders thinking the asset
Topics:
Ollie Leech considers the following as important: Bitcoin (BTC) Price, BTC Analysis, btcusd, btcusdt
This could be interesting, too:
Mandy Williams writes Bitcoin ETFs Record Over .6B in Outflows in the Past 2 Weeks
Chayanika Deka writes Bitcoin Whales Offload 6,813 BTC as Selling Pressure Mounts
Wayne Jones writes Bitcoin Sentiment Hits 2022 Lows as Fear & Greed Index Falls to 10
Jordan Lyanchev writes Bitcoin Falls Below K for the First Time in 3 Months, How Much Lower Can It Go?
Bitcoin was looking promising to take on the $9,500 level yesterday after finally breaking above a critical down-trending resistance.
Unfortunately, the breakout was nothing more than an orchestrated trading strategy used commonly by Bitcoin whales to shake out retail traders and likely accumulate more BTC.
And it worked.
The Bitcoin-Bashing Bart Simpson Pattern
Whenever there’s low liquidity, Whale traders need to create volume in order to place large sell orders and reduce slippage as much as possible. A common way to achieve this is to pump the price into an area of high liquidity, in this case, above the down-trending resistance that has held back BTC for the last 36 days.
The idea is that once the price has entered this area, retail traders will begin to place buy orders thinking the asset is in the early stages of a bull run. It also decimates any short positions that were placed by traders who were anticipating another rejection at the key resistance.
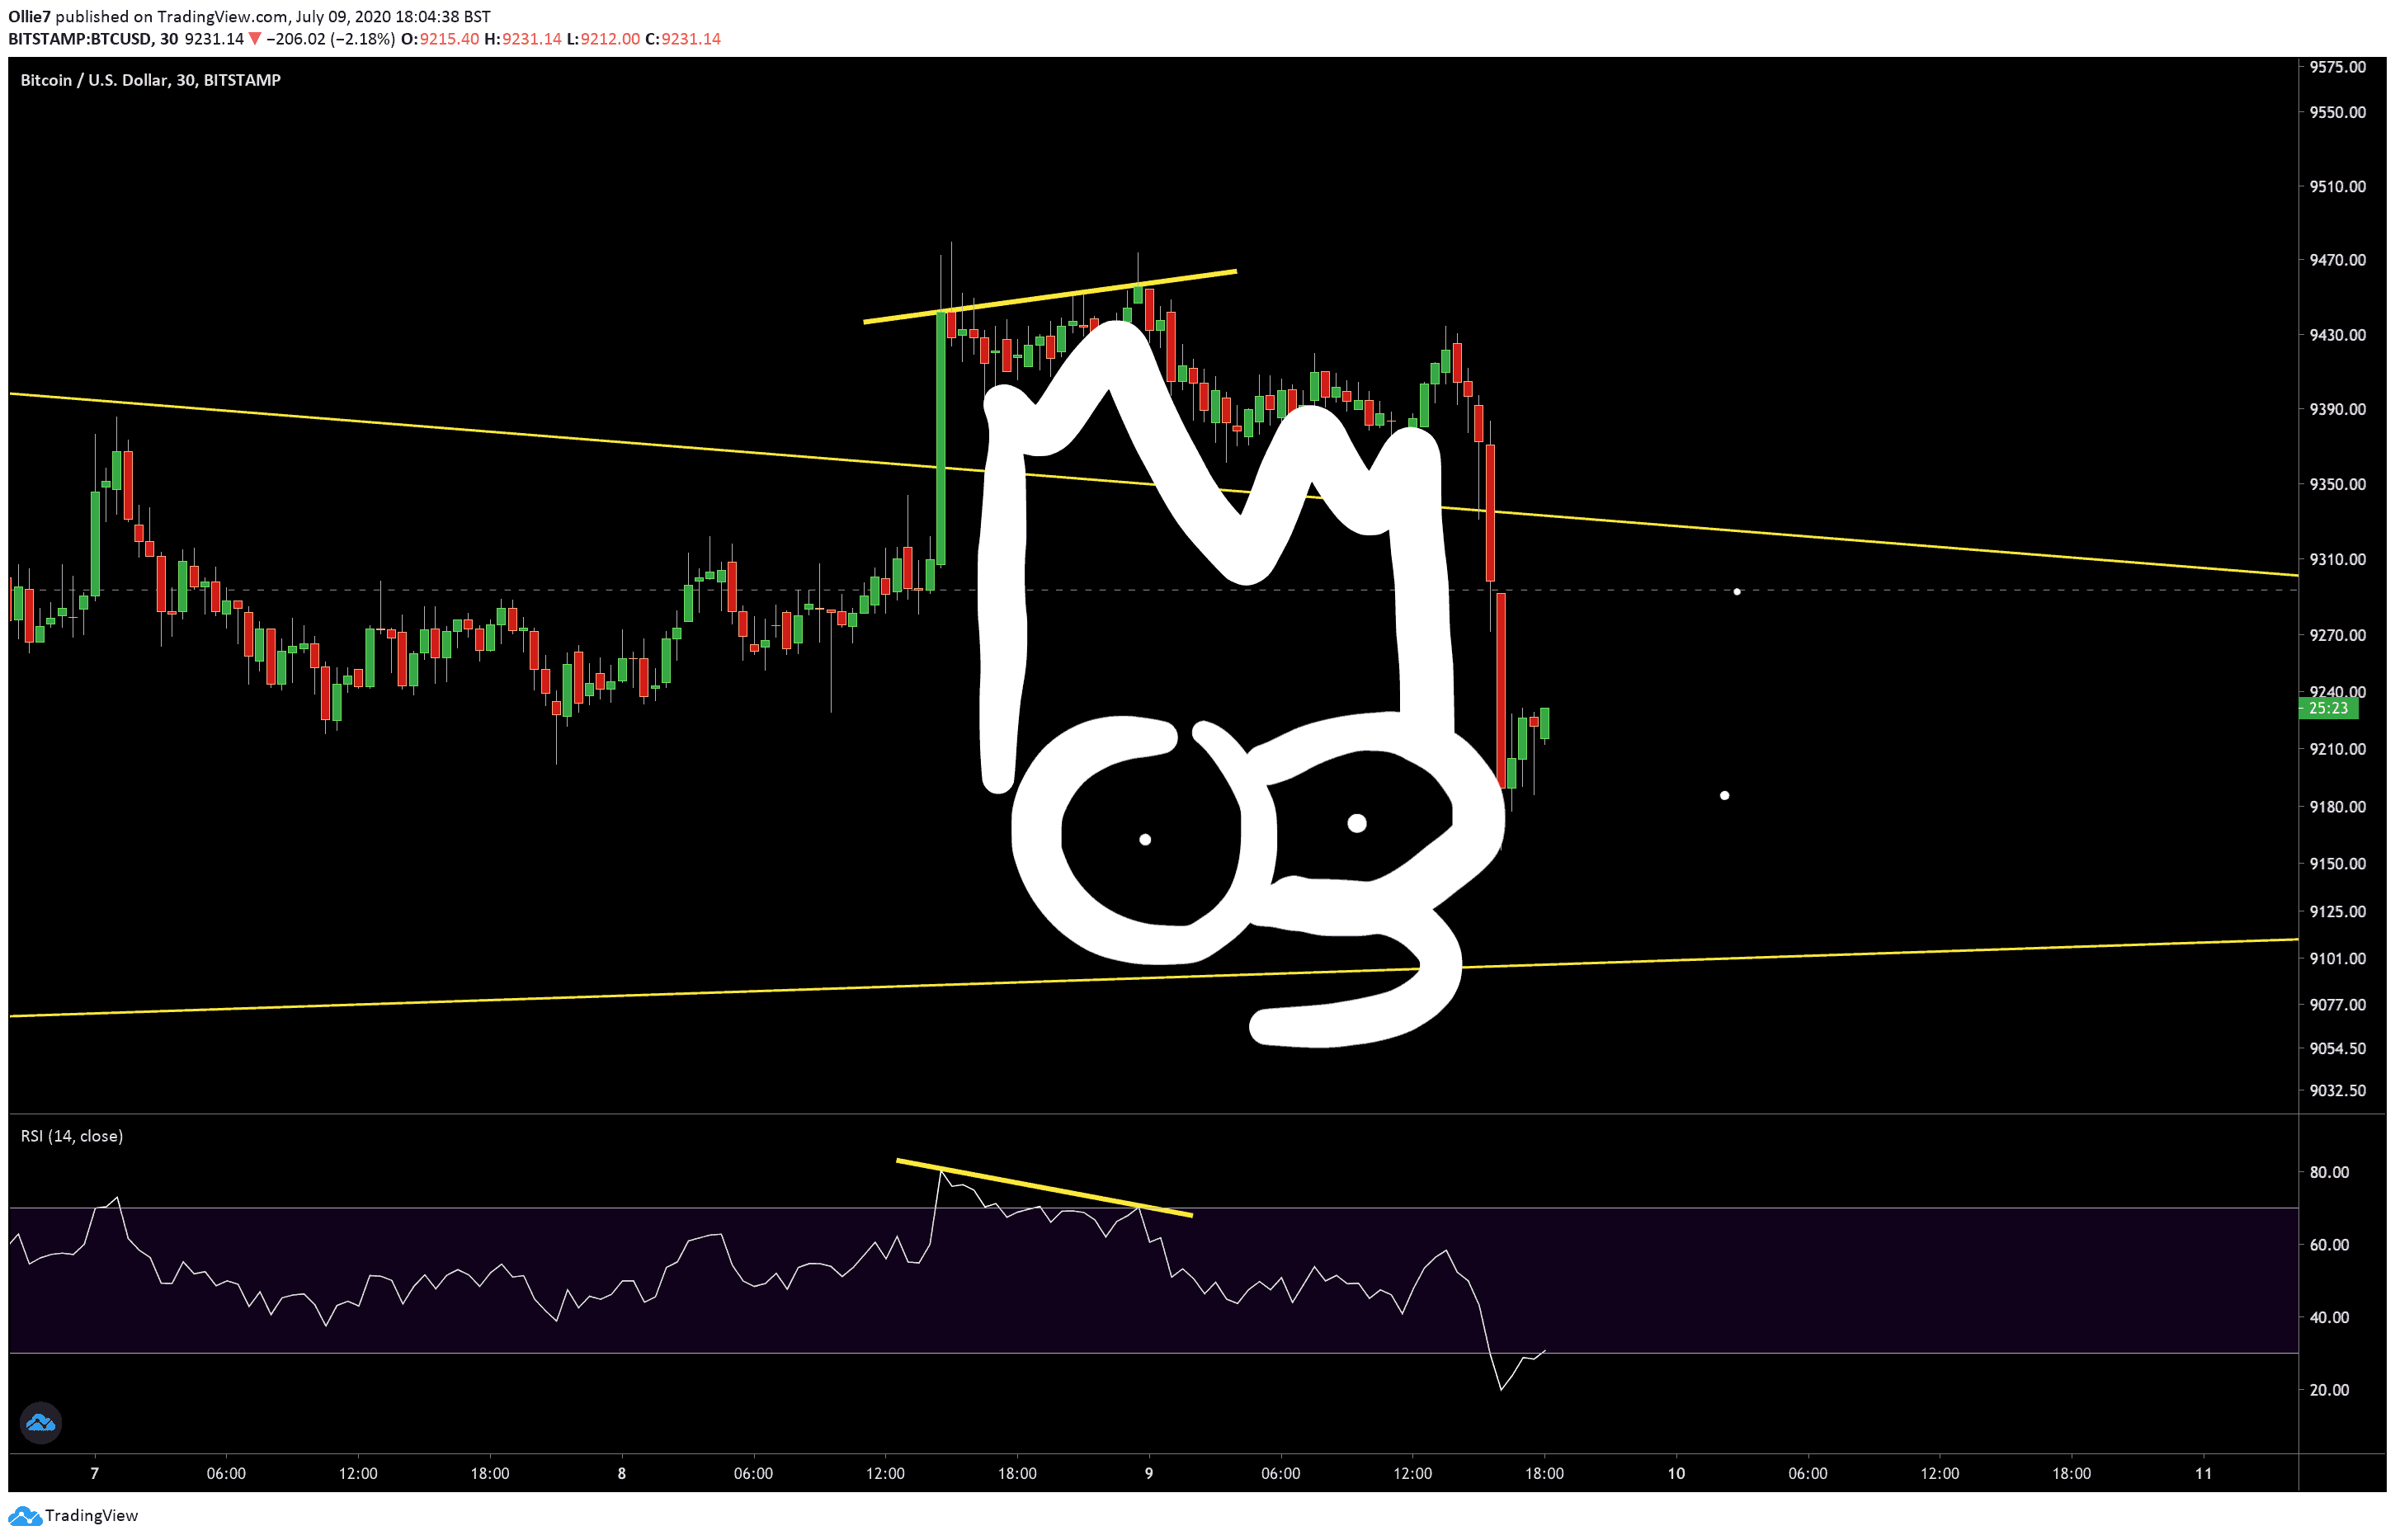
The price tends to break sideways for a while, simulating a period of consolidation, and then crashes violently to complete the pattern. Not only does this leave optimistic spot traders rekt, but it also squeezes any long positions too on the way down.
This strategy is affectionately known as the Bart Simpson pattern because of the shape it leaves in the price action (see the 30-minute chart below).
Bitcoin Price Levels to Watch in the Short-term
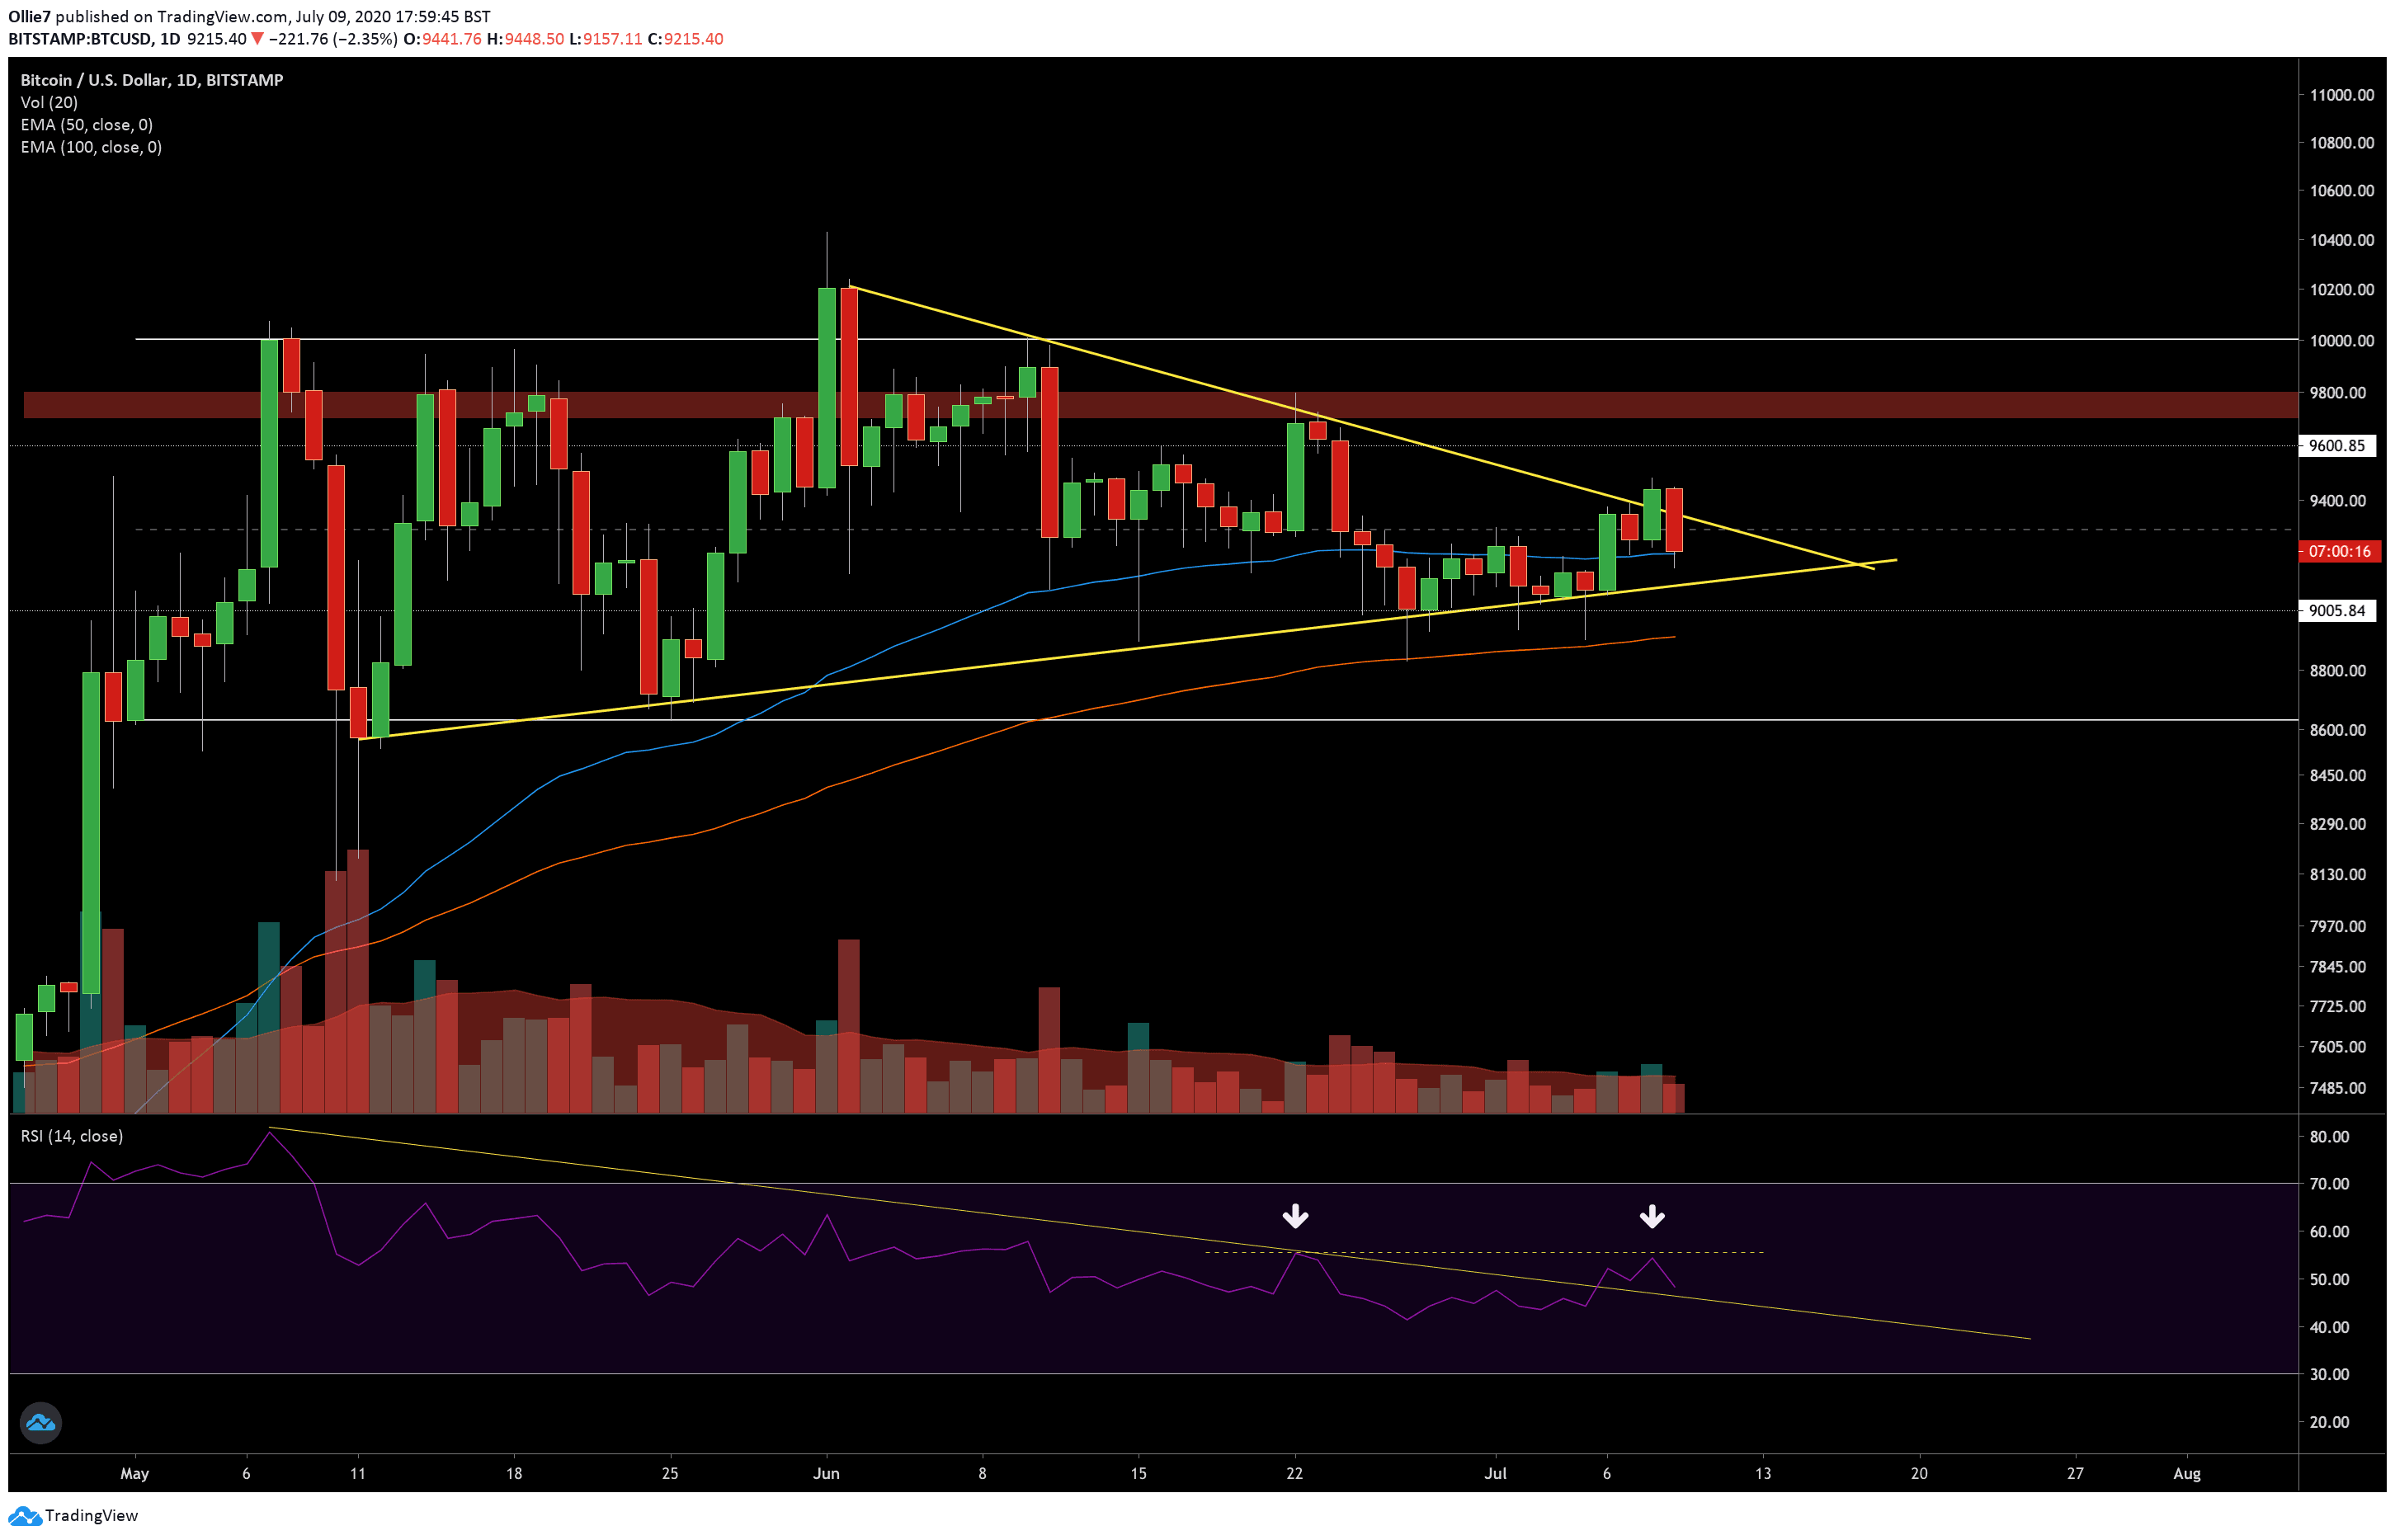
Following the completion of the latest Bart Simpson pattern, BTC prices are now resting on the 50-day Exponential Moving Average (EMA). On smaller time frames, we can see that the median line of the current range at $9,300 briefly propped up the asset during the sell-off, but failed to give bullish traders a strong enough foothold to push back early from.
If there’s further downside to come, then we’d expect the up-trending line (yellow) to provide some support in the short-term. If that’s broken, however, then we have the $9,000 level still and the 100EMA as additional backups against further decline.
If the price actually turns bullish during the rest of this week – and is not just being manipulated again – then the $9,400 to $9,500 area will be a likely target for bulls. Any hopes of bitcoin hitting the $9,800 area any time soon though are looking increasingly unlikely.
Total market capital: $274 billion
Bitcoin market capital: $169 billion
Bitcoin dominance index: 61.7%
BTC/USD Bitstamp Daily Chart
BTC/USD Bitstamp 30-Minute Chart