Bitcoin’s price has managed to climb 0 today and break bullish out of a 19-day consolidation pattern (white dashed lines). This is pretty surprising considering the recent Kucoin hack, BitMEX investigation from the CFTC, and the potential for a second wave of lockdowns worldwide. In just 6 hours, billion flooded back into the crypto markets, shortly after Jack Dorsey’s Square announced it had purchased 4.709 BTC (approx million). This catapulted the leading cryptocurrency through the strong resistance at ,800 that has been holding down the asset since the start of the month and all the way up to the 0.5 Fibonacci level at ,960, before correcting. BTC Price Levels to Watch in the Short-term Right now, bullish traders appear to be recharging around the
Topics:
Ollie Leech considers the following as important: Bitcoin (BTC) Price, BTC Analysis, BTCEUR, BTCGBP, btcusd, btcusdt
This could be interesting, too:
Mandy Williams writes Bitcoin ETFs Record Over .6B in Outflows in the Past 2 Weeks
Chayanika Deka writes Bitcoin Whales Offload 6,813 BTC as Selling Pressure Mounts
Wayne Jones writes Bitcoin Sentiment Hits 2022 Lows as Fear & Greed Index Falls to 10
Jordan Lyanchev writes Bitcoin Falls Below K for the First Time in 3 Months, How Much Lower Can It Go?
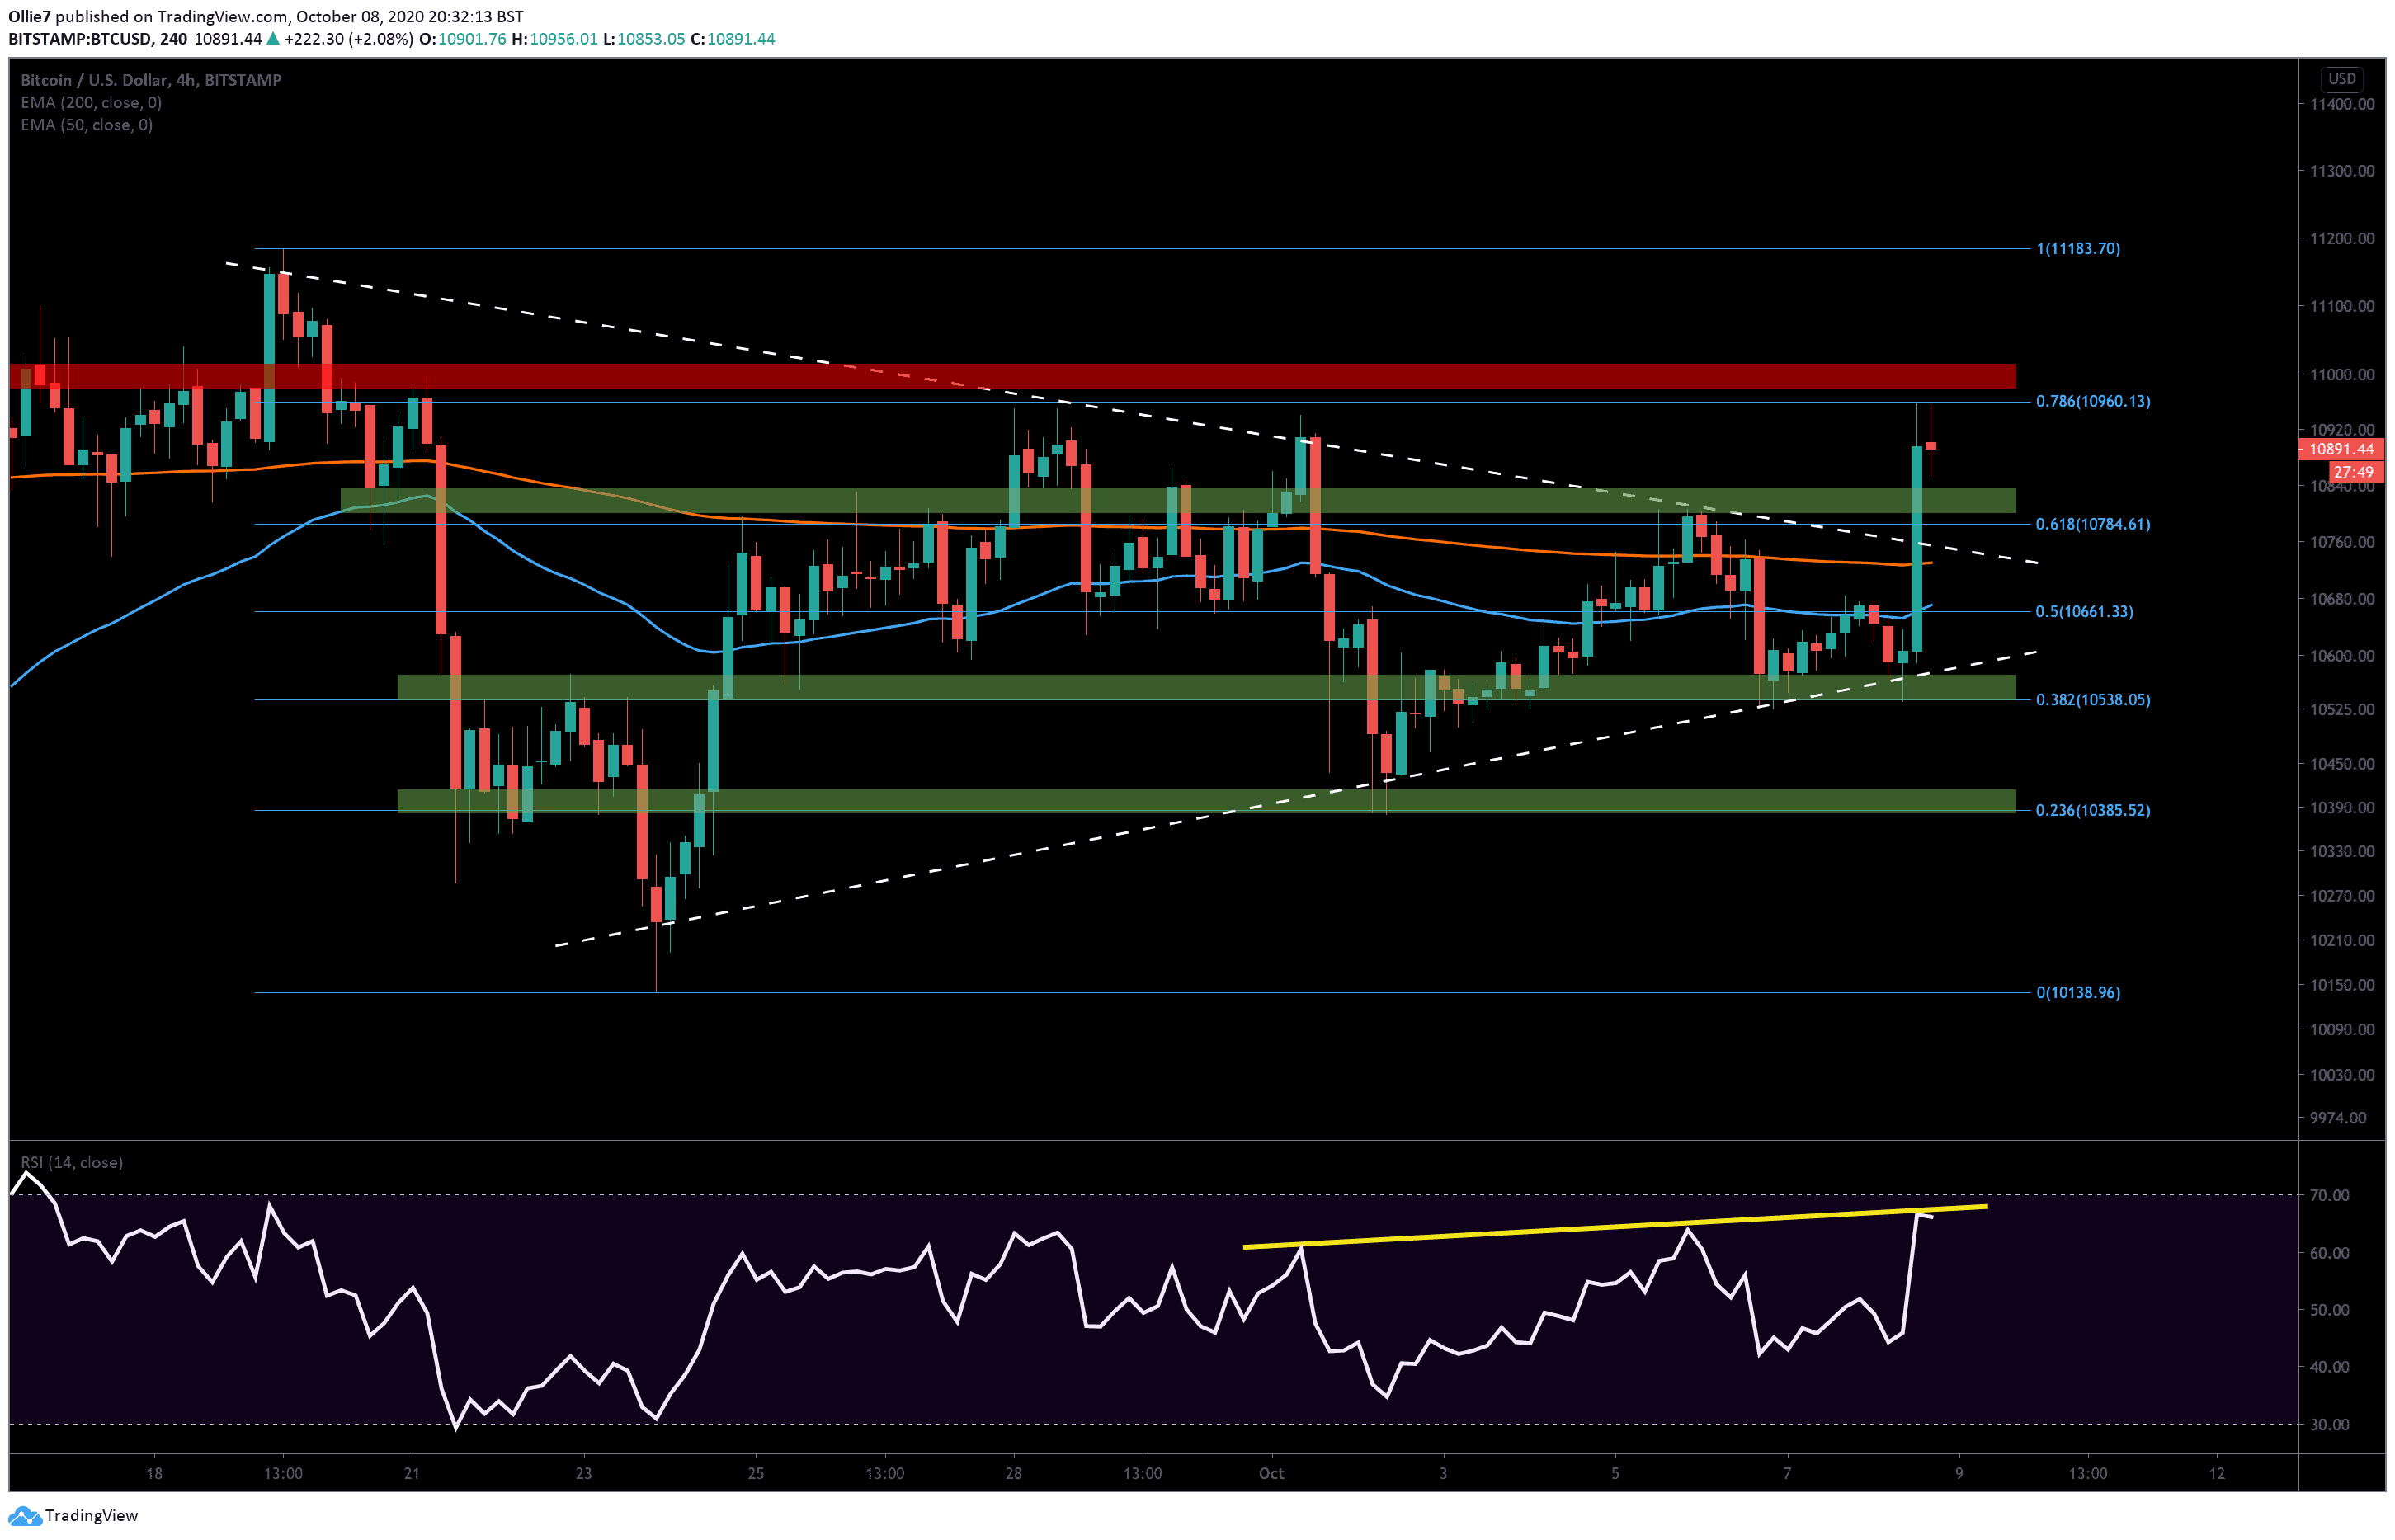
Bitcoin’s price has managed to climb $300 today and break bullish out of a 19-day consolidation pattern (white dashed lines). This is pretty surprising considering the recent Kucoin hack, BitMEX investigation from the CFTC, and the potential for a second wave of lockdowns worldwide.
In just 6 hours, $12 billion flooded back into the crypto markets, shortly after Jack Dorsey’s Square announced it had purchased 4.709 BTC (approx $50 million).
This catapulted the leading cryptocurrency through the strong resistance at $10,800 that has been holding down the asset since the start of the month and all the way up to the 0.5 Fibonacci level at $10,960, before correcting.
BTC Price Levels to Watch in the Short-term
Right now, bullish traders appear to be recharging around the psychological $10,900 level after meeting heavy selling pressure at the aforementioned Fibonacci level. It was this particular price point that created a double-top during the end of September and sent bitcoin prices reeling over $500.
This will be a crucial support to hold on if bulls are to recover and begin a second leg towards the $11,000 mark. If bears reclaim this level and flip it back into a resistance, it will likely cause the asset to throwback on to the former sloping resistance (white dashed line) and allow bullish traders to recover.
The main Bitcoin price targets in the short-term will be the 0.382 Fibonacci level and the $11,000 level. If traders can sustain the bullish momentum through these levels, then the $11,120, $11,183, and $11,400 will be the next most likely areas of strong resistance.
If prices crash through back inside the earlier consolidation pattern, we should expect to see the 200 EMA (red) at $10,730 provide strong support on the 4-hour timeframe. The 50 EMA (blue) at $10,680 and the 0.5 Fibonacci level at $10,660 should also help to prop up prices against further decline.
Total market capital: $348 billion
Bitcoin market capital: $201 billion
Bitcoin dominance: 57.8%
*Data by Coingecko.
Bitstamp BTC/USD 4-Hour Chart