Bitcoin was dabbling with the ,000 level for several days but, after another unsuccessful attempt to break above it, headed south and plummeted by ,000 in 24 hours. Recent data indicated a significant uptick of BTC transferred from cold wallets to exchanges, implying that the price drop could have been somewhat expected.8M Of BTC Moved To Exchanges Prior The DropAfter a predominantly calm weekend in which BTC displayed an untypical absence of high fluctuations, the cryptocurrency plummeted in value in the past 24 hours. CryptoPotato reported earlier today that the primary digital asset went from yesterday’s high of ,300 to a bottom of ,100. Most alternative coins followed suit, and the total market cap dumped by billion. Following the report, the cryptocurrency dipped
Topics:
Jordan Lyanchev considers the following as important: Bitcoin (BTC) Price, BTCEUR, BTCGBP, btcusd, btcusdt, featured1, social
This could be interesting, too:
Mandy Williams writes Bitcoin ETFs Record Over .6B in Outflows in the Past 2 Weeks
Chayanika Deka writes Bitcoin Whales Offload 6,813 BTC as Selling Pressure Mounts
Wayne Jones writes Bitcoin Sentiment Hits 2022 Lows as Fear & Greed Index Falls to 10
Jordan Lyanchev writes Bitcoin Falls Below K for the First Time in 3 Months, How Much Lower Can It Go?
Bitcoin was dabbling with the $19,000 level for several days but, after another unsuccessful attempt to break above it, headed south and plummeted by $1,000 in 24 hours. Recent data indicated a significant uptick of BTC transferred from cold wallets to exchanges, implying that the price drop could have been somewhat expected.
$278M Of BTC Moved To Exchanges Prior The Drop
After a predominantly calm weekend in which BTC displayed an untypical absence of high fluctuations, the cryptocurrency plummeted in value in the past 24 hours. CryptoPotato reported earlier today that the primary digital asset went from yesterday’s high of $19,300 to a bottom of $18,100. Most alternative coins followed suit, and the total market cap dumped by $35 billion. Following the report, the cryptocurrency dipped even further, reaching a low at around $17,650.
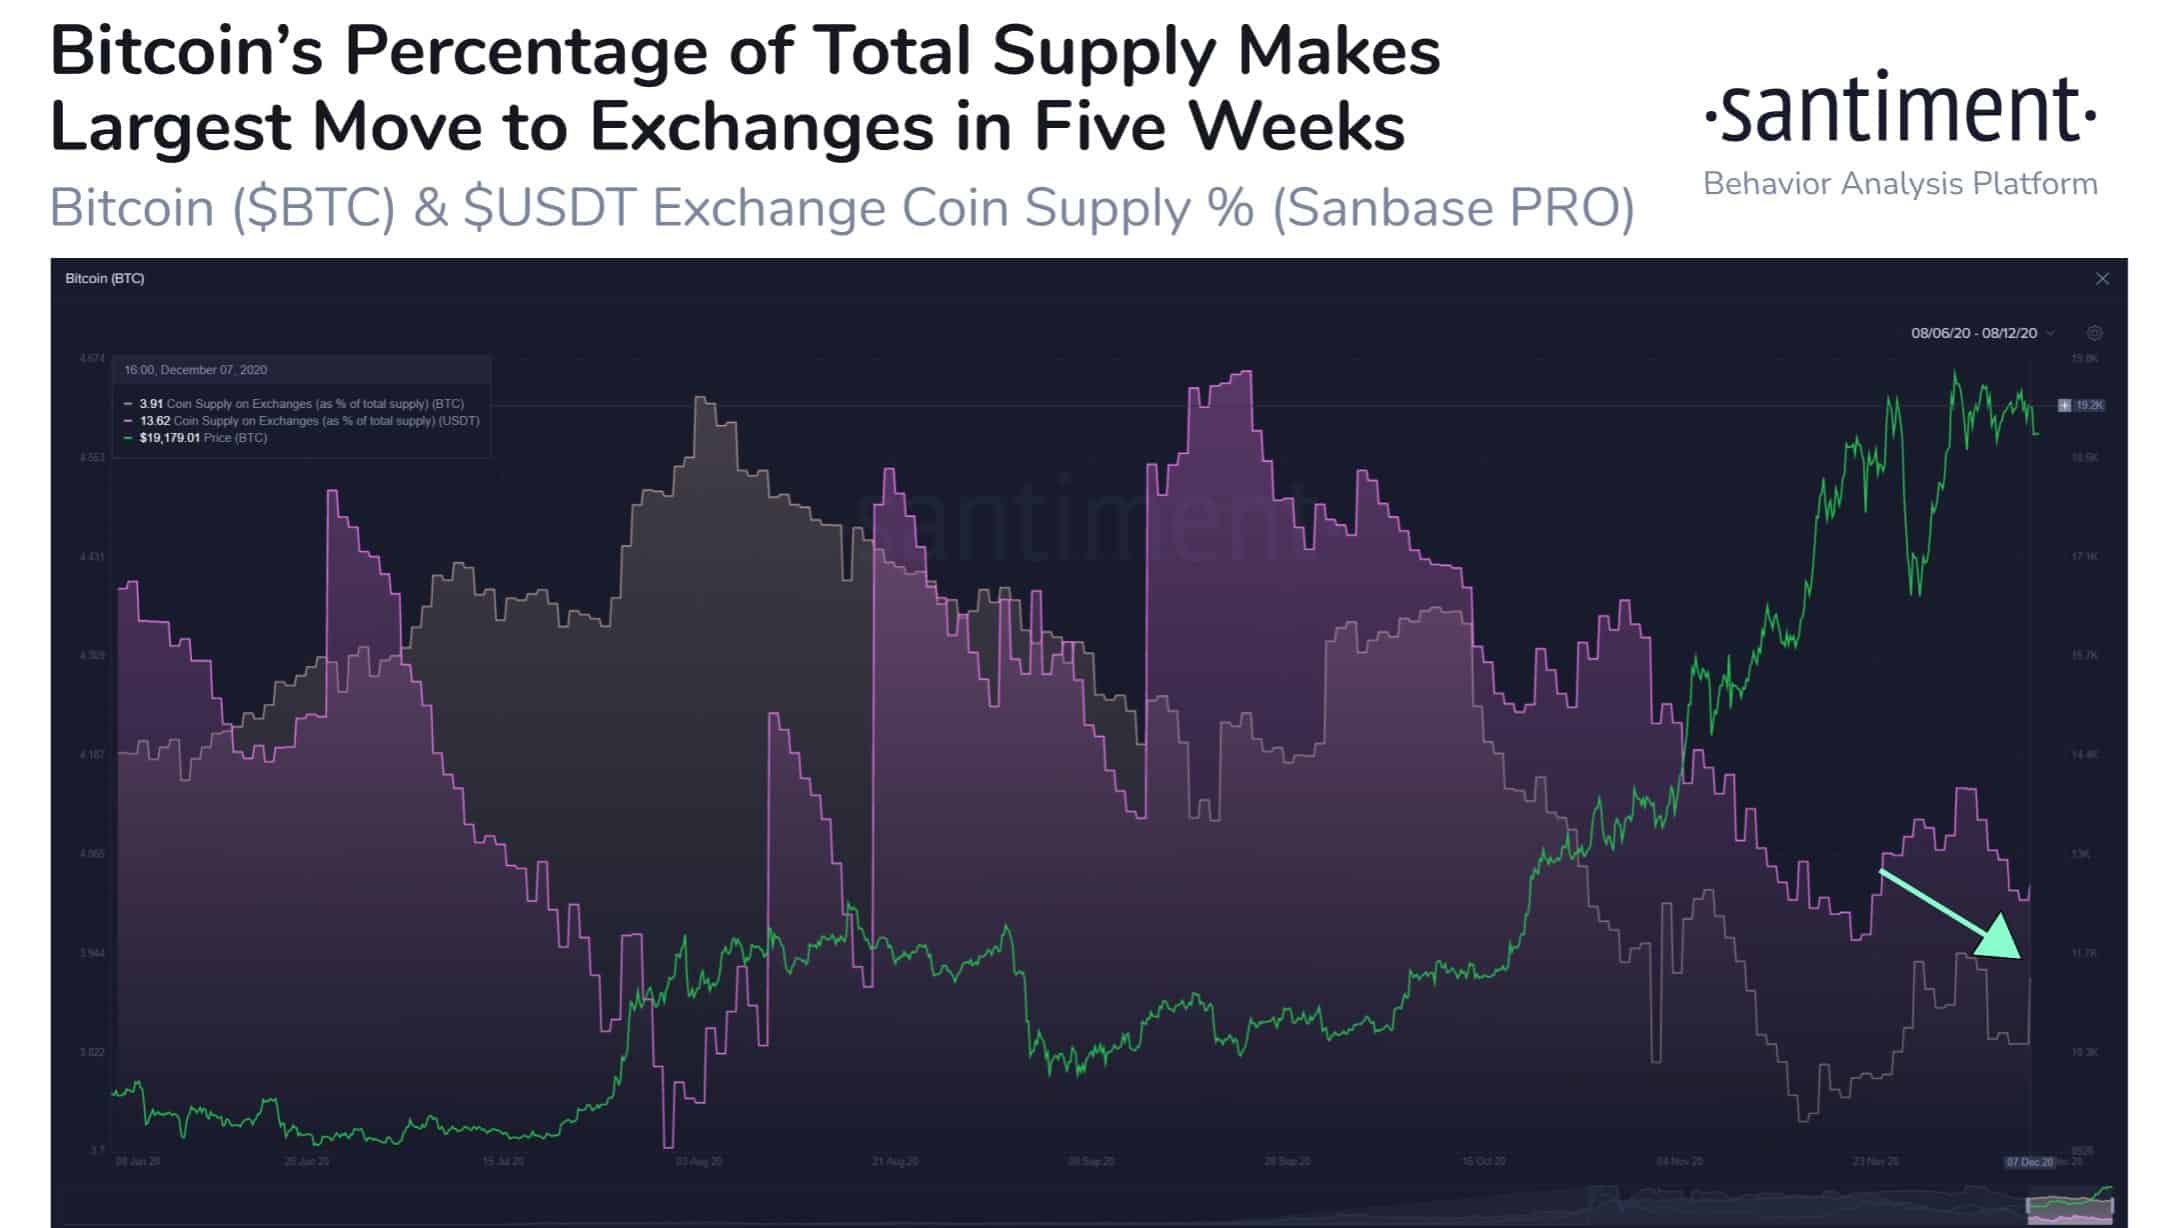
According to data from the analytics company Santiment, this development may have been expected to some extent. The firm followed the number of bitcoins stored on offline wallets and exchanges and highlighted an uptick shortly before the price declines.
Santiment said that this was the largest movement of bitcoins from cold wallets to digital asset exchanges in the past five weeks. About 0.08% of all bitcoins in circulation, meaning 14,852.58 BTC, ended up on trading venues. To put this sizeable amount in USD perspective – it’s just shy $280 million.
Macro Metrics Say: Insanely Bullish
Despite the short-term adverse price developments, Glassnode’s CTO Rafael Schultze-Kraft outlined several key BTC metrics that showcase an “insanely bullish” conclusion.
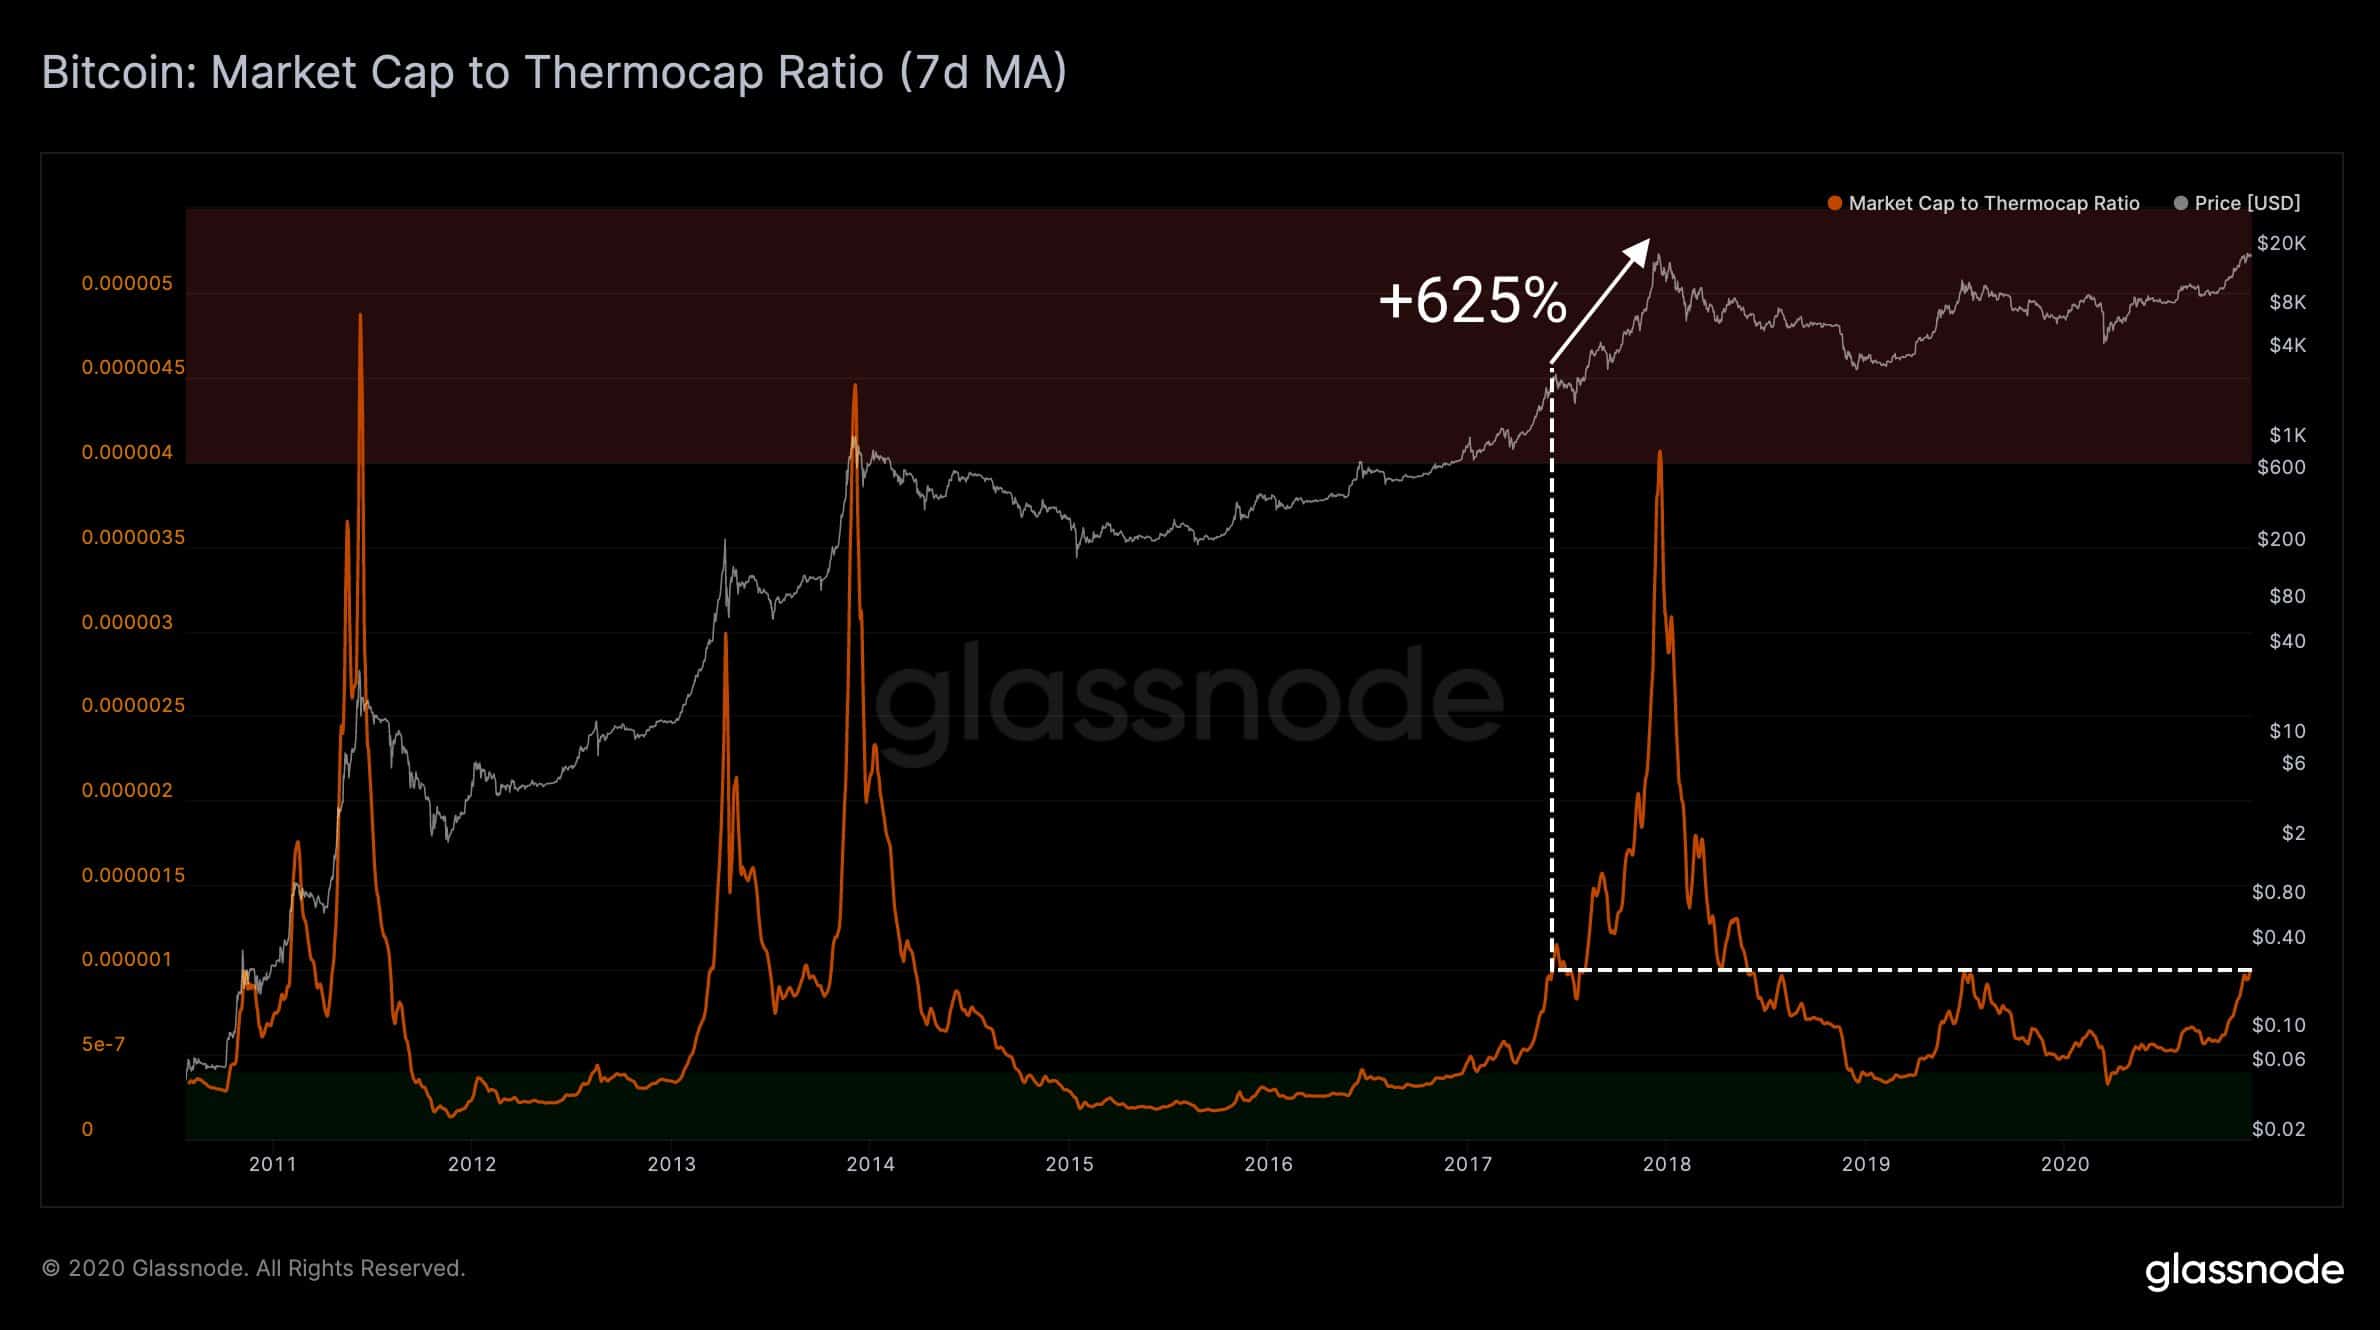
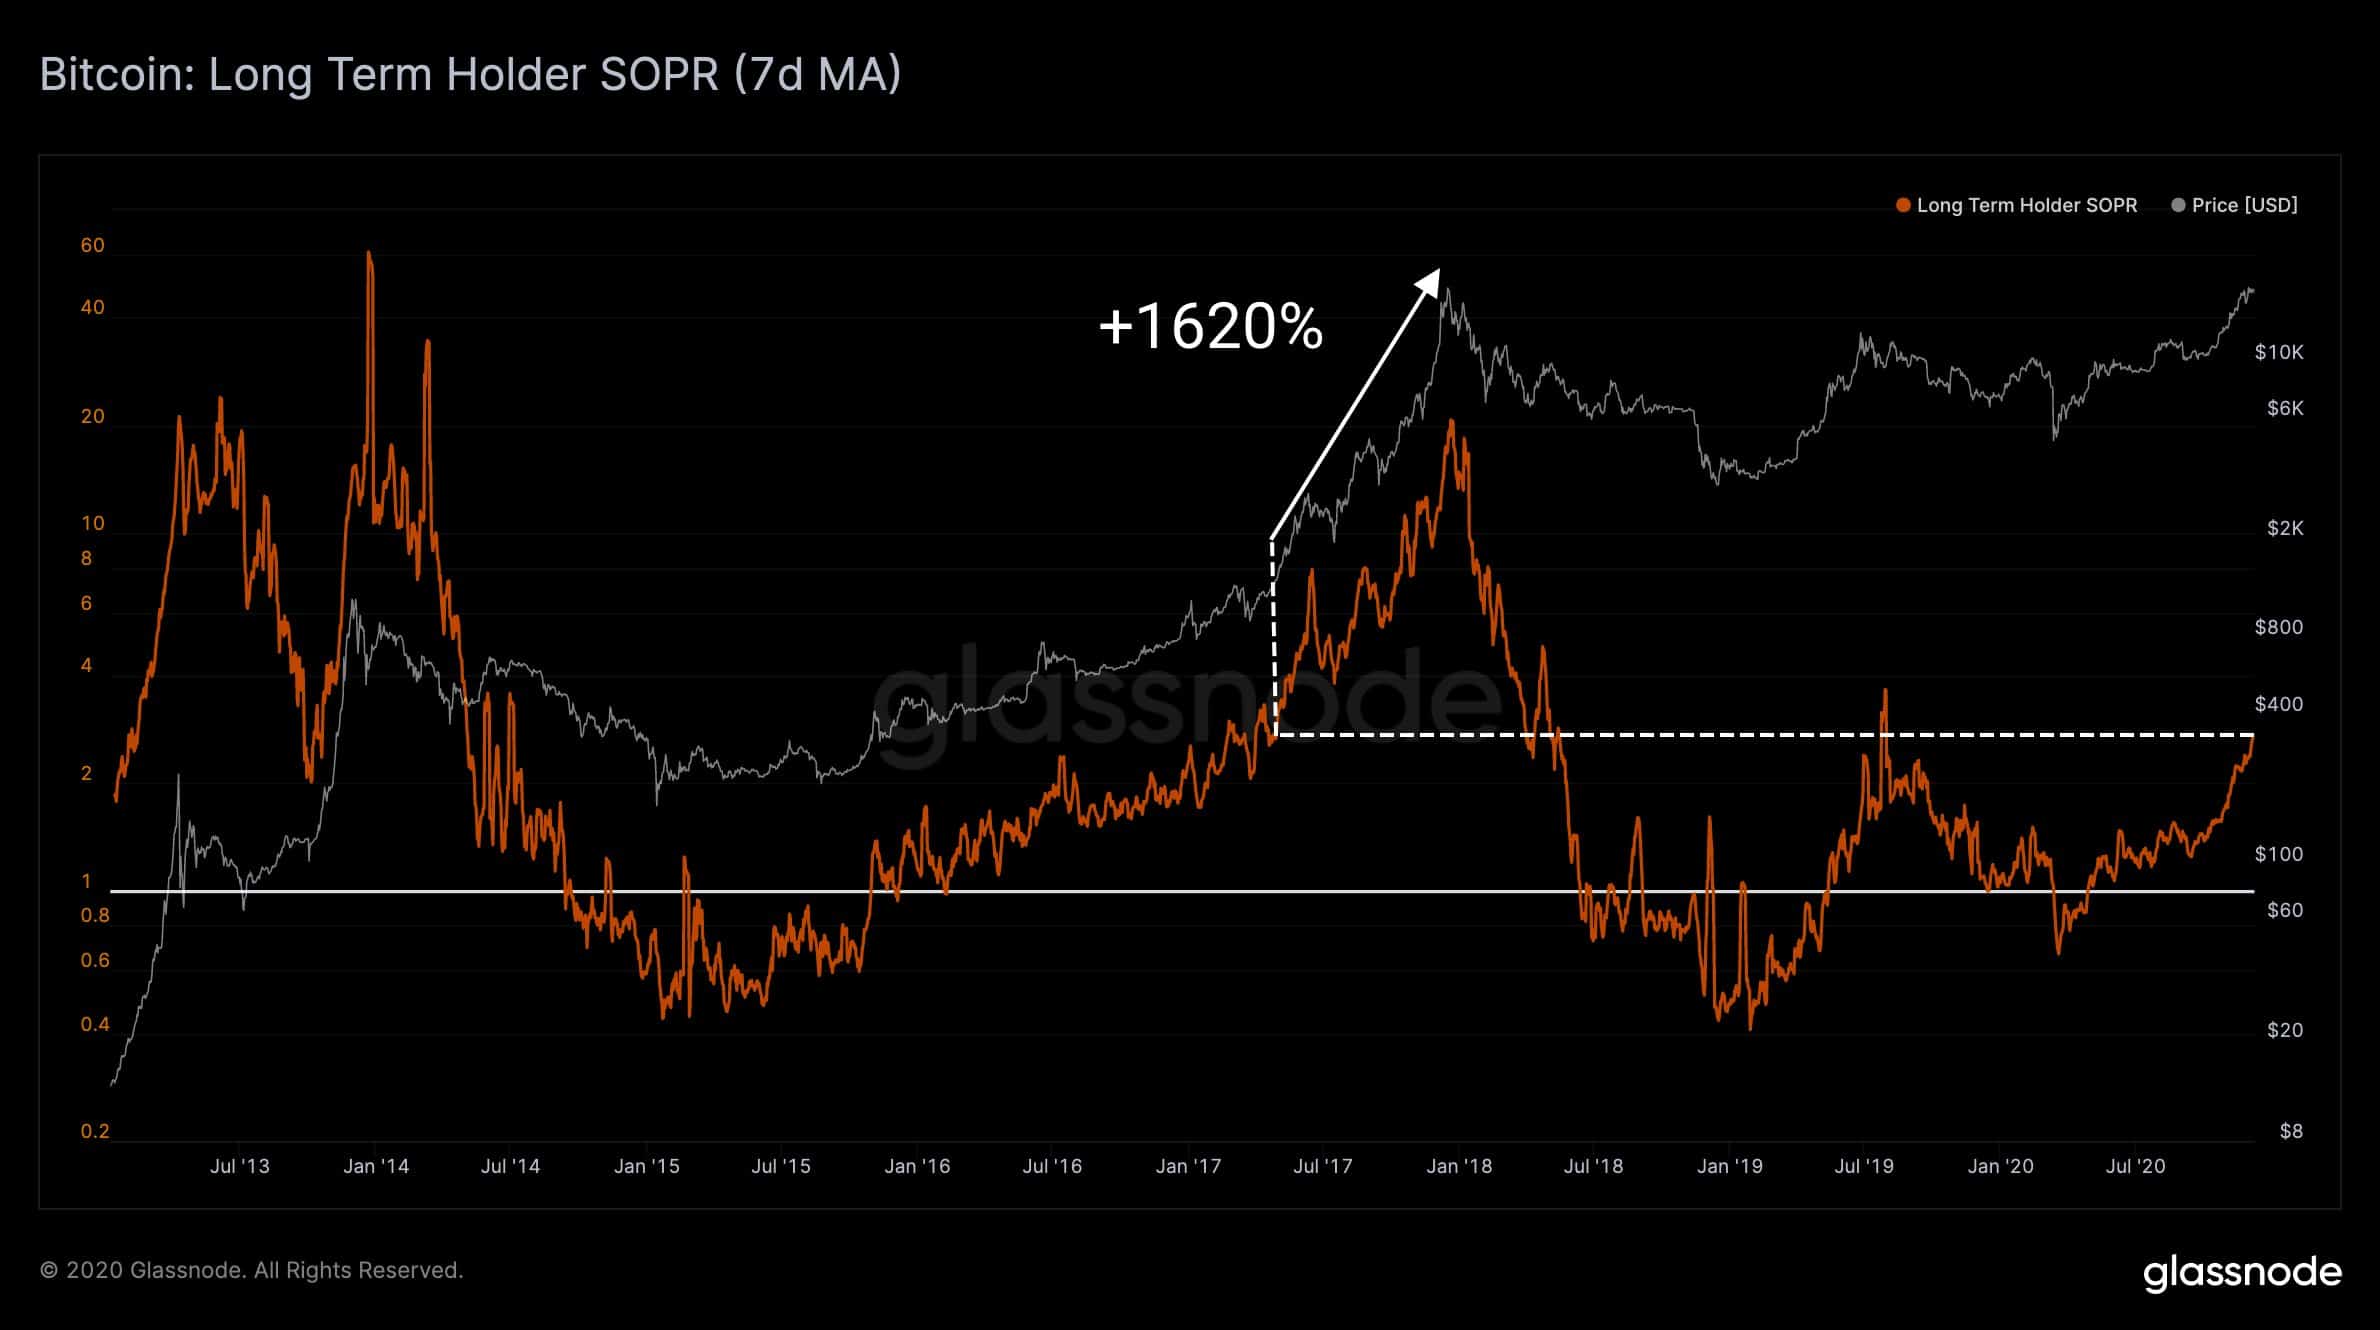
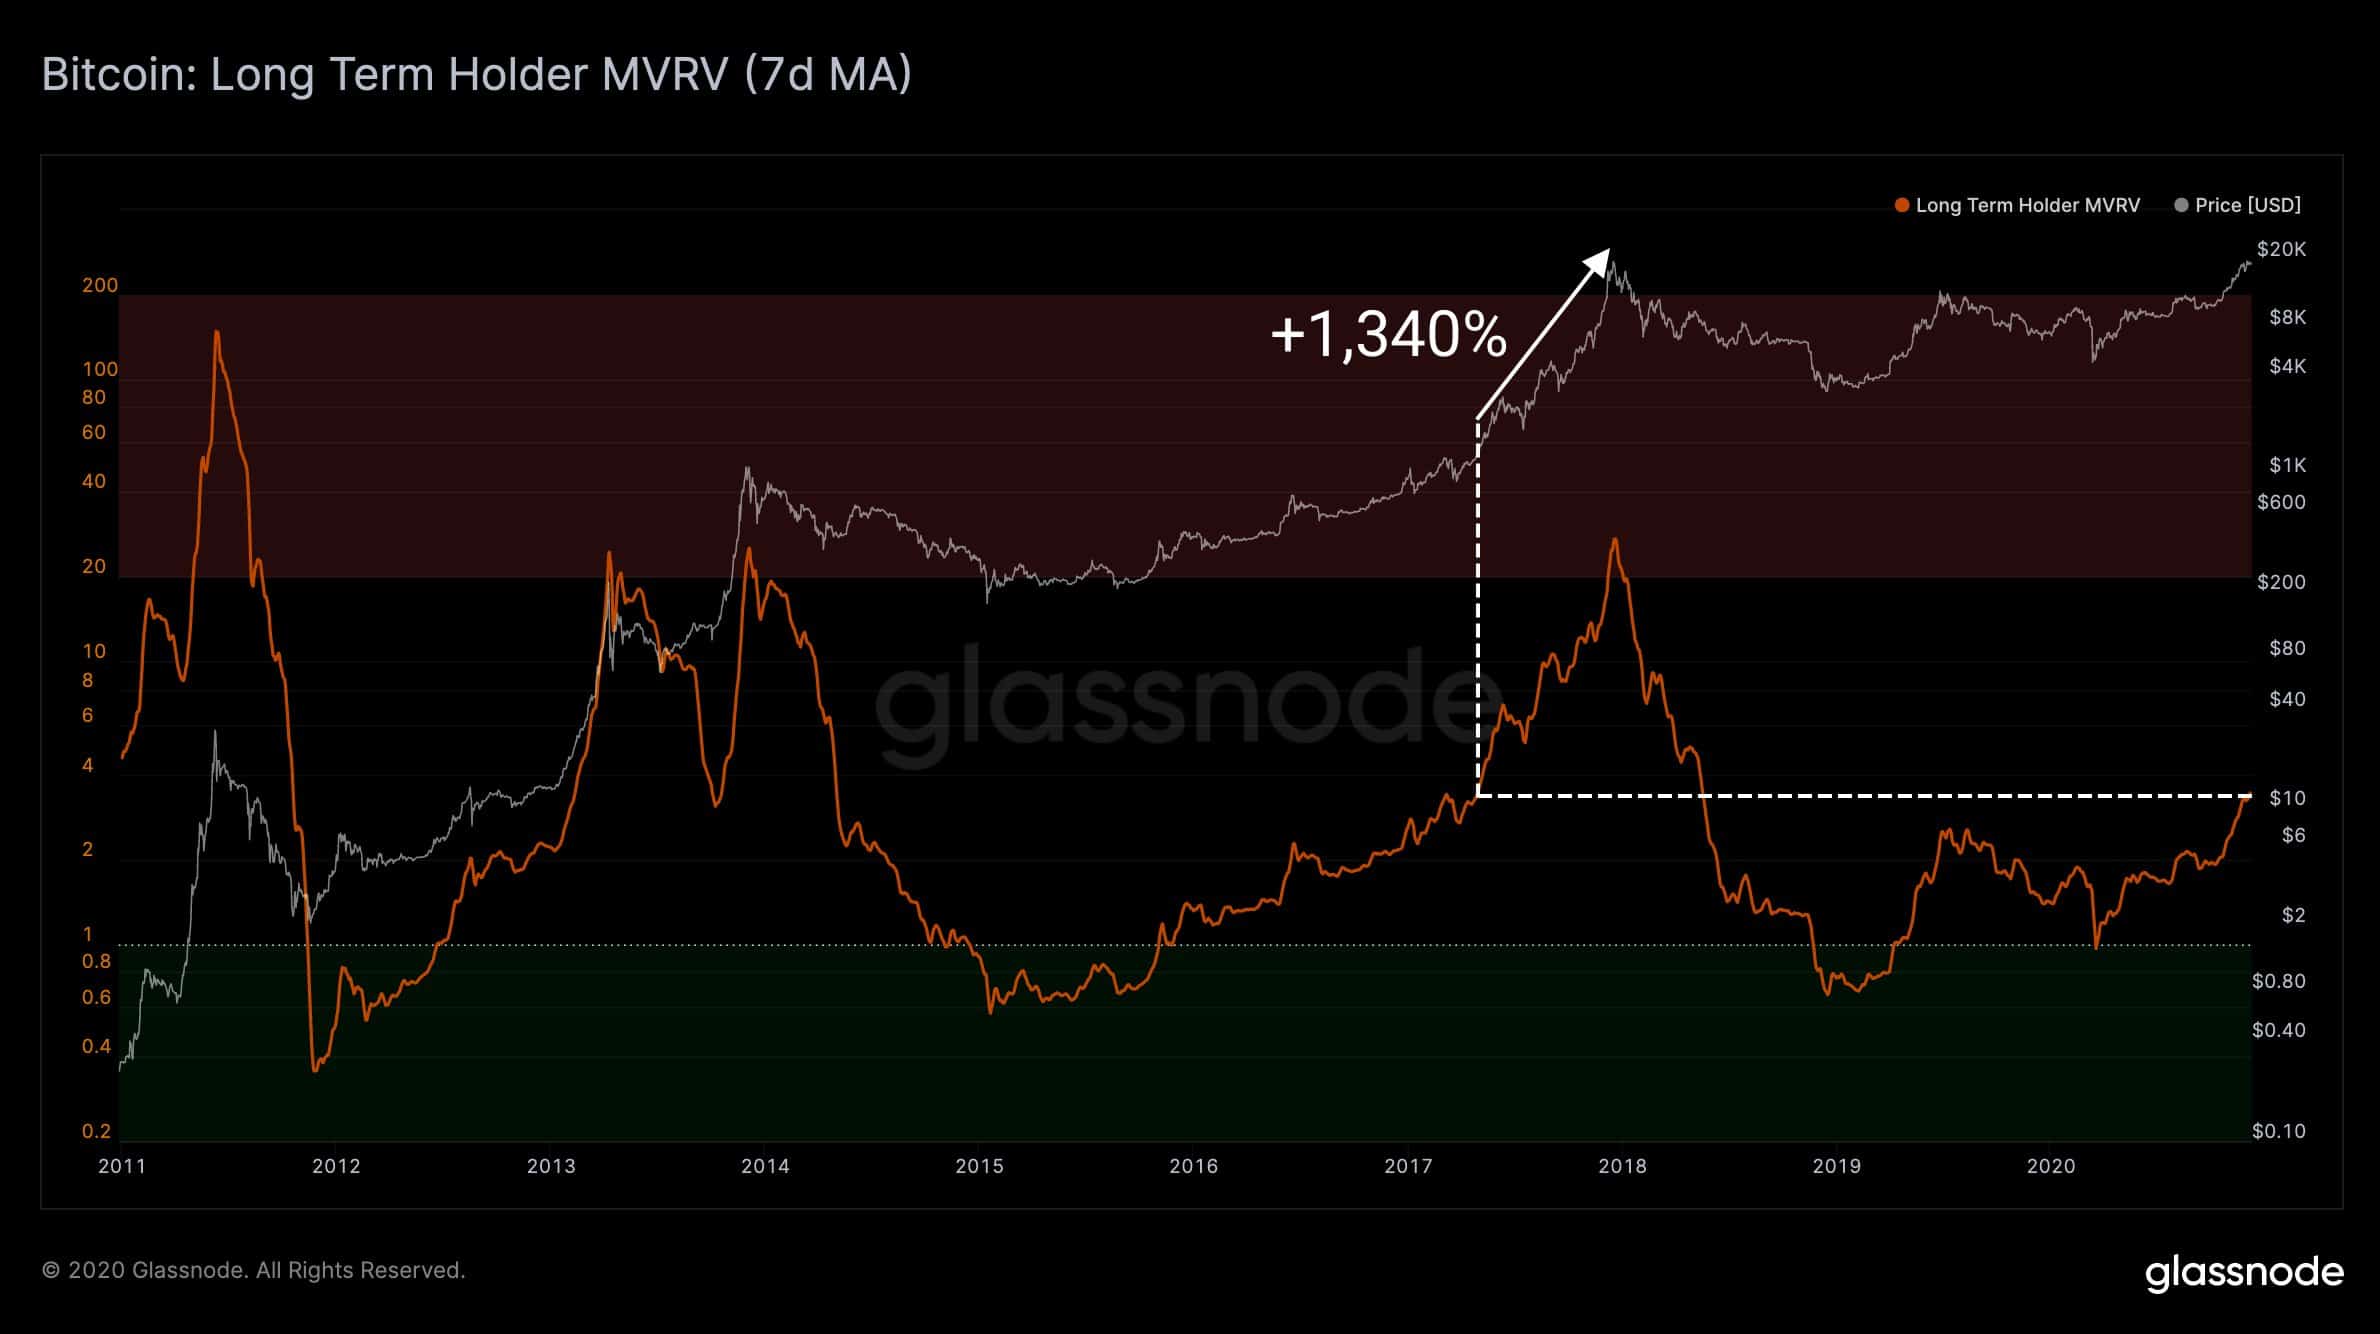
Some of those metrics include the Long Term Holder SOPR, the Long Term Holder MVRV, and the market cap to thermocap ratio.
The Long Term Holder SOPR considers only spent outputs with a lifespan of at least 155 days. It serves as an indicator to assess the behavior of long-term BTC investors. And, according to Schultze-Kraft, the metric was 1,620% higher during the 2017 high than it is now.
The Long Term Holder MVRV follows only UTXOs with a lifespan of 155 days or more, and it’s also an assessment of the behavior of the long-term investors. Glassnode’s CTO said that the difference between the 2017 and 2020 numbers is 1,340% greater for the former.
The Market Cap to Thermocap Ratio suggests if the asset’s price is currently trading at a premium with respect to the total security spend by miners. Glassnode data says it’s 625% away from the 2017’s numbers.