Popular cryptocurrency analyst believes that Bitcoin’s price is heading towards ,200 based on an inverse Head and Shoulders pattern. Interestingly, if BTC is indeed trading within the inverse H&S, the breakout could hand Bitcoin a target of ,000.BTC: ,200 Followed By ,000?The inverse head and shoulders technical pattern is identified when the price of an asset firstly drops to a certain level, rises back up, dives lower than the previous bottom, increases again, and finally falls but not as much as the second time (the second ‘shoulder’).The pattern plays out once the asset’s price breaks the ‘neckline’. In this case, the neckline is at ,000, whereas the shoulders lie around 00 and the head at 00 – the March 12 low.According to the popular cryptocurrency analyst, Satoshi
Topics:
Jordan Lyanchev considers the following as important: AA News, Bitcoin (BTC) Price, Bitcoin Long-Term Prediction, btcusd, btcusdt
This could be interesting, too:
Wayne Jones writes Beyond Hacks: Vitalik Buterin Calls for Wallet Solutions to Address Crypto Loss
Chayanika Deka writes Internal Conflict at Thorchain as North Korean Hackers Leverage Network for Crypto Laundering
Chayanika Deka writes Consensys and SEC Reach Agreement to Dismiss MetaMask Securities Case
Chayanika Deka writes Meme Coins Do Not Qualify as Securities: SEC Confirms
Popular cryptocurrency analyst believes that Bitcoin’s price is heading towards $7,200 based on an inverse Head and Shoulders pattern. Interestingly, if BTC is indeed trading within the inverse H&S, the breakout could hand Bitcoin a target of $16,000.
BTC: $7,200 Followed By $16,000?
The inverse head and shoulders technical pattern is identified when the price of an asset firstly drops to a certain level, rises back up, dives lower than the previous bottom, increases again, and finally falls but not as much as the second time (the second ‘shoulder’).
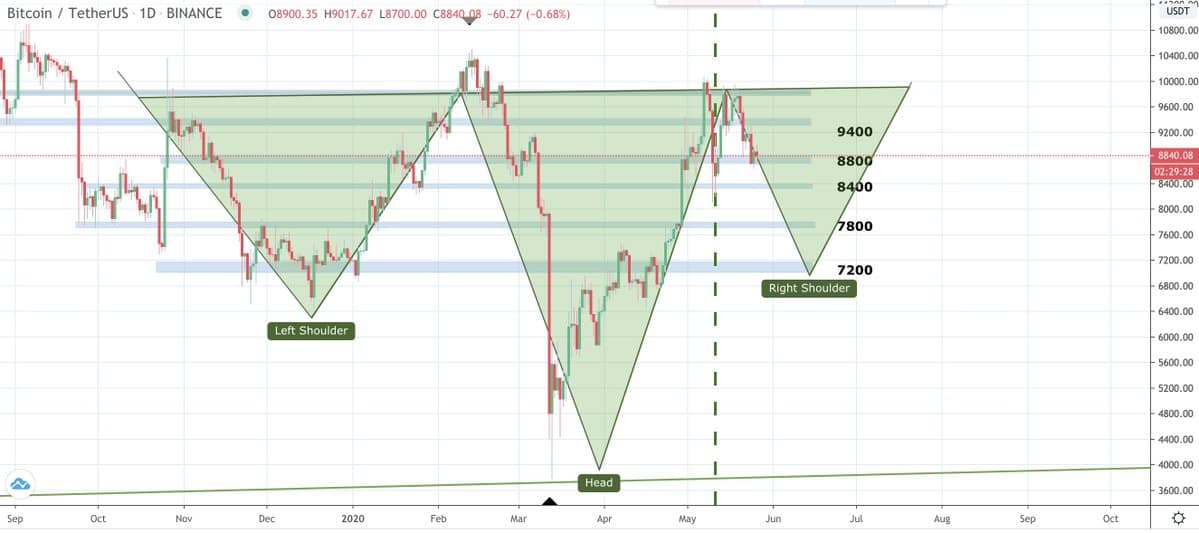
The pattern plays out once the asset’s price breaks the ‘neckline’. In this case, the neckline is at $10,000, whereas the shoulders lie around $7200 and the head at $3800 – the March 12 low.
According to the popular cryptocurrency analyst, Satoshi Flipper, Bitcoin’s price developments for the past several months have been charting such inverse H&S. Of course, things can change, and the pattern can invalidate; the bearish scenario is if Bitcoin breaks down the shoulders’ line at $7200 and/or not breaking above the neckline, which is the massive resistance at $10,000.
Bitcoin’s Latest Price Action
BTC entered this inverse H&S in late October 2019, when the asset surged following optimistic news from China. Since then, Bitcoin formed the left shoulder in mid-December when it dropped to about $6,400.
The initial 2020 bull run spiked the primary cryptocurrency to over $10,000, before forming the head during the massive sell-offs in mid-March when it dipped below $4,000. The second increase came when BTC was recovering from the Black Thursday, and it jumped above $10,000 again.
Now, however, the analyst estimates that Bitcoin is about to form the right shoulder in the next several weeks. Should his prediction come true, the price of BTC will bottom at about $7,200.
Once the full inverse H&S movement is finished, the general rule of thumb for the targeted price suggests that it’s equally distanced from the neckline as is the bottom of the head in the opposite direction. Therefore, since Bitcoin bottomed at approximately $3,800 and the neckline lies at $10,000, the breakout’s target given by the inverse H&S could take the price beyond $16,000.
Post-halving Rally?
Bitcoin went through its third-ever halving just a few weeks ago. Historically, both previous events have impacted the asset’s price, which could support the predictions from above.
Firstly, the 2016 block reward halving led to large discrepancies between the hash rate and the mining difficulty. This resulted in the departure of BTC miners, and ultimately, the price of Bitcoin lost over 20% in merely weeks following the event.
As CryptoPotato reported recently, similar disparities are observed now between the mining difficulty and the hash rate. If history is to repeat itself price-wise as well, the first-ever cryptocurrency could go as low as $6,750.
After the price shock of the first post-halving weeks, history becomes much more favorable towards Bitcoin.
In the months following the 2012 event, BTC jumped from $12 to nearly $1,200. In the year after the 2016 halving, Bitcoin went from $660 to $2,800 before peaking at its all-time high at almost $20,000 in December 2017.