Bitcoin remains dormant awaiting major price movement.Bitcoin seems to have entered a consolidation period following the 17% downswing it experienced at the beginning of the month. Its price appears to be contained within a narrow trading range, waiting for volatility to strike back. The ongoing stagnation phase forced the Bollinger bands to squeeze within BTC’s 4-hour chart, which is indicative of a major price movement about to take place.In the meantime, the flagship cryptocurrency continues to trade mostly between the ,900 support and the ,400 resistance level. Such a narrow trading pocket was visible throughout the week of August 7th.Bitcoin kicked off the week at a high of ,258 and quickly took a 3.69% nosedive to ,880. This price hurdle served as strong resistance,
Topics:
<title> considers the following as important:
This could be interesting, too:
Wayne Jones writes Beyond Hacks: Vitalik Buterin Calls for Wallet Solutions to Address Crypto Loss
Bilal Hassan writes DekaBank Partners with Boerse Stuttgart for Crypto Trading
Chayanika Deka writes Internal Conflict at Thorchain as North Korean Hackers Leverage Network for Crypto Laundering
Bilal Hassan writes Dunamu Files Lawsuit Against FIU Over Upbit Sanctions
Bitcoin remains dormant awaiting major price movement.
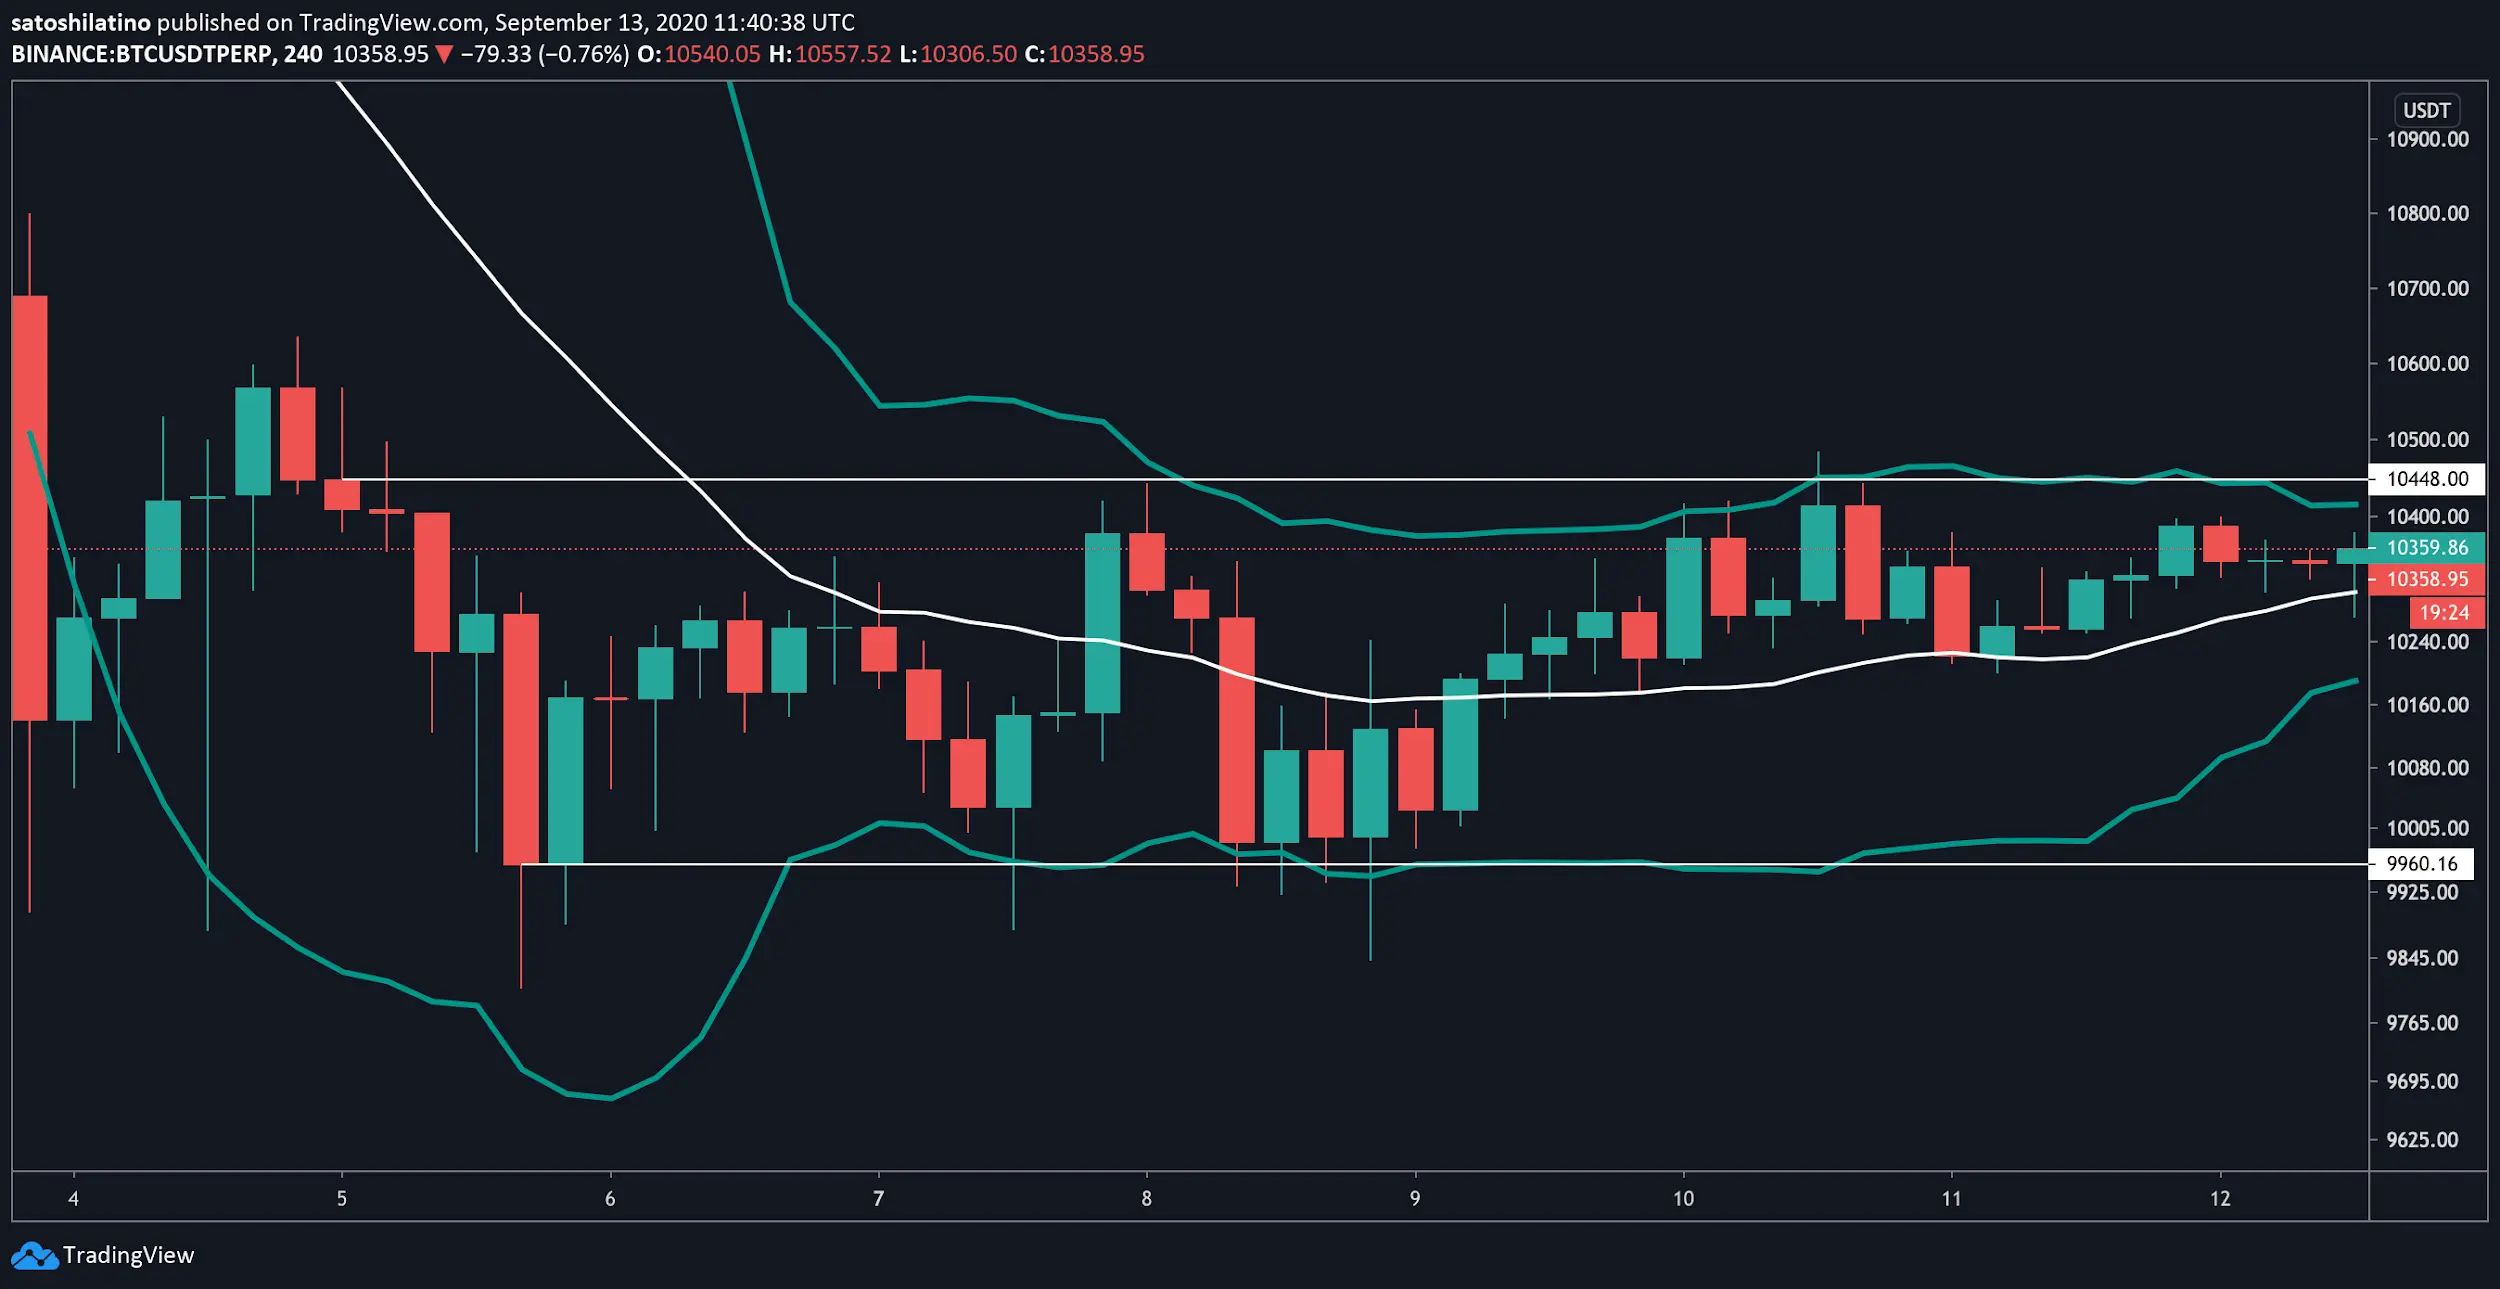
Bitcoin seems to have entered a consolidation period following the 17% downswing it experienced at the beginning of the month. Its price appears to be contained within a narrow trading range, waiting for volatility to strike back. The ongoing stagnation phase forced the Bollinger bands to squeeze within BTC’s 4-hour chart, which is indicative of a major price movement about to take place.
In the meantime, the flagship cryptocurrency continues to trade mostly between the $9,900 support and the $10,400 resistance level. Such a narrow trading pocket was visible throughout the week of August 7th.
Bitcoin kicked off the week at a high of $10,258 and quickly took a 3.69% nosedive to $9,880. This price hurdle served as strong resistance, allowing prices to rebound towards the overhead resistance. By Tuesday, September 8th, at 0:00 UTC, BTC was trading at a high of $10,444, but this supply barrier rejected the upward price action.

The rejection was followed by a 5.76% correction that saw the pioneer cryptocurrency move a few dollars below the $9,900 support level. Regardless, this price point was able to hold again. What followed was a 6.53% upswing that extended throughout the next two days.
Indeed, Bitcoin reached a weekly high of $10,484 on Thursday, September 10th, at 14:00 UTC. Just like it happened throughout the week, this resistance level rejected BTC from advancing further, triggering a 2.71% correction. Although Bitcoin was able to partially recover, it closed Friday, September 11th, at $10,388, providing investors a weekly return of 1.26%.
Ethereum Breaks Out of Consolidation Pattern Providing 6% in Weekly Returns
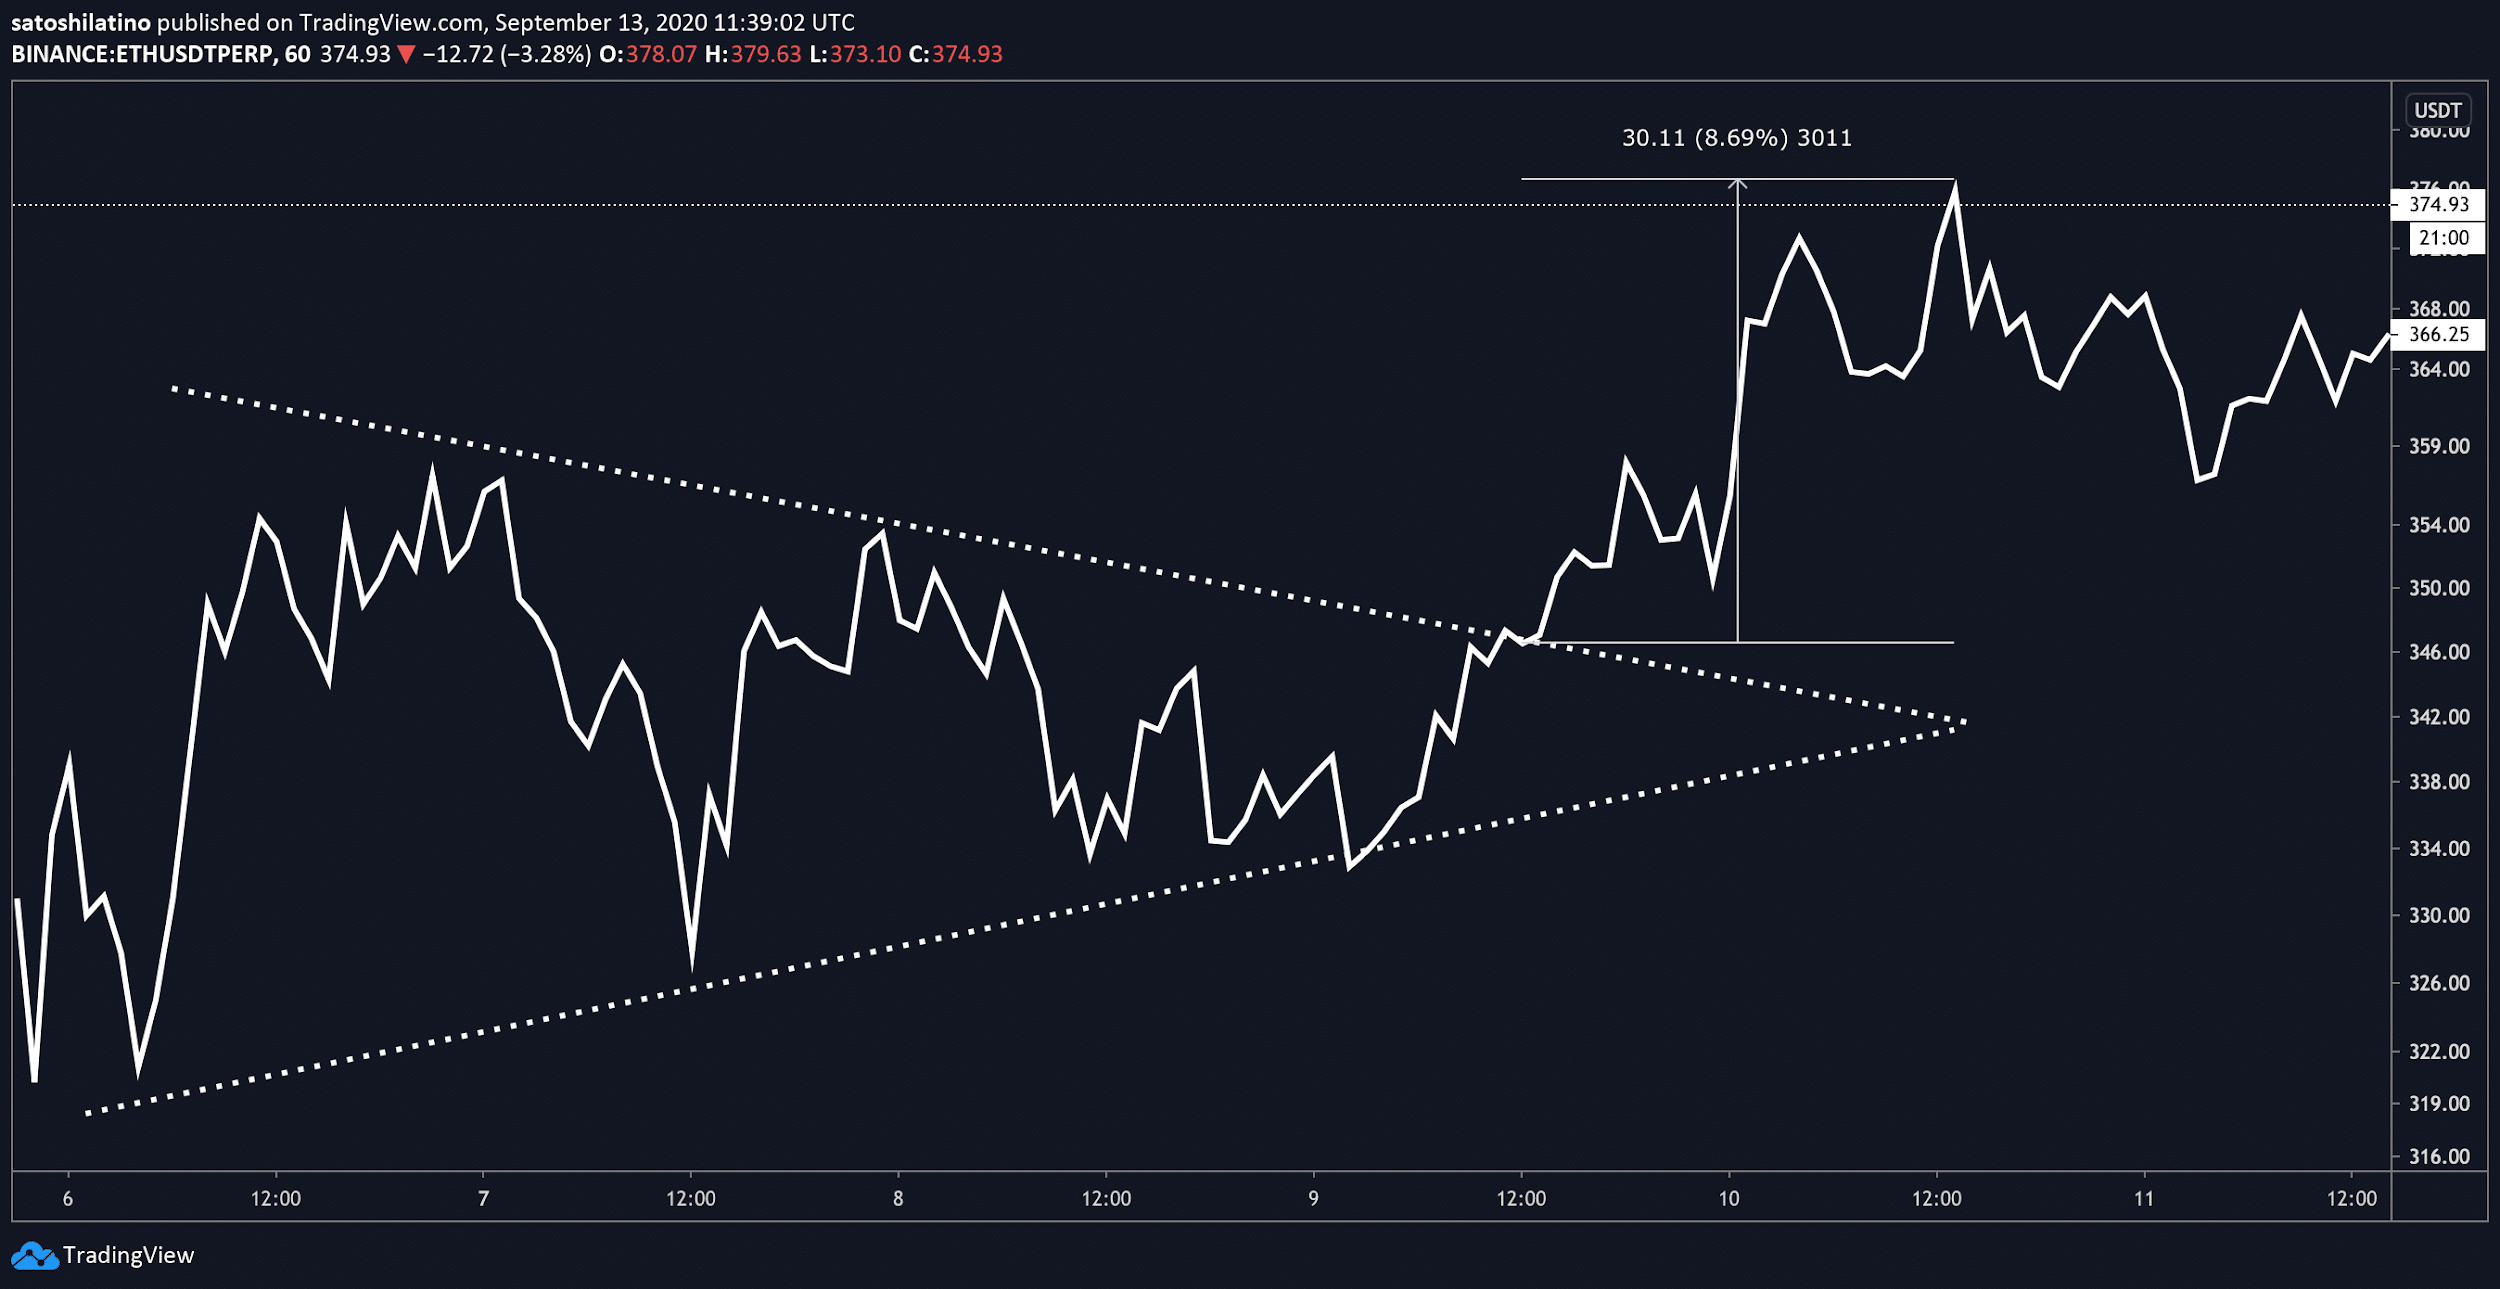
Like Bitcoin, Ethereum also entered a consolidation period after the massive 36% nosedive it took between September 2nd and September 5th. While its price was making a series of higher lows and lower highs, it seemed that a symmetrical triangle developed within ETH’s 1-hour chart. This type of technical formation provides an intriguing outlook since an asset can break out in any direction.
Nonetheless, several on-chain metrics indicated that as prices were plummeting during the first five days of September, large investors were taking advantage of it. Data reveals that roughly 68 new addresses holding between 1,000 to 10,000 ETH joined the network during the market-wide correction. The spike in buying pressure suggested that there was a high probability that Ether was going to break out of the symmetrical triangle in an upward direction.
While the smart contracts giant spent the first two days of the week consolidating within the aforementioned technical pattern, it was not until September 9th that the breakout took place. On this day, at around 12:00 UTC, several cryptocurrency exchanges recorded an increase in the number of buy orders behind Ethereum. The spike in demand led to an 8.56% upswing that allowed ETH to slice through the overhead resistance to make a weekly high of $377.79 approximately 24 hours later.

Following the upward price action, Ether suffered a small correction throughout the end of the week. But it was able to recover and close Friday, September 11th, trading at a high of $373.93. Due to the break out of the symmetrical triangle, ETH provided investors a weekly return of nearly 6%.
Make-or-Break Point on BTC and ETH’s Trend
Despite the upward price action that Ethereum went through over the week, Bitcoin’s price action suggests that the cryptocurrency market sits at a make-or-break point. If the buying pressure behind the flagship cryptocurrency does not increase, its price could slice through support and head towards $9,000. Such a downswing could affect the rest of the market.
For this reason, investors seem hopeful that Bitcoin would instead turn the $10,400 into support, which would signal the resumption of the bull rally. While the DeFi market sector continues to attract the attention of most market participants, it remains to be seen what will happen to the top two cryptocurrencies by market capitalization.

Executive Director at CEX.IO. His area of responsibility includes customer relationships with institutional and VIP-clients, overseeing the creation of the company’s development strategy, new products, markets and partnerships. As a member of the board of directors, Konstantin is also responsible for corporate governance.
