Chainlink dropped by a sharp 7% today and about 15% in the past two days.Before this drop, LINK had created a fresh all-time high at .74, gaining upwards of 35% in a week.Against Bitcoin, LINK is also heading lower as it dropped from the 120,000 SAT resistance to reach 108,000 SAT today.LINK/USD: LINK Rolls Over After Bulls Set Fresh All-Time HighKey Support Levels: , .40, .45.Key Resistance Levels: , .47, .Chainlink has been surging over the past month, being able to increase by a total of 62%. The coin started August at .83. It quickly broke above the level as it stalled at .45 for a couple of days..45 was eventually penetrated earlier this week, which allowed LINK to surge much higher to reach the all-time high price of .74. From there, LINK rolled
Topics:
Yaz Sheikh considers the following as important: Chainlink (LINK) Price, LINKBTC, LINKUSD, Price Analysis
This could be interesting, too:
Chayanika Deka writes Chainlink’s MVRV Ratio Signals Selling Exhaustion: What’s Next for LINK?
Chayanika Deka writes Whale and Shark Activity Pushes Chainlink (LINK) Past For the First Time in 37 Months
Martin Young writes Chainlink Partners With Major Finance Firms on AI, Oracles, and Blockchain Data Solution Project
Dimitar Dzhondzhorov writes Top 10 Cryptocurrencies by ‘Notable Development Activity’ (Santiment)
- Chainlink dropped by a sharp 7% today and about 15% in the past two days.
- Before this drop, LINK had created a fresh all-time high at $14.74, gaining upwards of 35% in a week.
- Against Bitcoin, LINK is also heading lower as it dropped from the 120,000 SAT resistance to reach 108,000 SAT today.
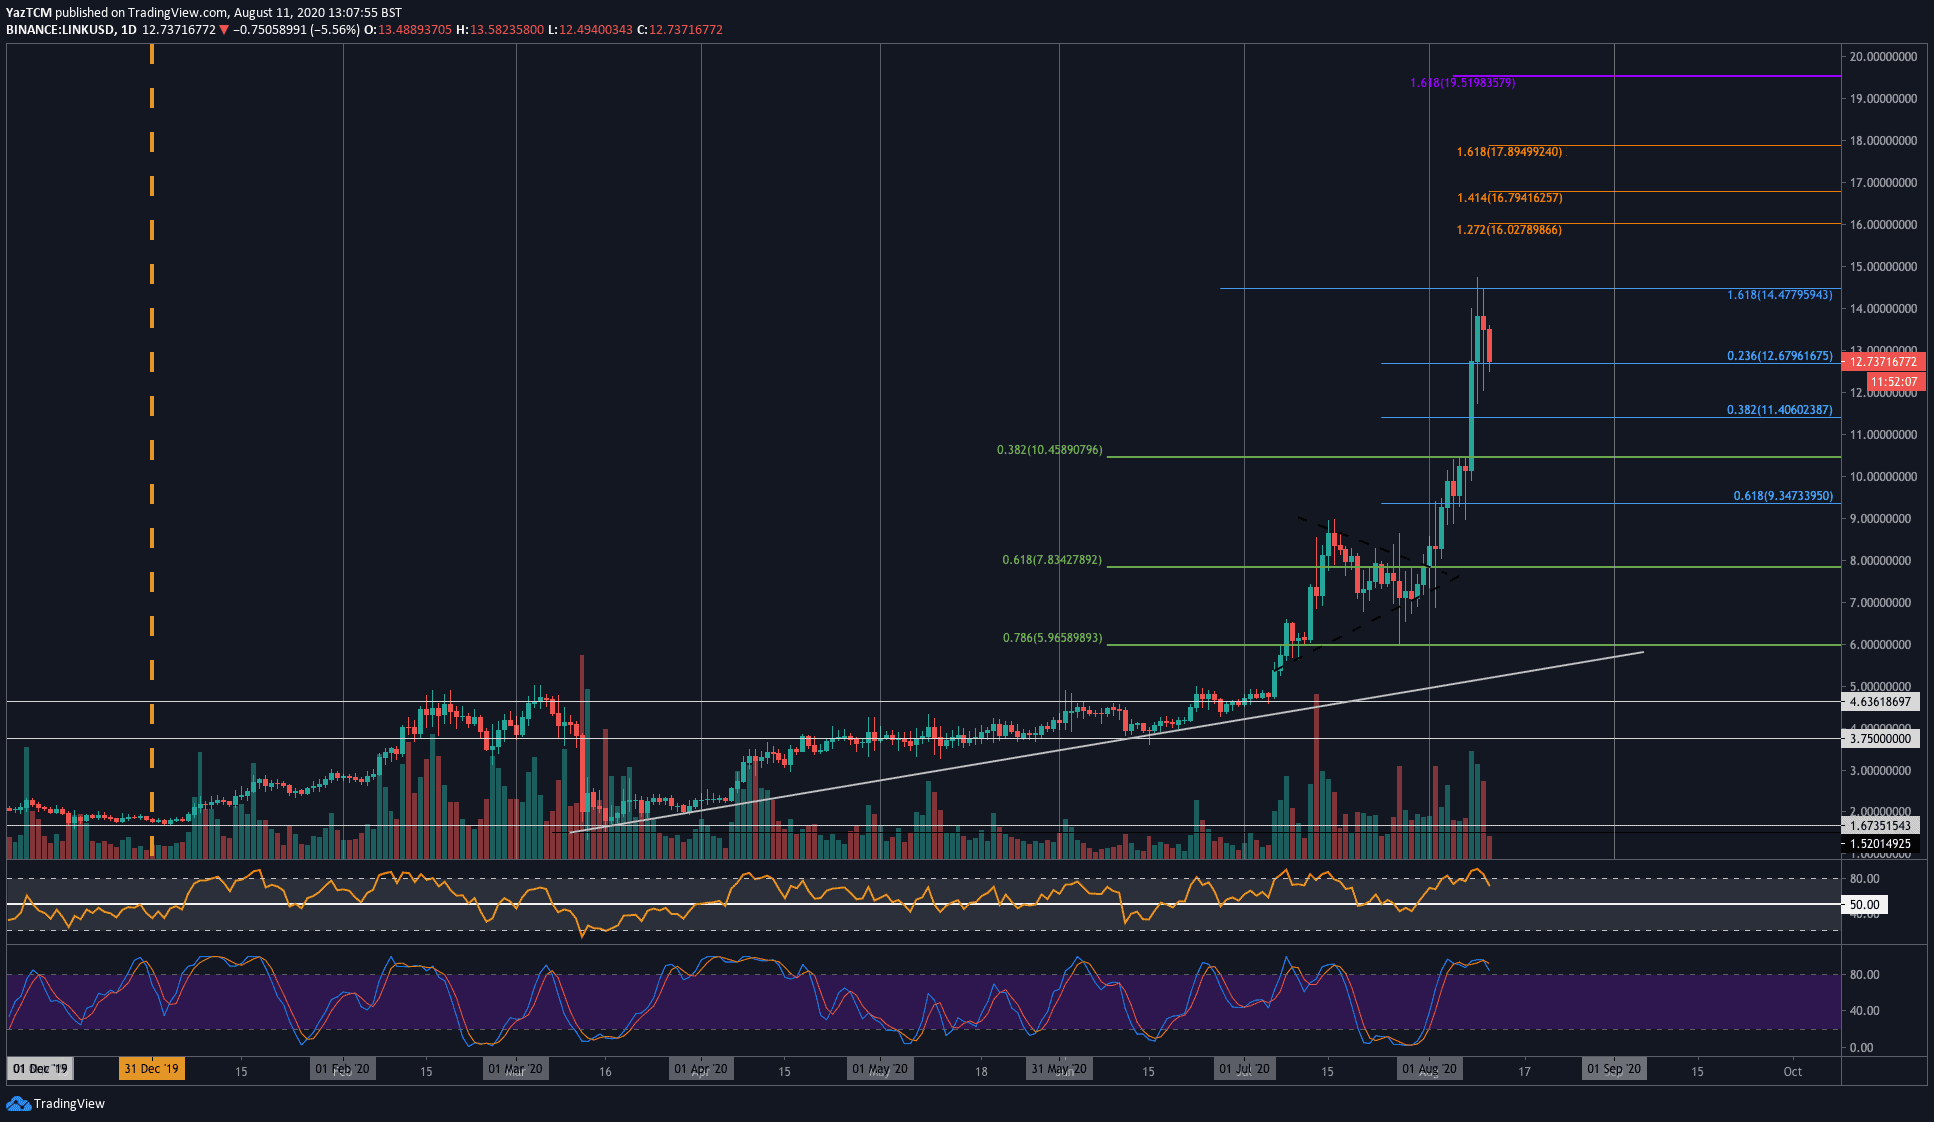
LINK/USD: LINK Rolls Over After Bulls Set Fresh All-Time High
Key Support Levels: $12, $11.40, $10.45.
Key Resistance Levels: $14, $14.47, $15.
Chainlink has been surging over the past month, being able to increase by a total of 62%. The coin started August at $7.83. It quickly broke above the $10 level as it stalled at $10.45 for a couple of days.
$10.45 was eventually penetrated earlier this week, which allowed LINK to surge much higher to reach the all-time high price of $14.74. From there, LINK rolled over to $12.50 (.236 Fib Retracement) today.
The volume for LINK trading on Coinbase has surpassed the volume for BTC trading on the exchange yesterday. This shows the type of momentum that is sitting behind LINK right now.
LINK-USD Short Term Price Prediction
Looking ahead, if the buyers rebound from $12.67, resistance is first located at $14. This is followed by $14.47 (1.618 Fib Extension), $15, and $16 (1.272 Fib Extension). Additional resistance lies at $16.79, $17, and $17.89.
On the other side, if the sellers break beneath $12.67, additional support can be found at $12, $11.40 (.382 Fib Retracement), and $10.45. If the selling continues beneath $10, support is found at $9.34 and $9.00.
The RSI has turned away from overbought conditions, which is a good sign as it gives ‘breathing space’ for the buyers to regroup before pushing higher. The momentum will remain in the hands of the bulls so long as the RSI can remain above 50
LINK/BTC: Bulls Fail To Overcome 120,000 SAT Resistance And Head Lower
Key Support Levels: 103,000 SAT, 100,000 SAT, 94,300 SAT.
Key Resistance Levels: 120,000 SAT, 130,000 SAT, 137,500 SAT.
Against Bitcoin, LINK is in a similar situation. The coin started trading in August at the 68,000 SAT level as it quickly started to push higher. It eventually broke above the July high of 94,000 SAT and went on to climb above 100,000 SAT to reach the resistance at 119,000 SAT (1.618 Fib Extension).
LINK was unable to break this point and headed lower into the support at 108,000 SAT today.

LINK-BTC Short Term Price Prediction
Looking ahead, if the sellers continue to drive LINK lower, support lies at 103,000 SAT (.236 Fib Retracement), 100,000 SAT, and 94,300 SAT. Beneath this, added support is found at 90,000 SAT (.382 Fib Retracement), 85,000 SAT, and 79,000 SAT (.5 Fib Retracement)
On the other side, if the bulls can rebound from 108,000 SAT, the first level of strong resistance lies at 120,000 SAT (1.618 Fib Extension). Beyond this, resistance lies at 130,000 SAT, 133,000 SAT, 137,500 SAT (1.272 Fib Extension), and 144,000 SAT (1.414 Fib Extension).
Likewise, the RSI has dropped from overbought conditions to allow the bulls to regroup before pushing higher. The Stochastic RSI is primed for a bearish crossover signal, which might help to send the market lower again.