BitcoinBitcoin saw a small 3% price increase over the past seven days as it currently trades around the ,433 level. The cryptocurrency had started the week off by dropping beneath ,000 and reaching the support at the rising trend line. Luckily, the buyers managed to defend this support to prevent BTC from slipping into a bearish trend.Bitcoin rebounded from the rising trend line over the past three days as it breached the ,000 resistance again and continued as high as ,600. It has recently dropped lower from there as it trades at ,433.Looking ahead, if the buyers continue to drive higher, the first level of resistance is located at ,600. Following this, resistance lies at ,815 and ,000. Beyond ,000, resistance is found at ,226, ,430, and ,600.BTC/USD. Source:
Topics:
Yaz Sheikh considers the following as important: Bitcoin (BTC) Price, btcusd, Chainlink (LINK) Price, ETH Analysis, ETHBTC, Ethereum (ETH) Price, ethusd, LINKBTC, LINKUSD, Market Updates, Price Analysis, Ripple (XRP) Price, Tezos (XTZ) Price, XRP Analysis, xrpbtc, xrpusd, XTZBTC, XTZUSD
This could be interesting, too:
Mandy Williams writes Bitcoin ETFs Record Over .6B in Outflows in the Past 2 Weeks
Chayanika Deka writes Bitcoin Whales Offload 6,813 BTC as Selling Pressure Mounts
Wayne Jones writes Bitcoin Sentiment Hits 2022 Lows as Fear & Greed Index Falls to 10
Dimitar Dzhondzhorov writes Is a Major Ripple v. SEC Lawsuit Development Expected This Week? Here’s Why
Bitcoin
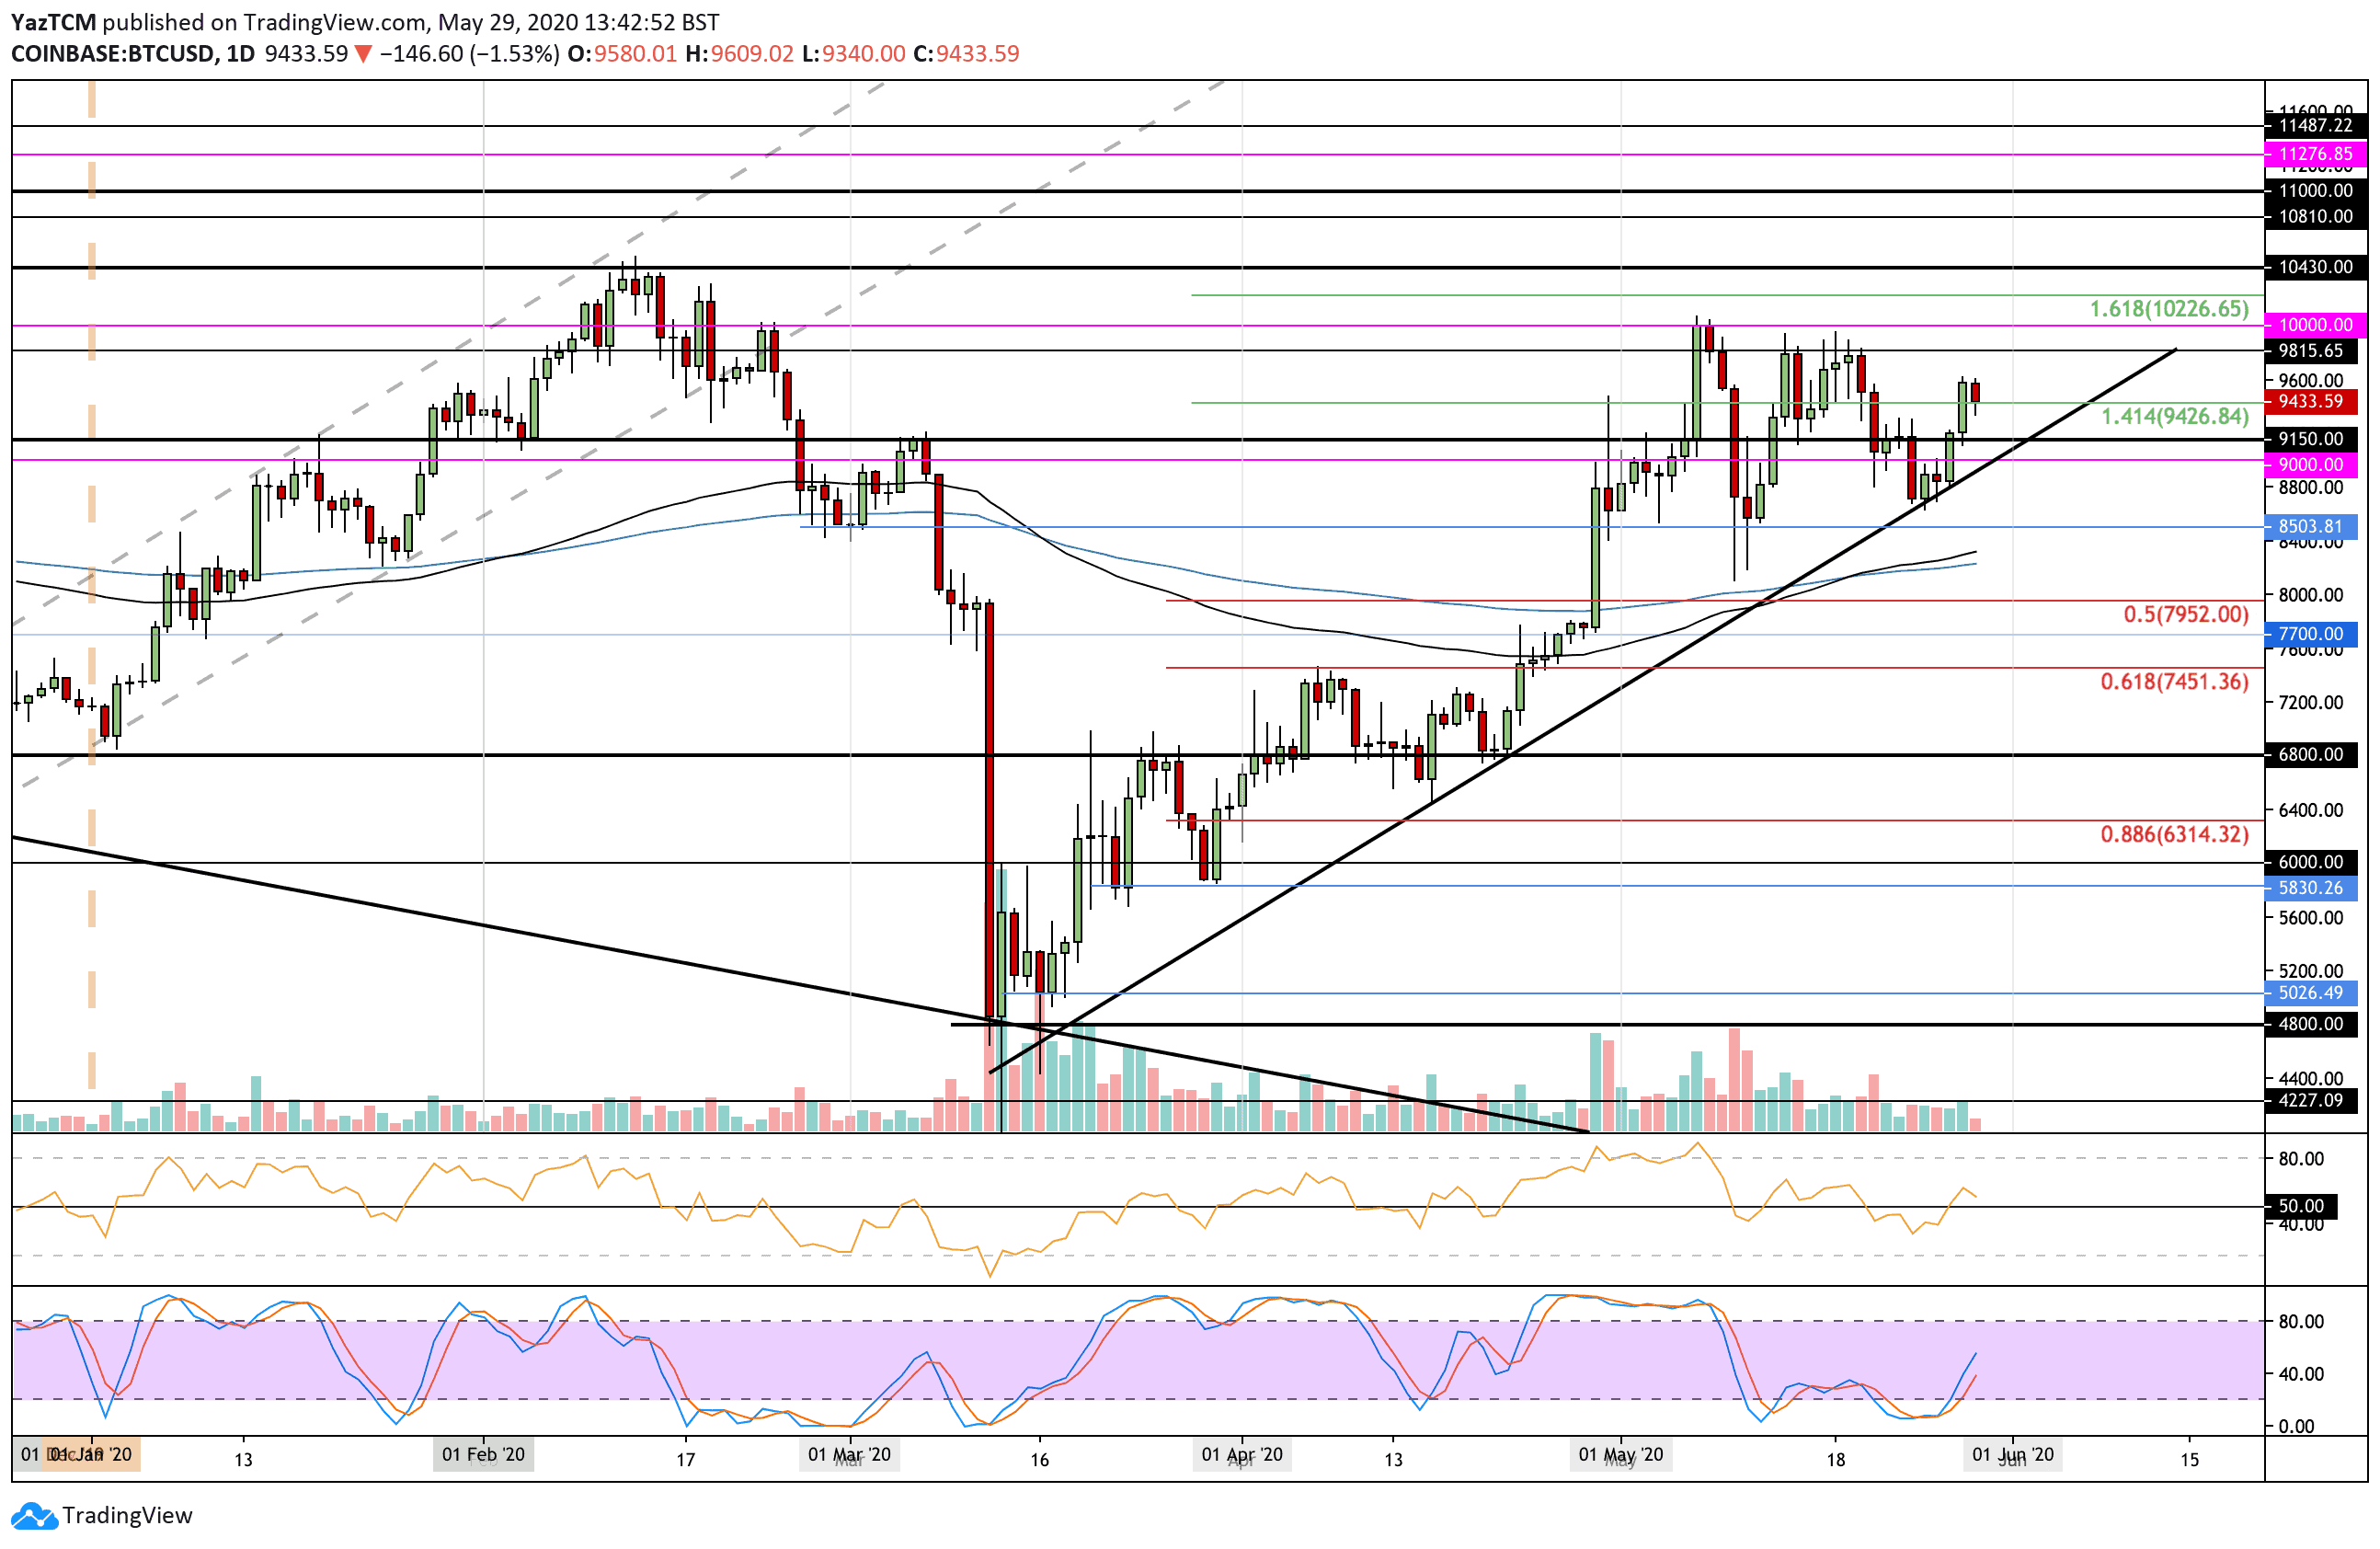
Bitcoin saw a small 3% price increase over the past seven days as it currently trades around the $9,433 level. The cryptocurrency had started the week off by dropping beneath $9,000 and reaching the support at the rising trend line. Luckily, the buyers managed to defend this support to prevent BTC from slipping into a bearish trend.
Bitcoin rebounded from the rising trend line over the past three days as it breached the $9,000 resistance again and continued as high as $9,600. It has recently dropped lower from there as it trades at $9,433.
Looking ahead, if the buyers continue to drive higher, the first level of resistance is located at $9,600. Following this, resistance lies at $9,815 and $10,000. Beyond $10,000, resistance is found at $10,226, $10,430, and $10,600.
Ethereum
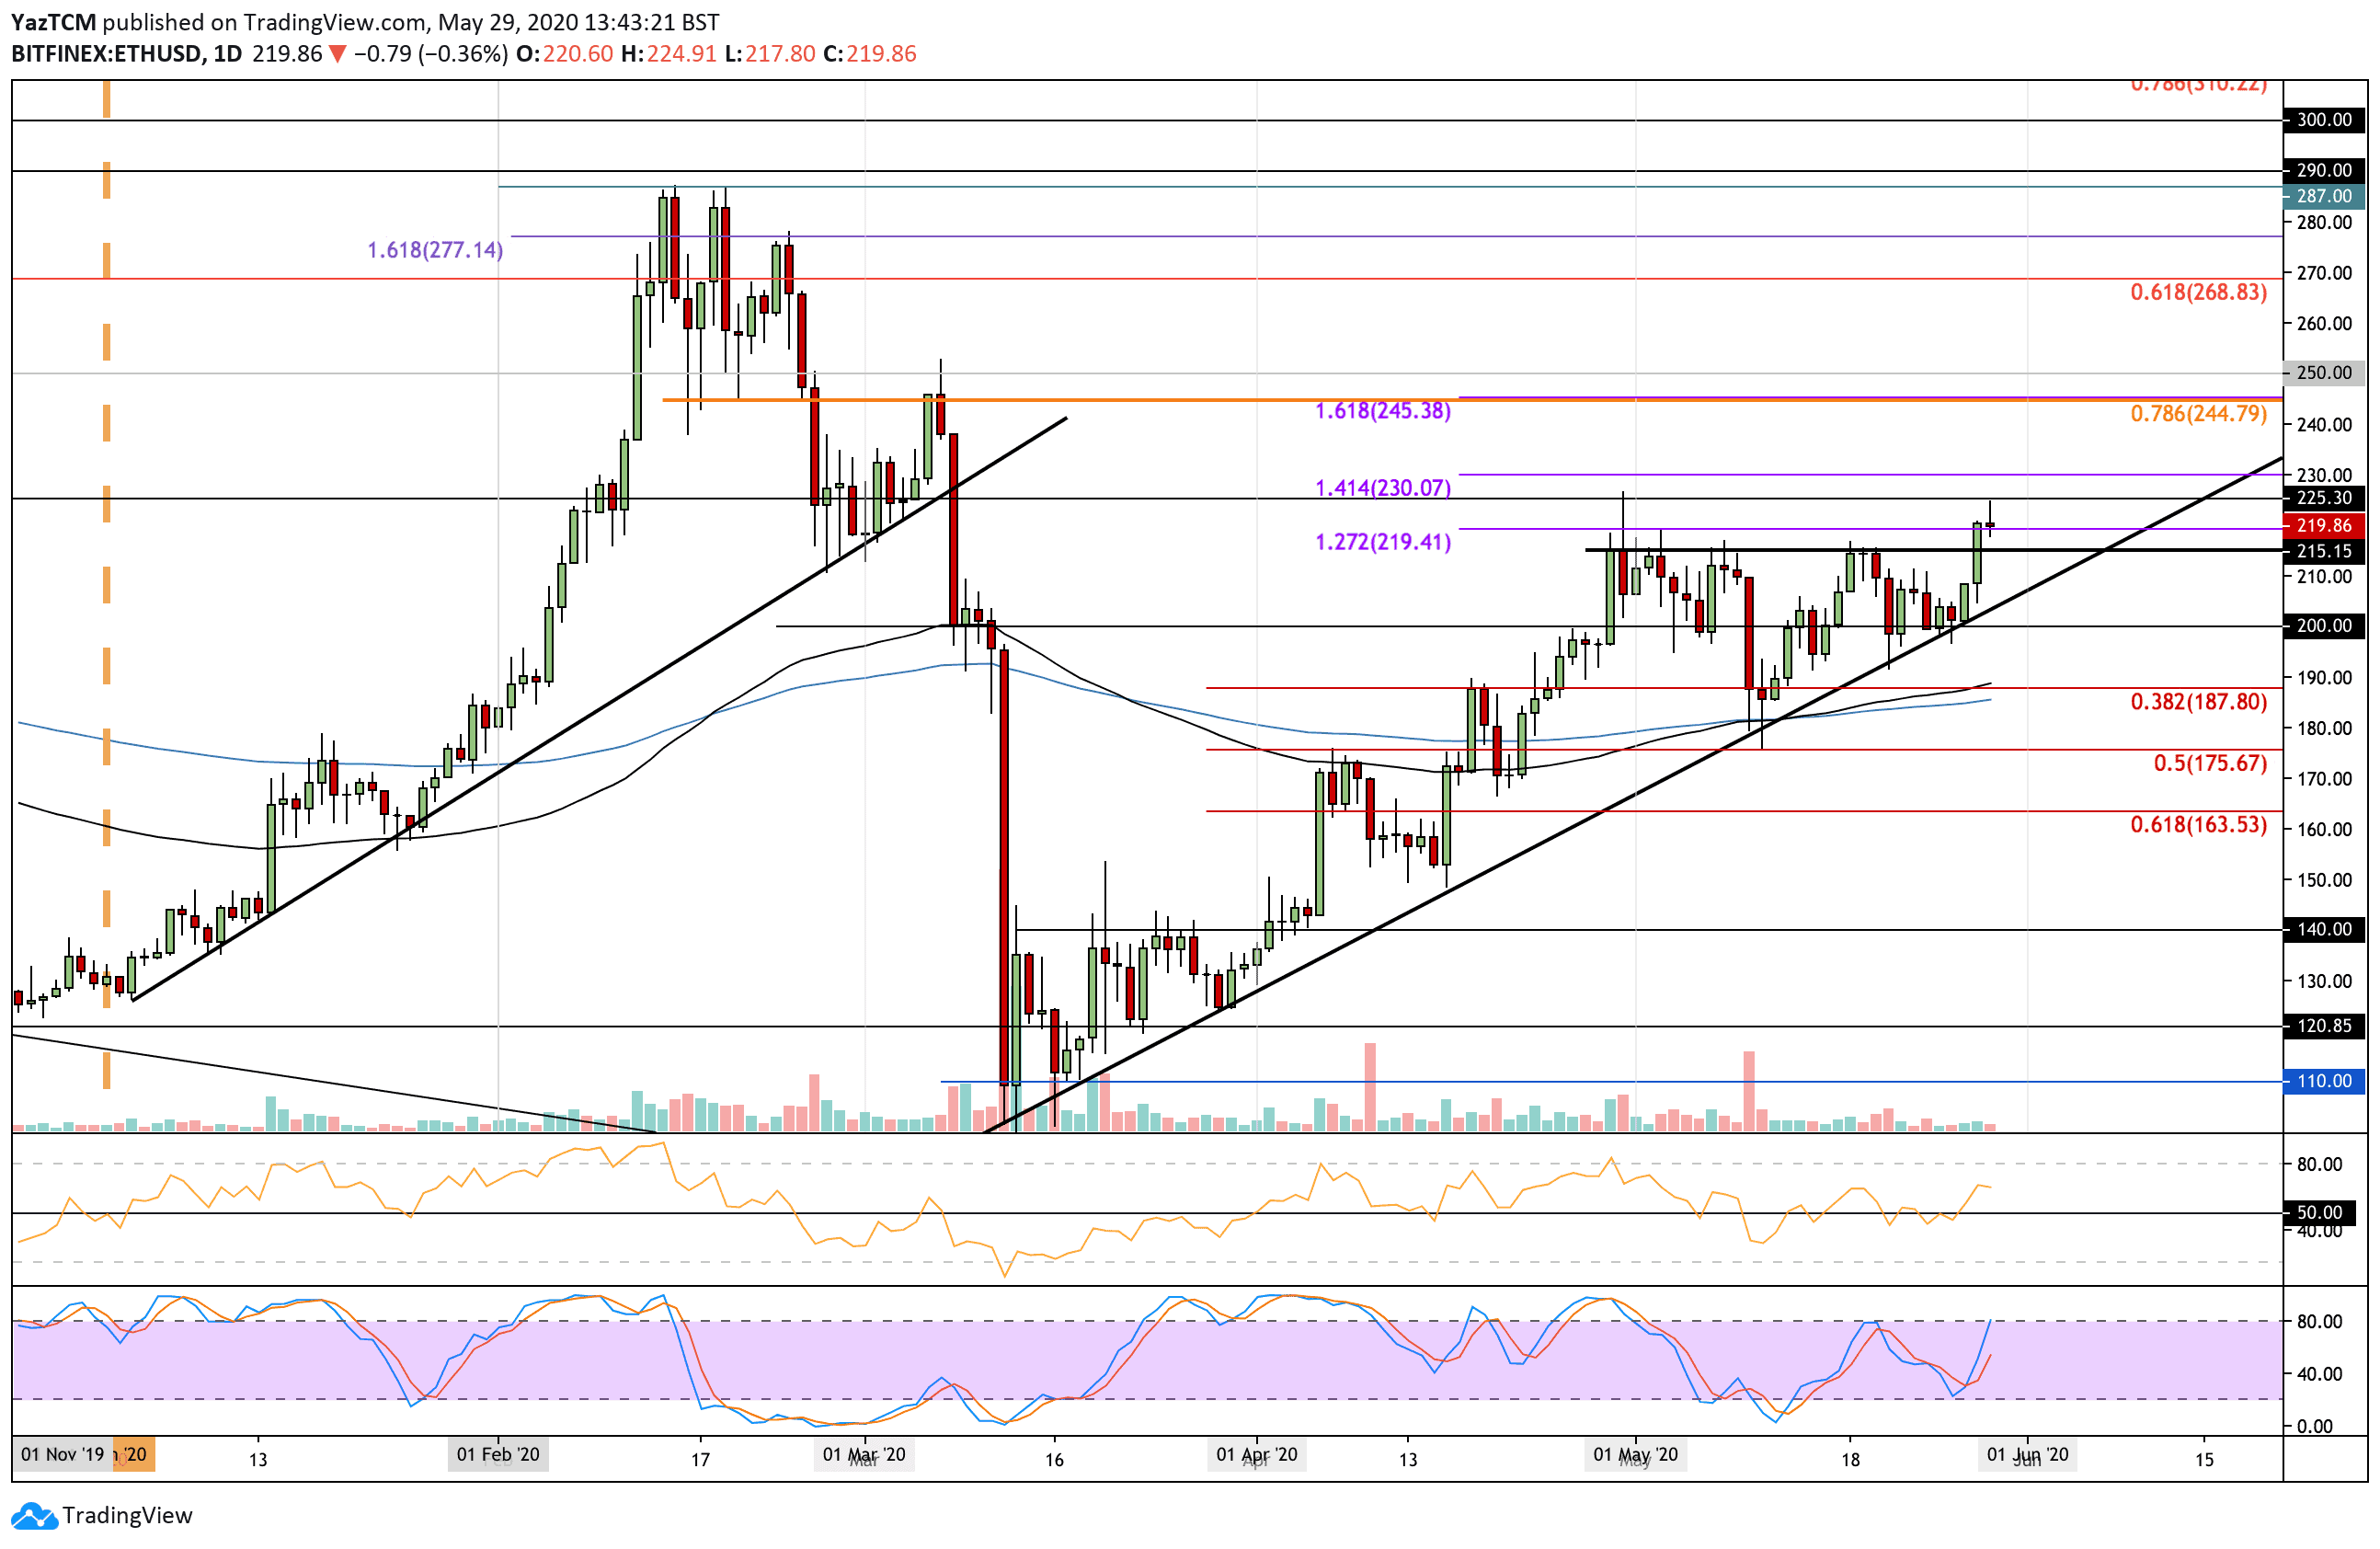
Ethereum saw a larger 7.5% price increase this week that has allowed the coin to break above the ascending triangle pattern that it was trading within. The coin started the week by dropping from $210 to $200. The $200 level support held for three days as it moved sideways into the lower boundary of the triangle.
Ethereum then went on to rebound from there as it pushed higher over the past few days. It managed to break the upper boundary of the triangle at $215 as it continued to push above $220 and reach the $225 resistance. ETH has since dropped as it trades at $219.
Moving forward, if the buyers continue to drive ETH higher, the first level of resistance lies at $225. Above this, resistance is located at $230 (1.414 Fib Extension), $245 (bearish .786 Fib Retracement), and $250. Beyond $250, added resistance is found at $260 and $270.
On the other side, if the sellers push beneath $219, support can be found at $215 and $210. Beneath this, added support lies at the rising trend line and $200.
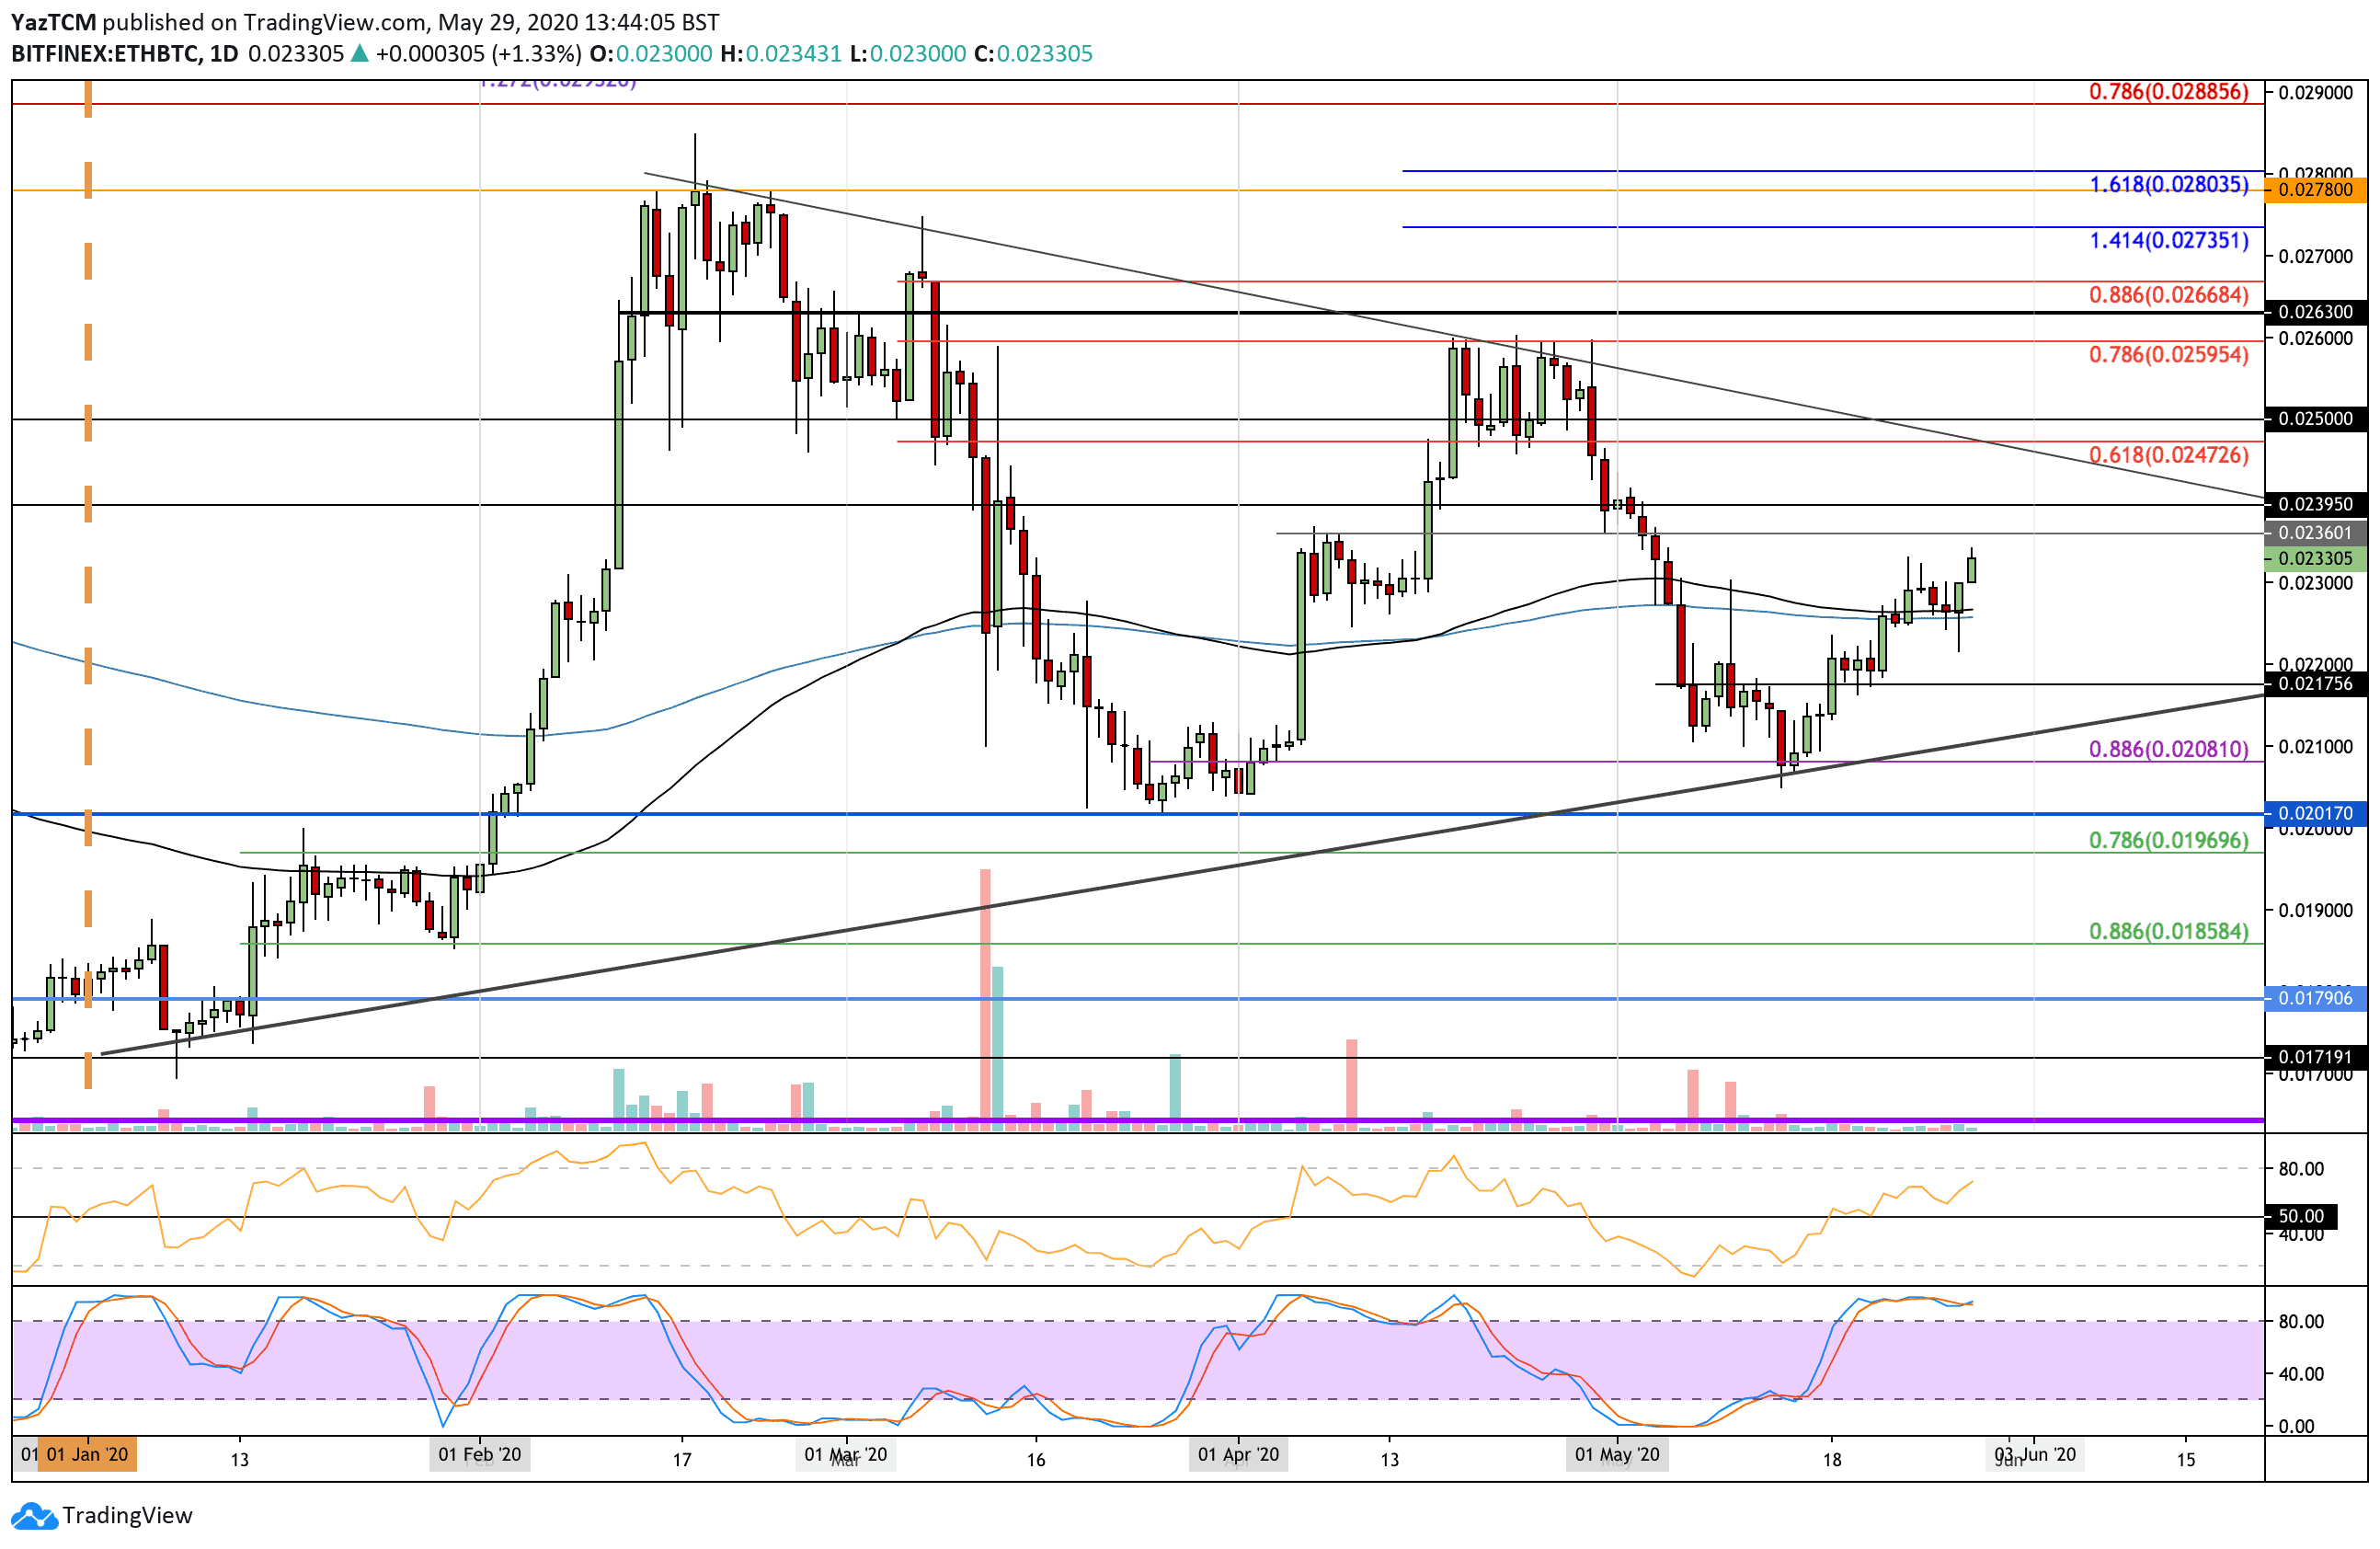
Against Bitcoin, ETH has also been climbing ever since rebounding from the 0.0208 BTC level earlier in the week. The coin was trading at resistance at the 200-days EMA level at the start of the week. It pushed higher but eventually returned to the 200-days EMA yesterday.
The bulls regrouped and pushed ETH higher from there as it broke the 0.023 BTC resistance to reach the current trading level at 0.0233 BTC.
Looking ahead, if the buyers push higher, the first level of resistance lies at 0.0236 BTC. Above this, resistance is expected at 0.0239 BTC, 0.024 BTC, and then at the falling trend line. Above this trend line, added resistance is located at 0.0247 BTC and 0.025 BTC.
On the other side, the first level of support lies at 0.023 BTC. Beneath this, support can be found at 0.0226 BTC, 0.022 BTC, and 0.0217 BTC.
Ripple
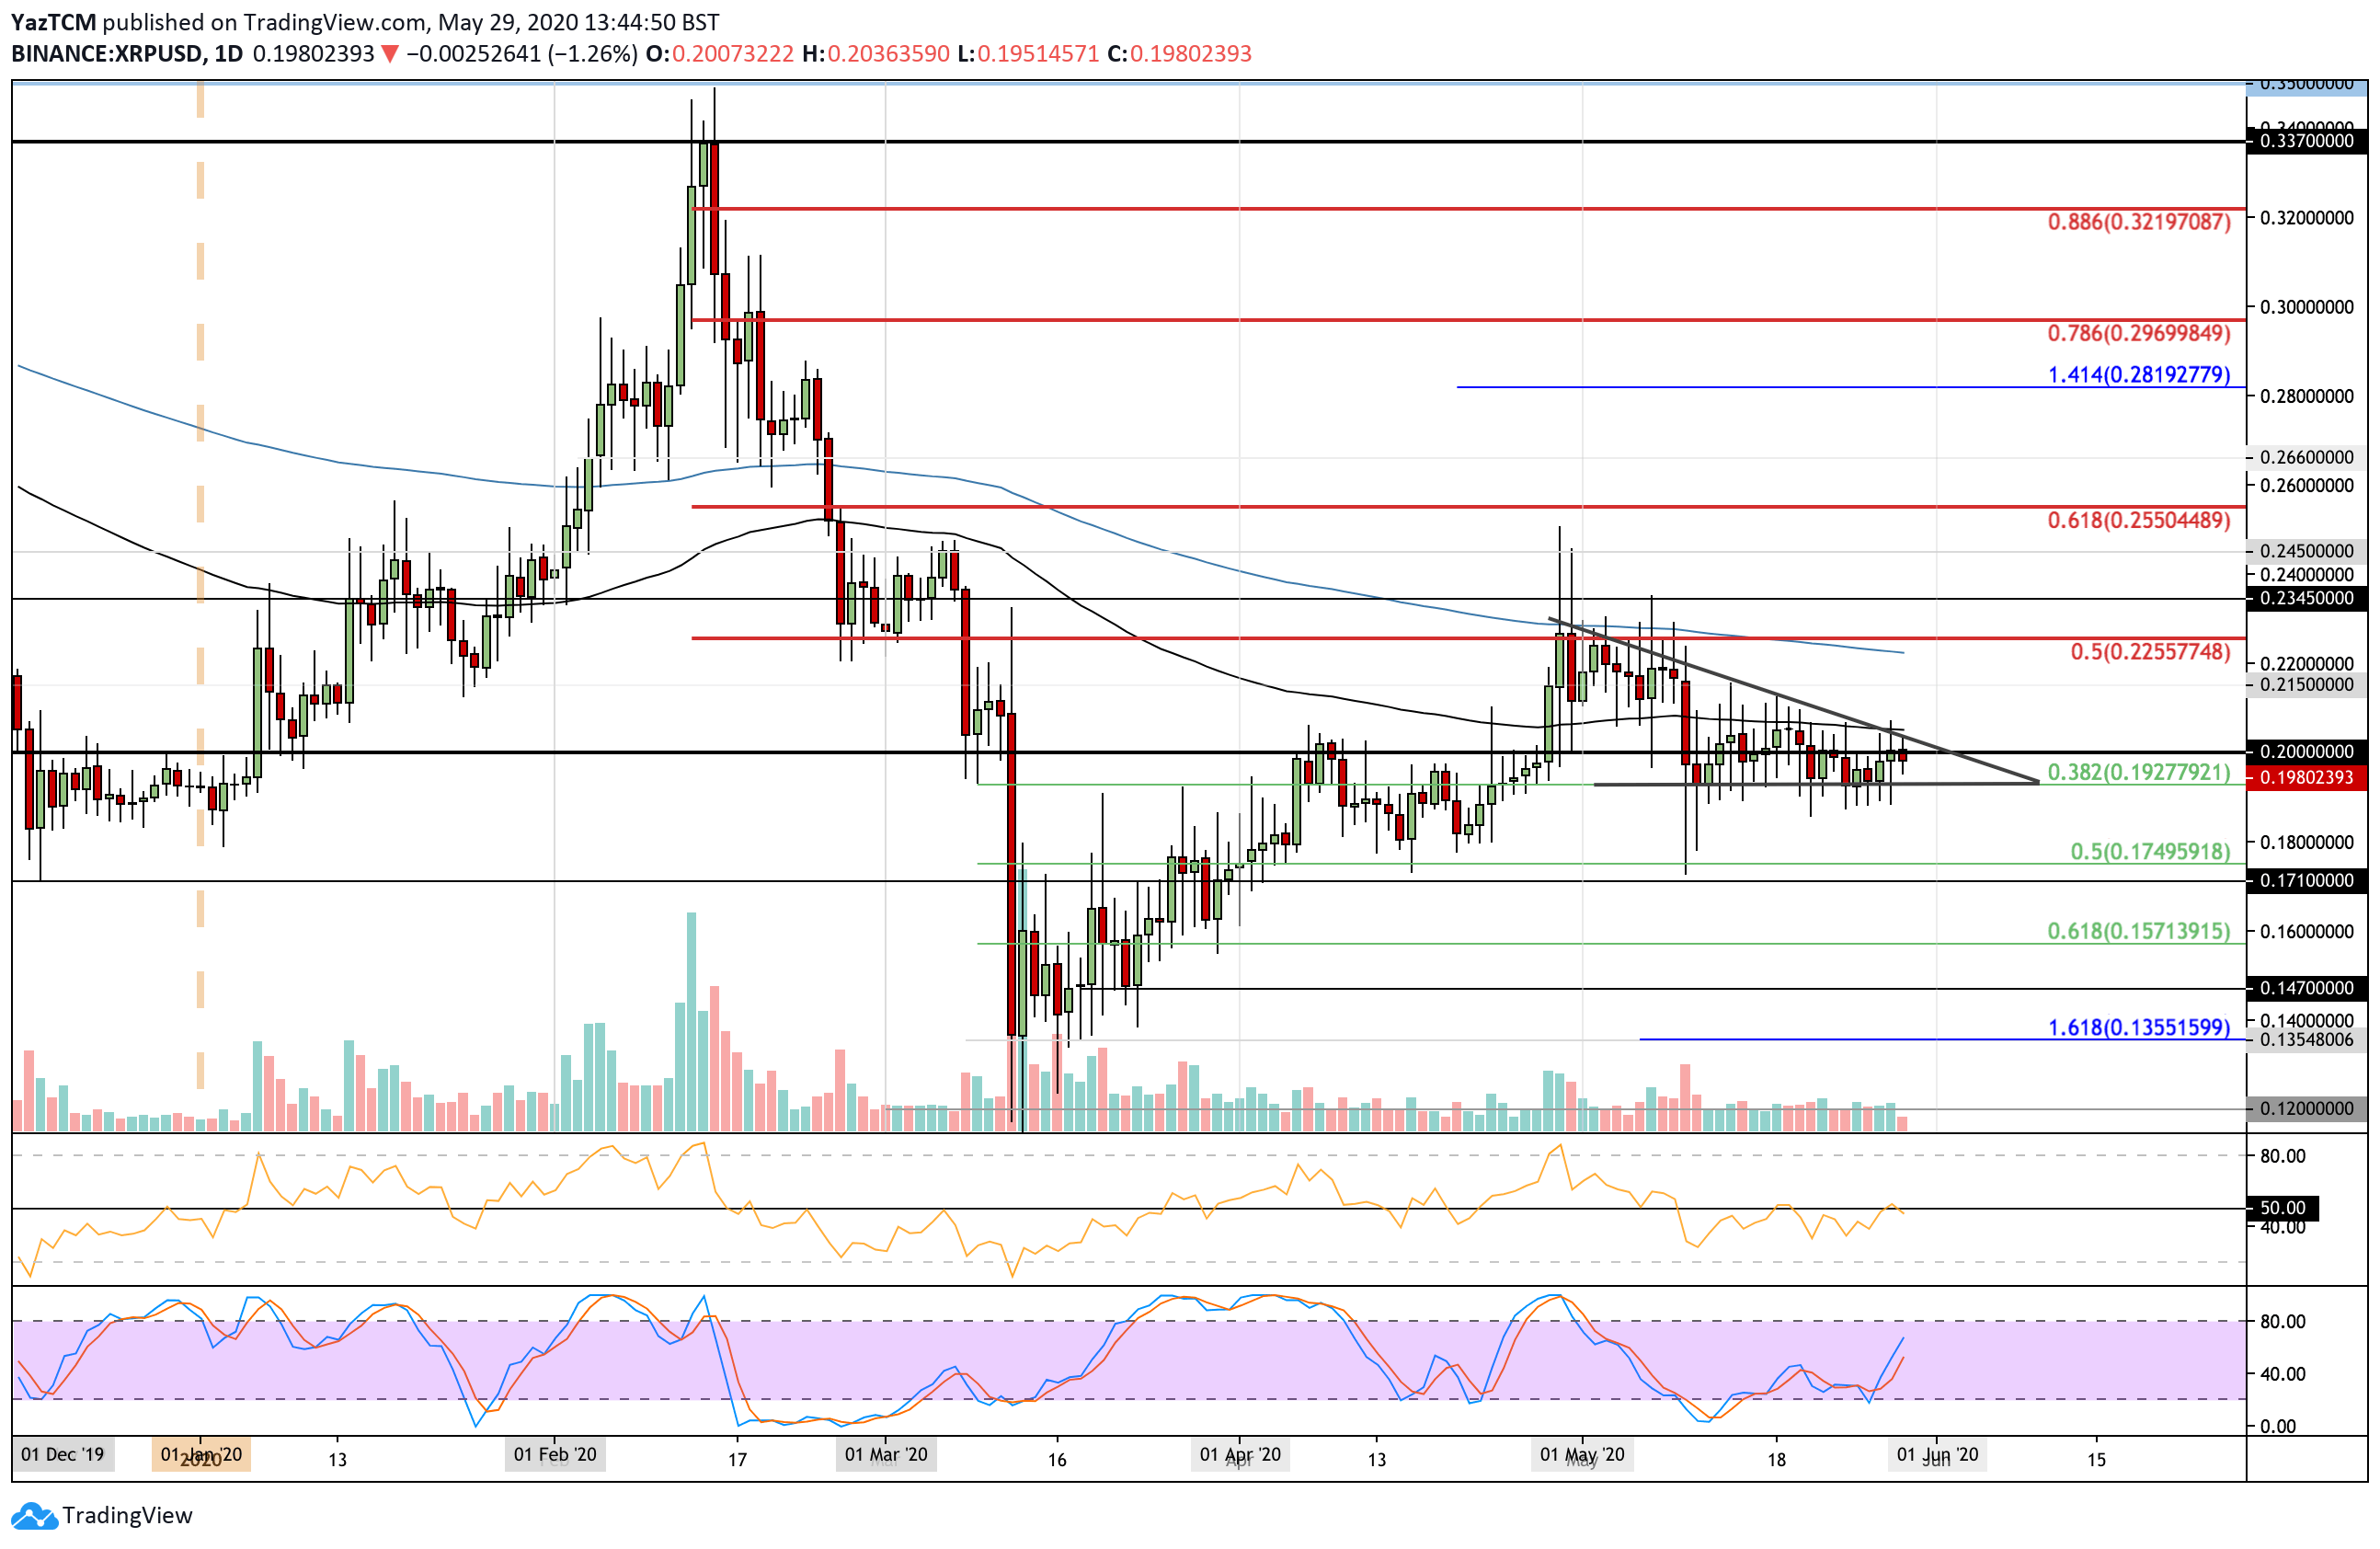
The boring XRP sideways movement continued this week after the cryptocurrency dropped by a small 1%. It is still trading beneath the $0.2 level as it struggles to make any ground above there during the week. It is also trapped within an acute descending triangle formation as it moves sideways toward the apex.
The lower boundary of the triangle is providing substantial support for XRP at $0.192, but if it breaks beneath, this XRP could unwind toward $0.171.
Looking ahead, if the buyers can conquer the $0.2 level and push higher, immediate resistance lies at the upper boundary of the triangle at $0.0206. This is bolstered by the 100-days EMA. Above this, resistance is expected at $0.215, $0.22 (200-days EMA), and $0.225 (bearish .5 Fib Retracement).
On the other side, if the sellers push lower, the first level of support is expected at the lower boundary of the triangle at $0.192, which is provided by a .382 Fib Retracement. Beneath $0.19, support lies at $0.18, $0.175 (.5 Fib Retracement), and $0.171.
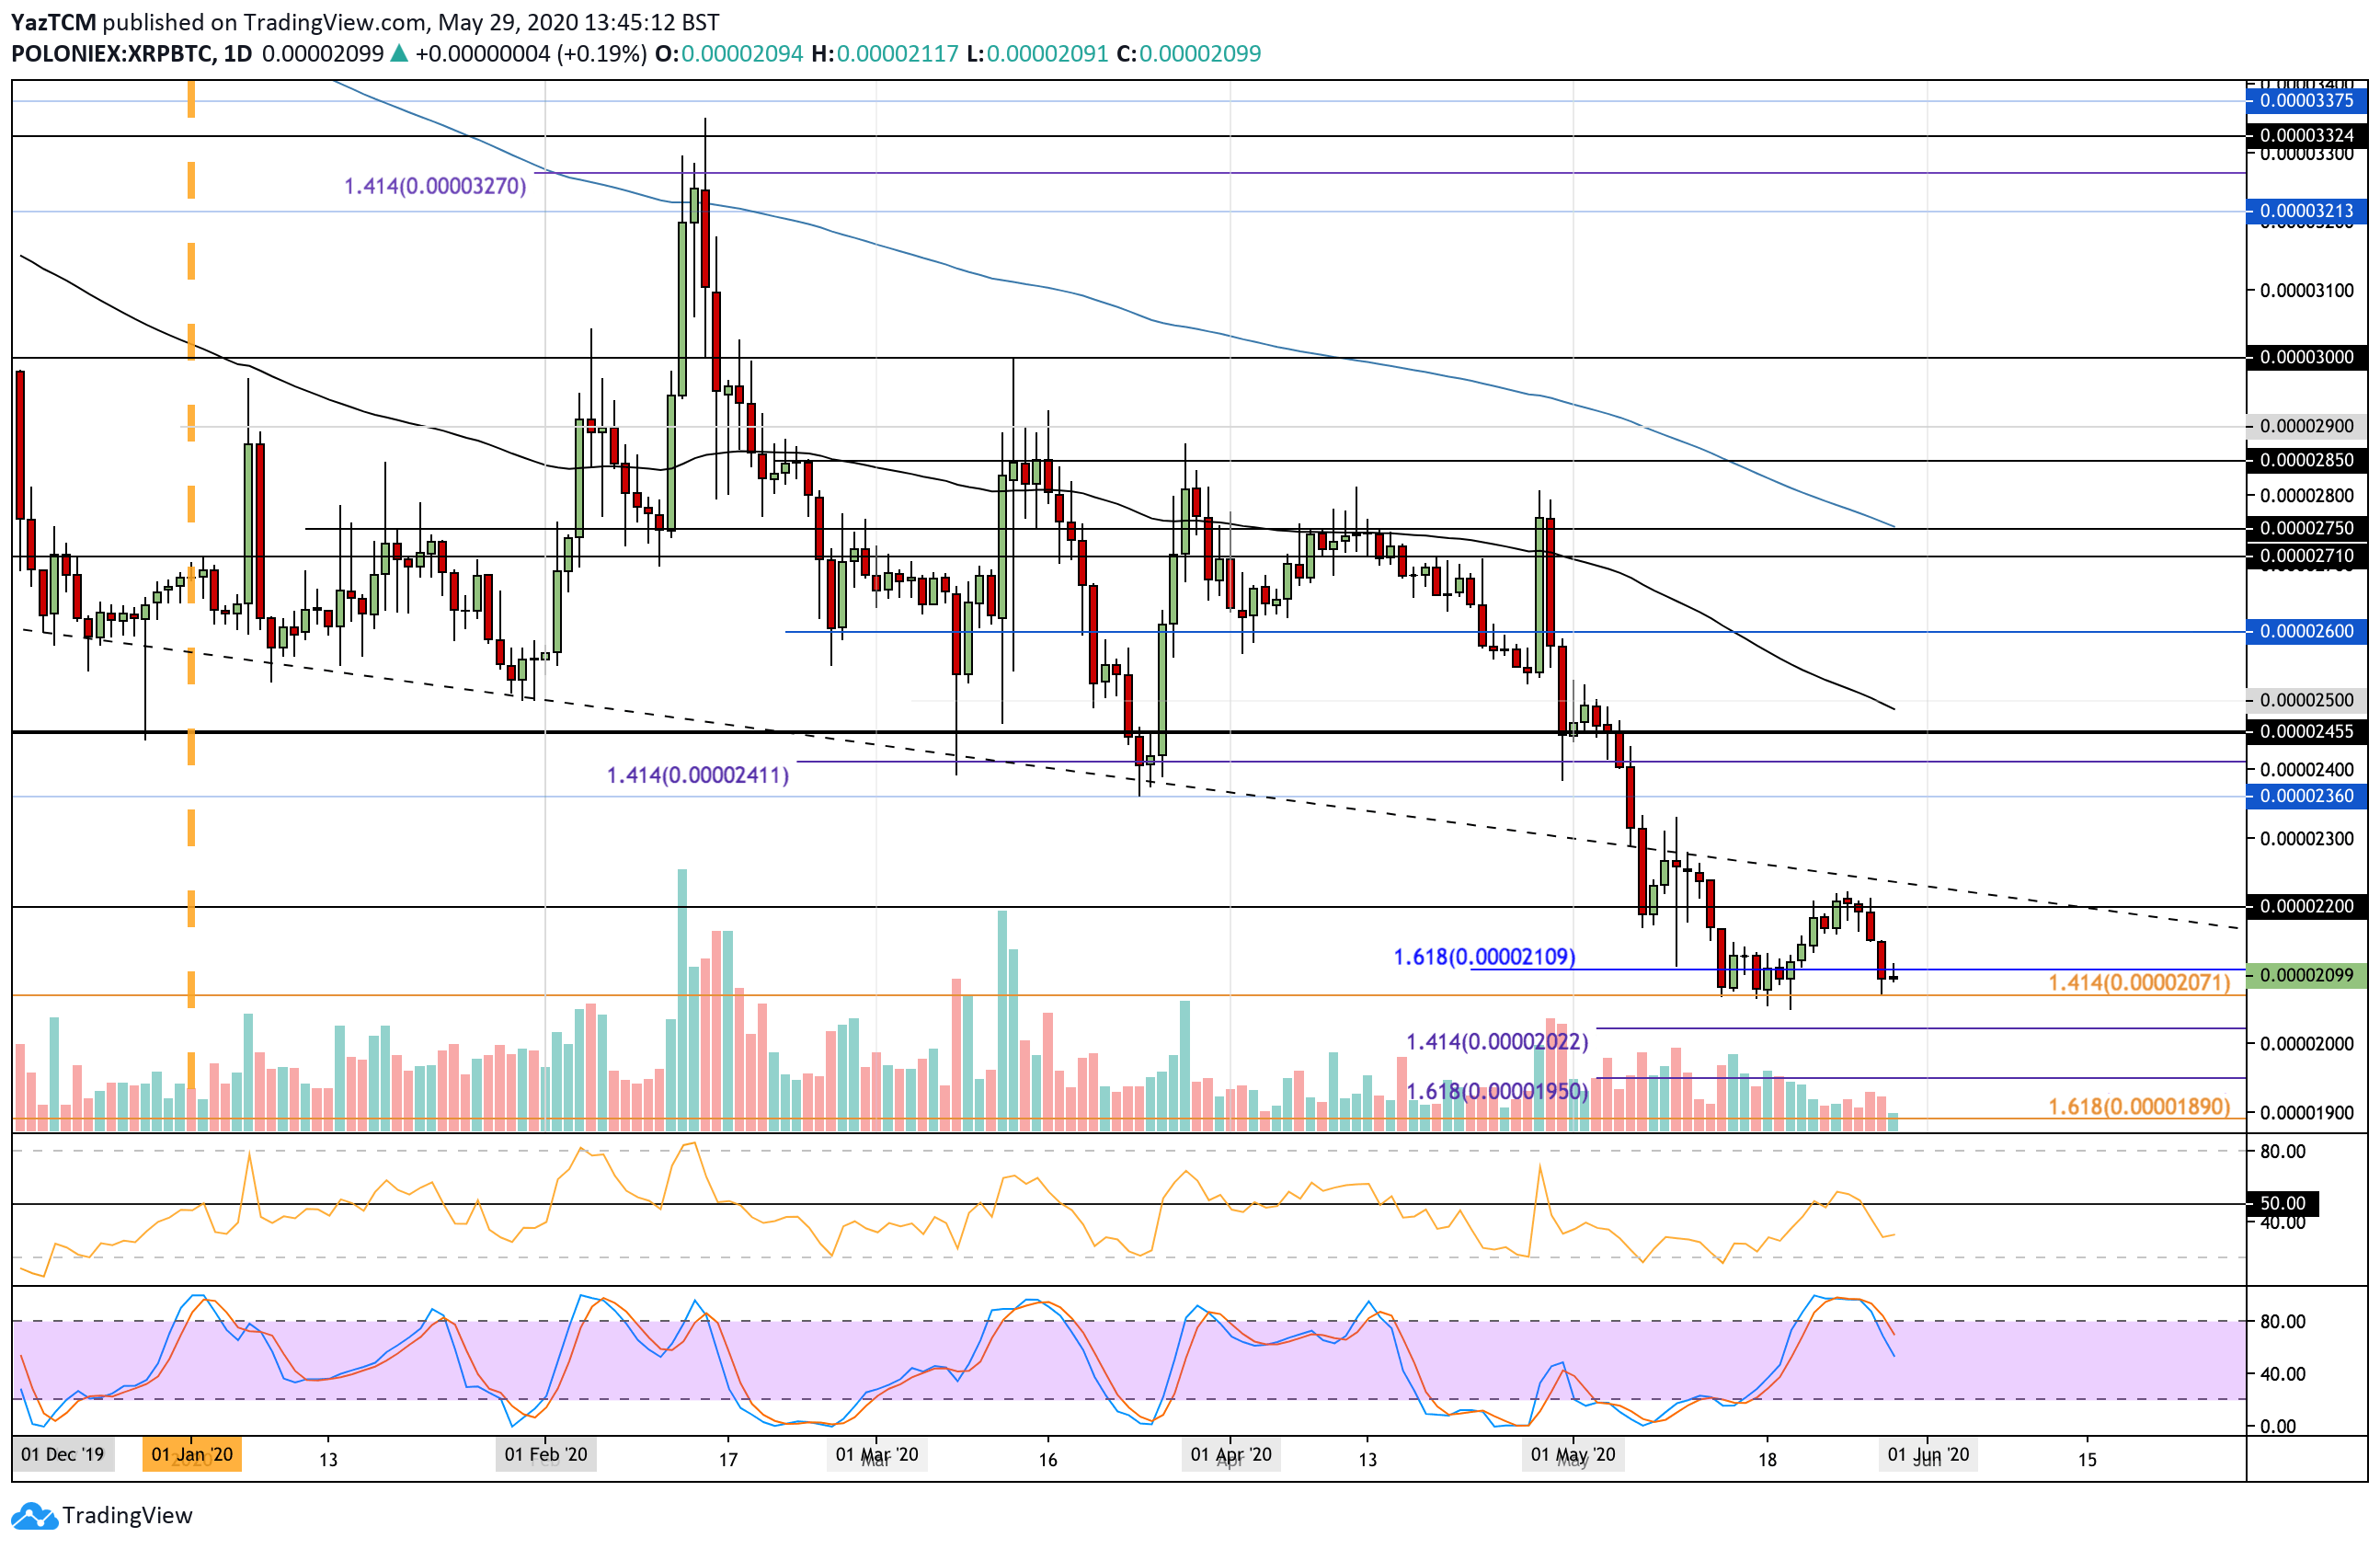
Against Bitcoin, XRP continues to struggle as it re-approaches the multi-year low at 2071 SAT this week. The coin had reached the 2200 SAT level at the start of the week but was unable to capitalize above here, which caused XRP to reverse and head lower.
Yesterday, it returned to the 2-year-old support at 2071 SAT as the buyers tried to defend it by pushing XRP back to 2100 SAT today.
Looking ahead, if 2071 SAT breaks, added support could be found at 2050 SAT, 2022 SAT, and 2000 SAT. Beneath 2000 SAT, support lies at 1950 SAT and 1890 SAT.
Alternatively, if the 2071 SAT support holds and XRP rebounds, resistance lies at 2100 SAT, 2200 SAT, and 2250 SAT.
Tezos
Tezos saw a small 3% price increase over the last week of trading as the coin reached $2.83. XTZ was trading at the $2.82 resistance at the start of the week, which caused the coin to reverse and head lower until it reached support at the rising trend line.
It rebounded from there yesterday, which allowed it to reach the current $2.83 level. Tezos is trading within a short term symmetrical triangle pattern as it challenges its roof today.
Moving forward, if the buyers break above the upper boundary of this triangle, the first level of resistance is expected at $3.00. Above this, resistance can be found at $3.14, $3.20, and $3.31 (bearish .786 Fib Retracement). Added resistance lies at $3.40, $3.50, $3.78, and $4.00.
On the other side, if the sellers push beneath $2.80, support lies at the rising trend line. Beneath the trend line, support can be found at $2.57 (.236 Fib Retracement), $2.40 (100-day EMA), and $2.27 (.382 Fib Retracement).

Against Bitcoin, Tezos has been trading sideways this past week as it struggles to break the resistance at 31,000 SAT. It dropped as low as 28,800 SAT during the week but managed to rebound and climb back above 30,000 SAT, where it currently trades.
Looking ahead, the first level of resistance is expected at 30,500 SAT (bearish .382 Fib Retracement). Above this, resistance lies at 32,000 SAT, 33,370 SAT (bearish .618 Fib Retracement), and 34,000 SAT.
On the other side, if the sellers push back beneath 30,000 SAT, the first level of strong support lies at 28,400 SAT (100-days EMA). Beneath this, support lies at 28,000 SAT, 27,000 SAT, and 25,900 SAT.

Chainlink
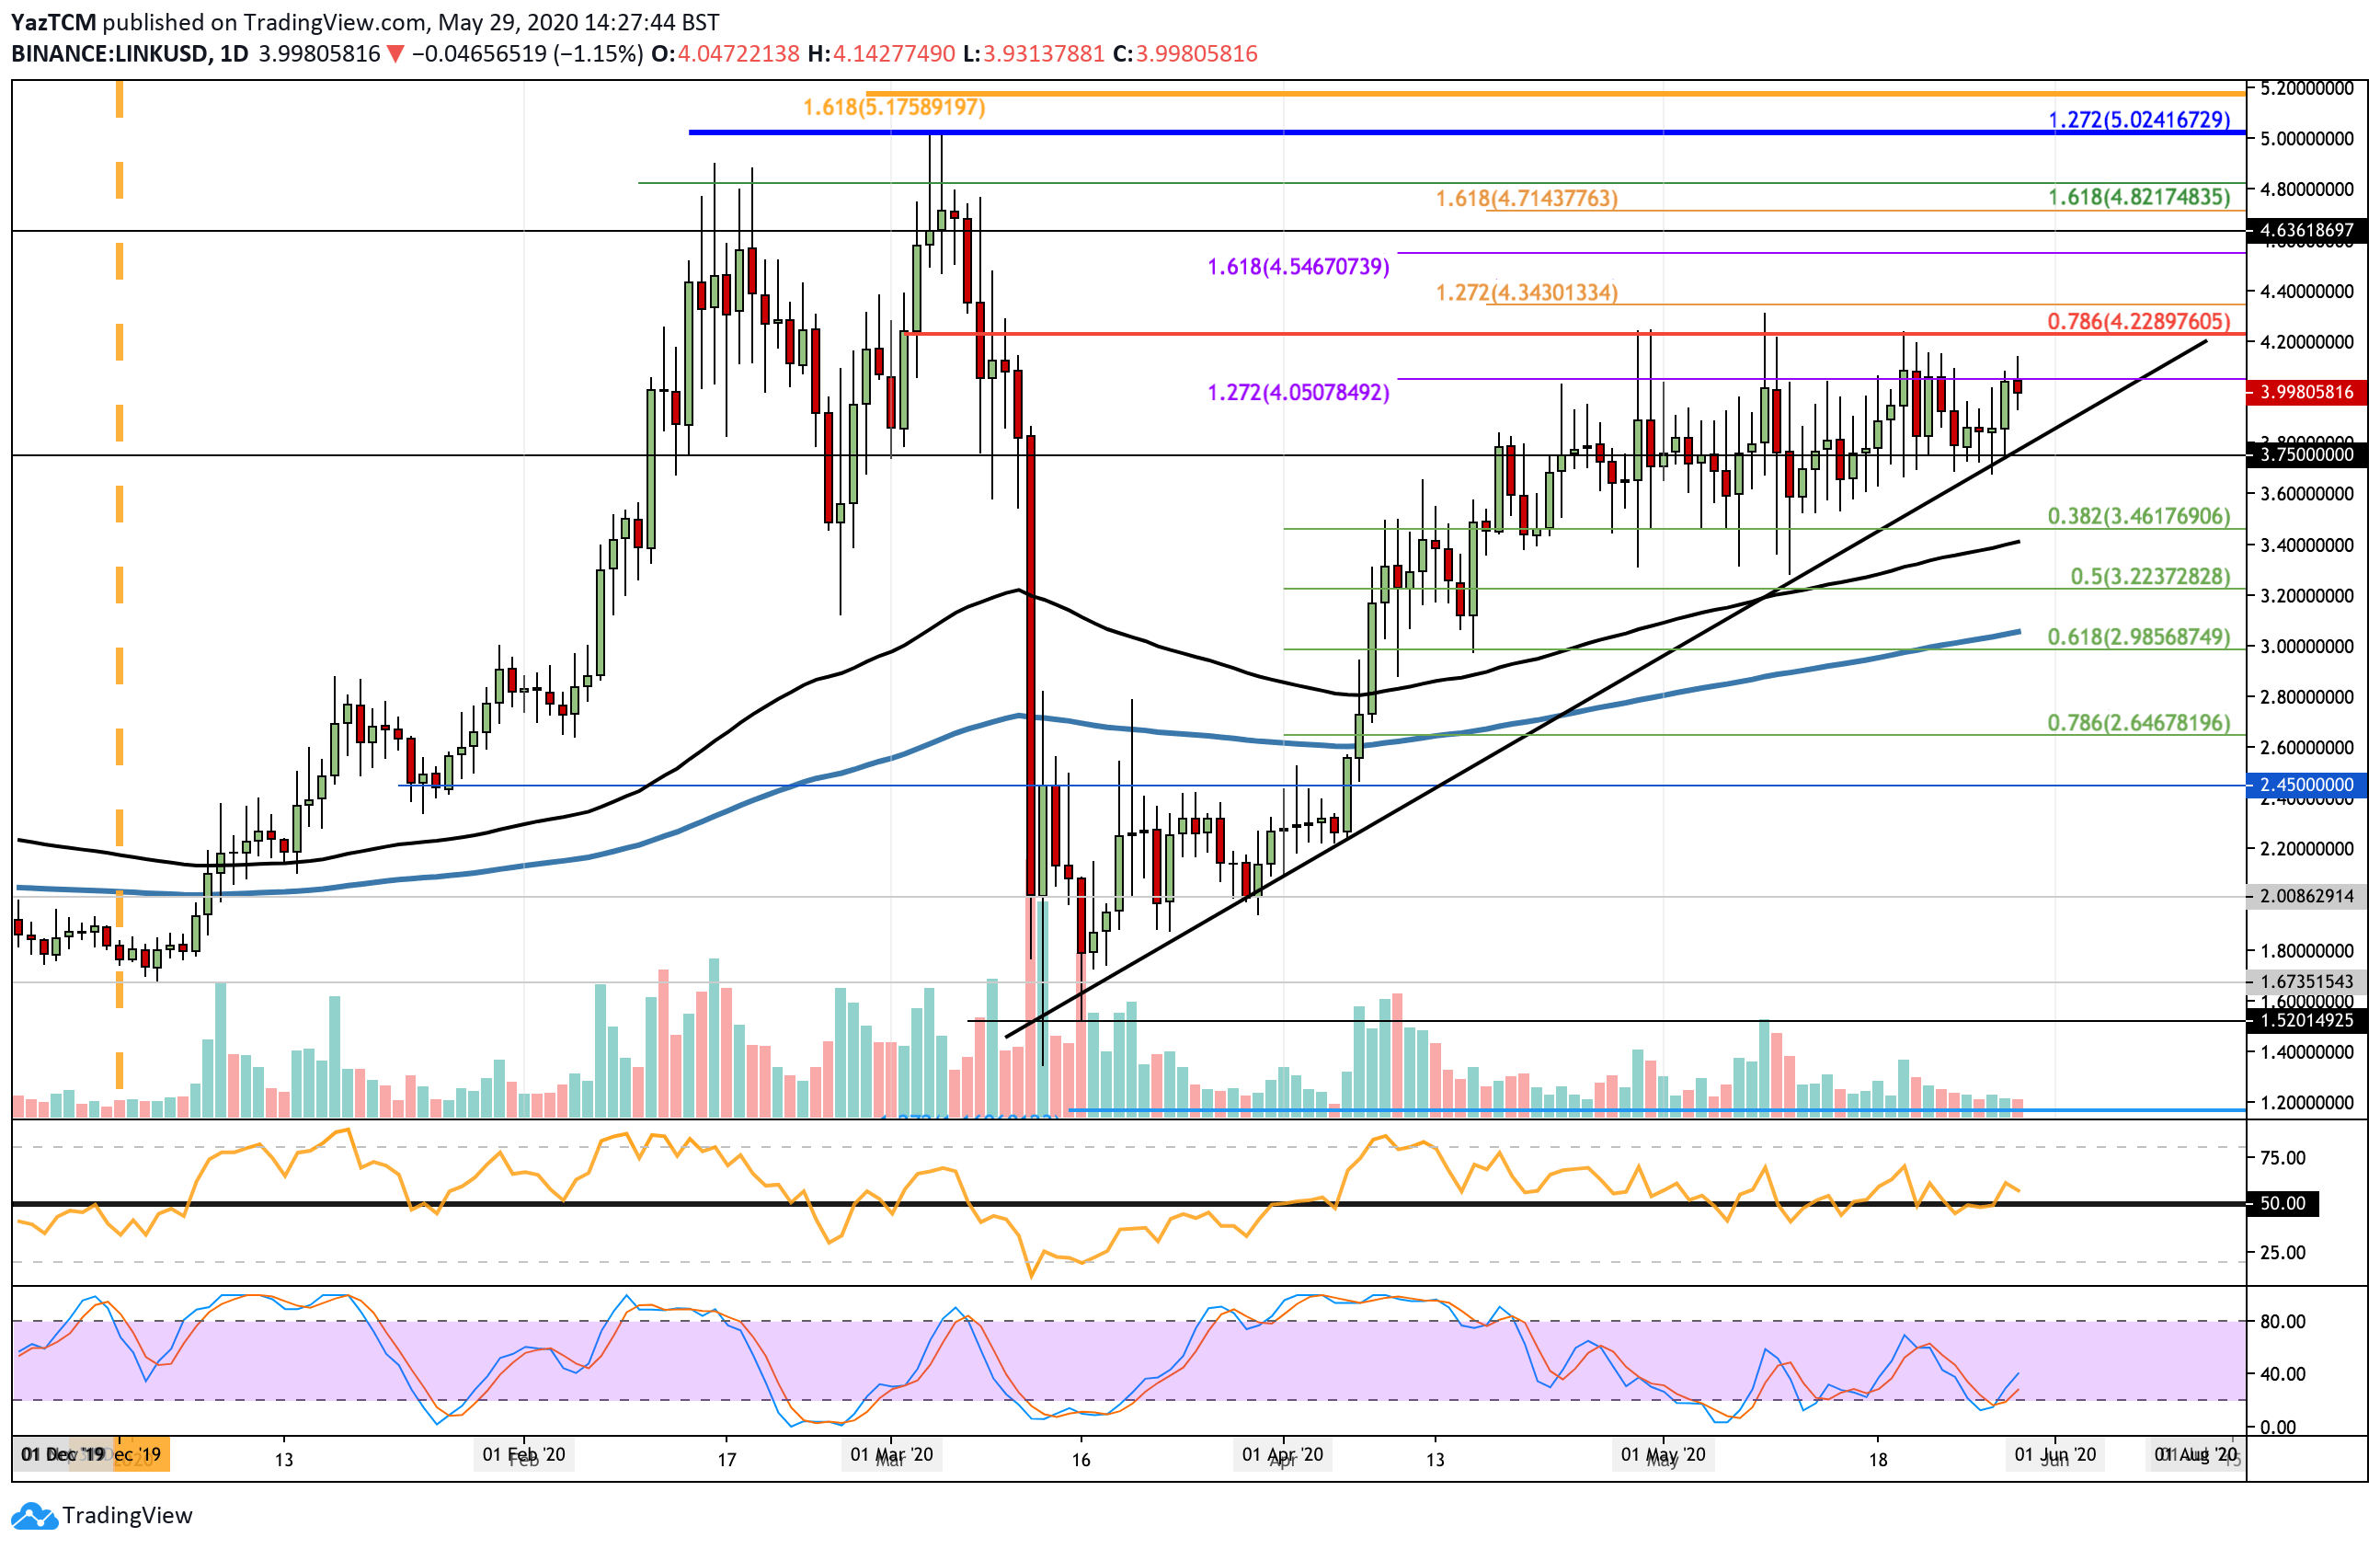
Chainlink also moved sideways throughout the entire week as it continues to struggle to close above $4.00. During the week, it dropped lower into the $3.75 level, where it found support at a rising trend line. It rebounded from there yesterday, which allowed XTZ to reach the current $4.00 level.
Moving forward, if the buyers can break above $4.00, the first level of resistance lies at $4.22 (bearish .786 Fib Retracement). Above this, resistance is located at $4.34, $4.54 (1.618 Fib Extension), and $4.65.
On the other side, if the sellers push lower, the first level of support lies at the rising trend line. Beneath this, support is found at $3.75, $3.60, $3.46 (.382 Fib Retracement & 100-days EMA), and $3.22 (.5 Fib Retracement).
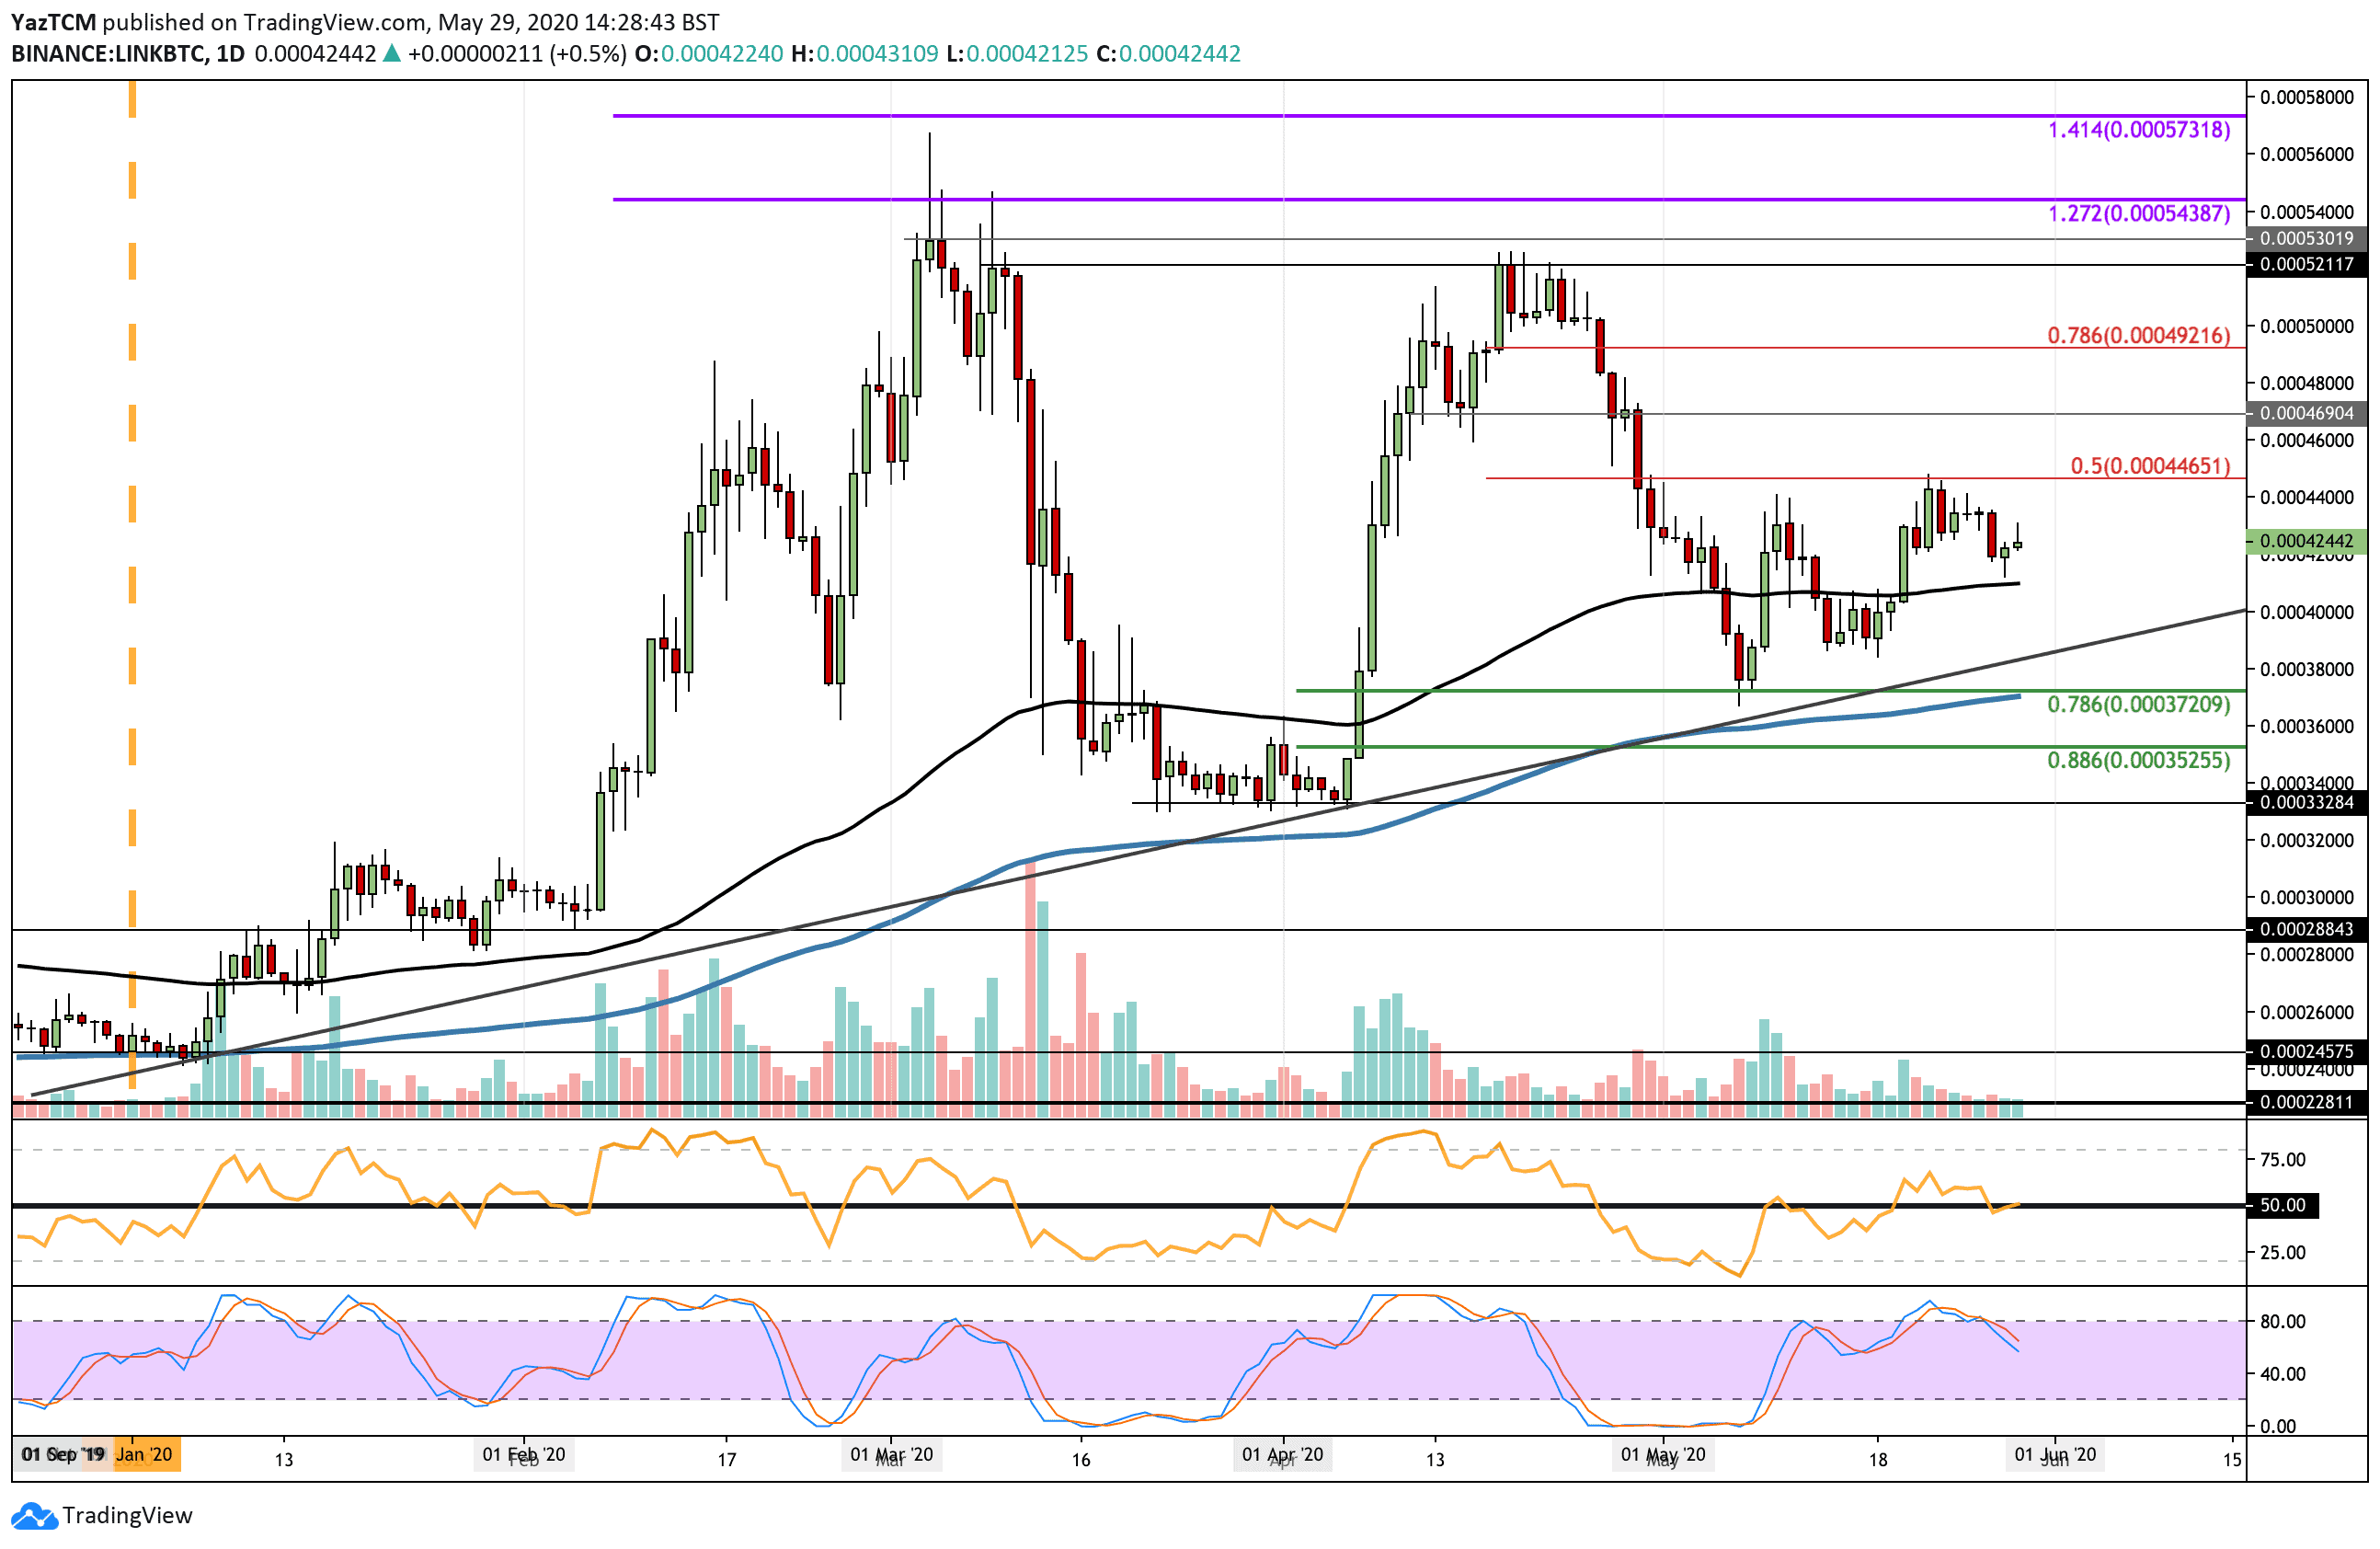
Against Bitcoin, Chainlink dropped from the 44,650 SAT resistance at the start of the week, which is provided by a bearish .5 Fib Retracement. Throughout the week, it dropped as low as 41,200 SAT before bouncing and reaching the current 42,360 SAT level.
Looking ahead, if the buyers push higher, the resistance at 44,650 SAT will be the first level to break. Above this, resistance lies at 46,000 SAT, 47,000 SAT, and 48,000 SAT. Added resistance then lies at 49,200 SAT (bearish .786 Fib Retracement), and 50,000 SAT.
Toward the downside, the first level of support can be found at 41,000 SAT (100-days EMA). Beneath this, support lies at 40,000 SAT, and the rising trend line. If the sellers break the trend line, added support is expected at 38,000 SAT and 37,200 SAT (.786 Fib Retracement & 200-days EMA).