Bitcoin dropped by a total of 11% over the past week as the cryptocurrency broke beneath previous support at ,550 and plummetted beneath support at ,000. It continued to decline until reaching the current support at the 200-days EMA, which is bolstered by the .5 Fib Retracement at around ,600. The momentum is certainly on the bearish side, and we should continue to expect further declines this week within the market. Once the rising trend line is broken, support is found at the downside 1.618 Fibonacci Extension level priced at ,550. This is followed by support at ,400, ,250, and ,200 (.618 Fib Retracement). If it continues beneath this, added support lies at ,100 (downside 1.272 Fib Extension), ,000, and ,900.Toward the upside, resistance lies at ,800 and ,000.
Topics:
Yaz Sheikh considers the following as important: Bitcoin (BTC) Price, Bitcoin Cash (BCH) Price, Chainlink (LINK) Price Analysis, Ethereum (ETH) Price, Market Updates, Price Analysis, Ripple (XRP) Price
This could be interesting, too:
Mandy Williams writes Bitcoin ETFs Record Over .6B in Outflows in the Past 2 Weeks
Chayanika Deka writes Bitcoin Whales Offload 6,813 BTC as Selling Pressure Mounts
Wayne Jones writes Bitcoin Sentiment Hits 2022 Lows as Fear & Greed Index Falls to 10
Jordan Lyanchev writes Bitcoin Falls Below K for the First Time in 3 Months, How Much Lower Can It Go?
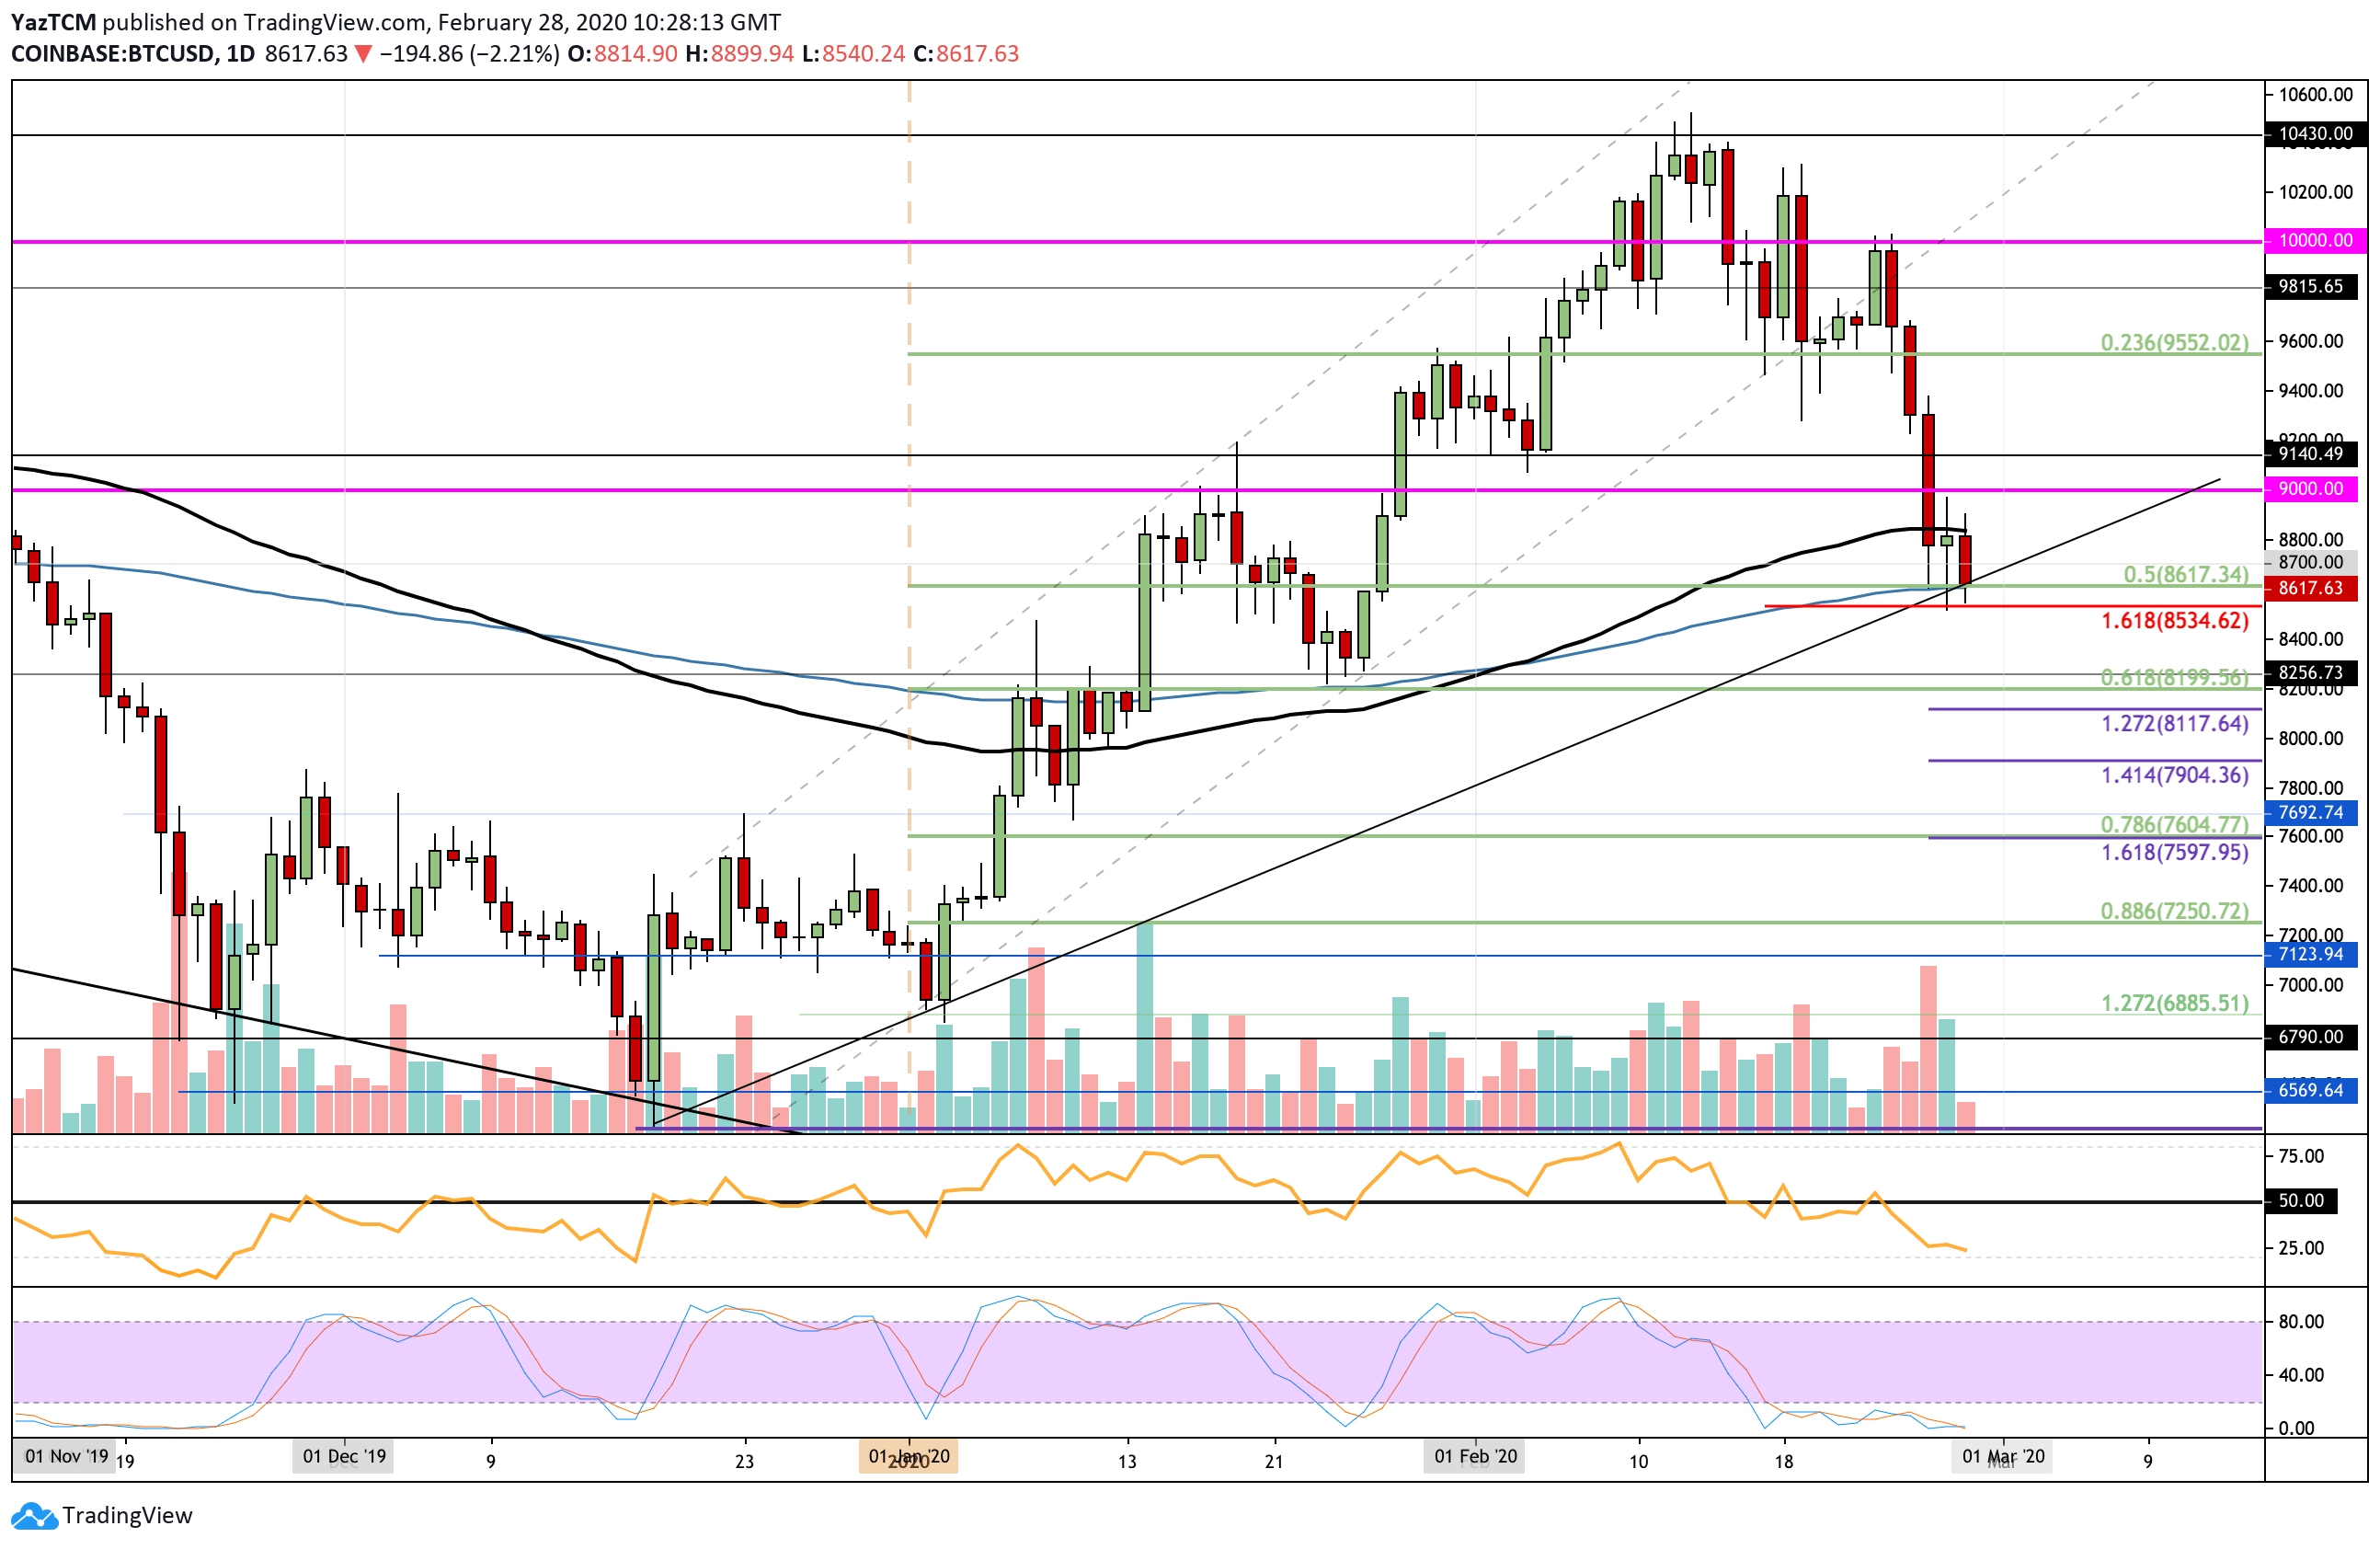
Bitcoin dropped by a total of 11% over the past week as the cryptocurrency broke beneath previous support at $9,550 and plummetted beneath support at $9,000. It continued to decline until reaching the current support at the 200-days EMA, which is bolstered by the .5 Fib Retracement at around $8,600. The momentum is certainly on the bearish side, and we should continue to expect further declines this week within the market.
Once the rising trend line is broken, support is found at the downside 1.618 Fibonacci Extension level priced at $8,550. This is followed by support at $8,400, $8,250, and $8,200 (.618 Fib Retracement). If it continues beneath this, added support lies at $8,100 (downside 1.272 Fib Extension), $8,000, and $7,900.
Toward the upside, resistance lies at $8,800 and $9,000. Above $9,000, resistance lies at $9,150 and $9,400.
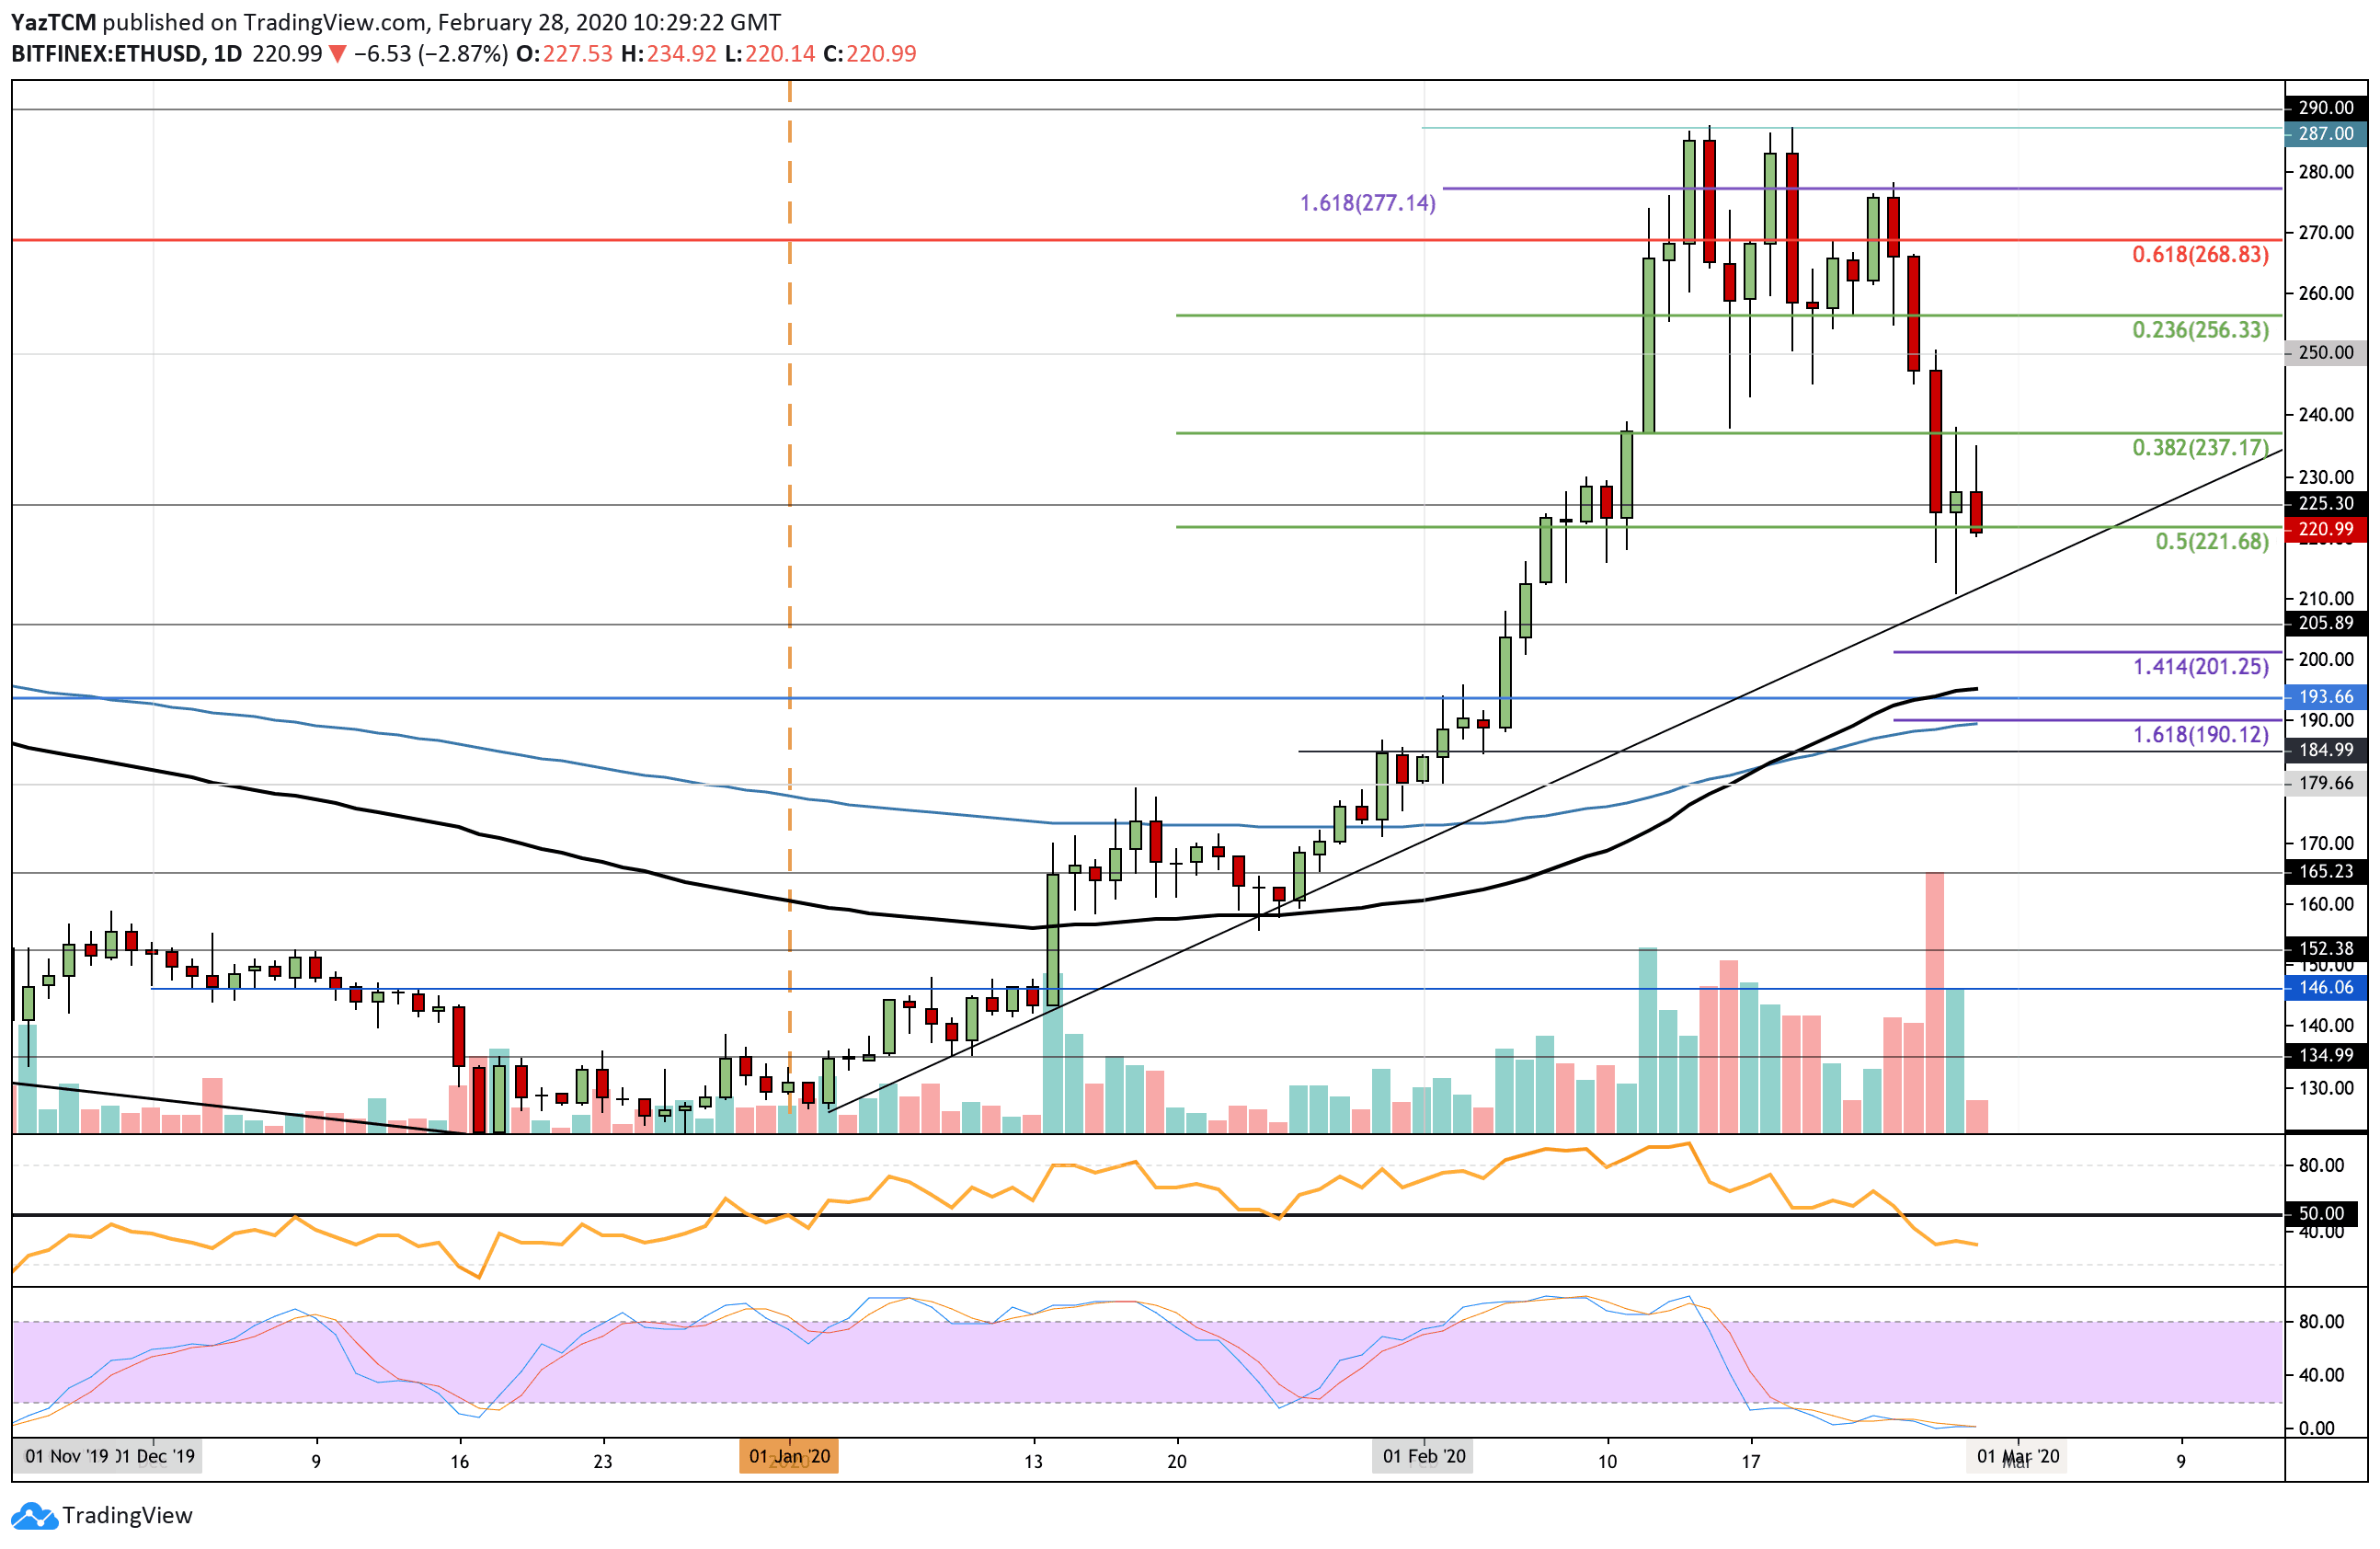
The Bitcoin price decline also caused a major downturn in Ethereum as it dropped by 16% this past week. The cryptocurrency broke beneath the $255 support as it continued to drop toward the current support at $220. Likewise, the momentum is within the bearish territory, and we could potentially see ETH reaching $200 over the following days.
If the sellers push lower, the first level of support lies at the rising trend line at around $210. This is followed by support at $205 and $200. If the bears push beneath $200, support lies at $195 (100-days EMA), $190 (200-days EMA), and $185.
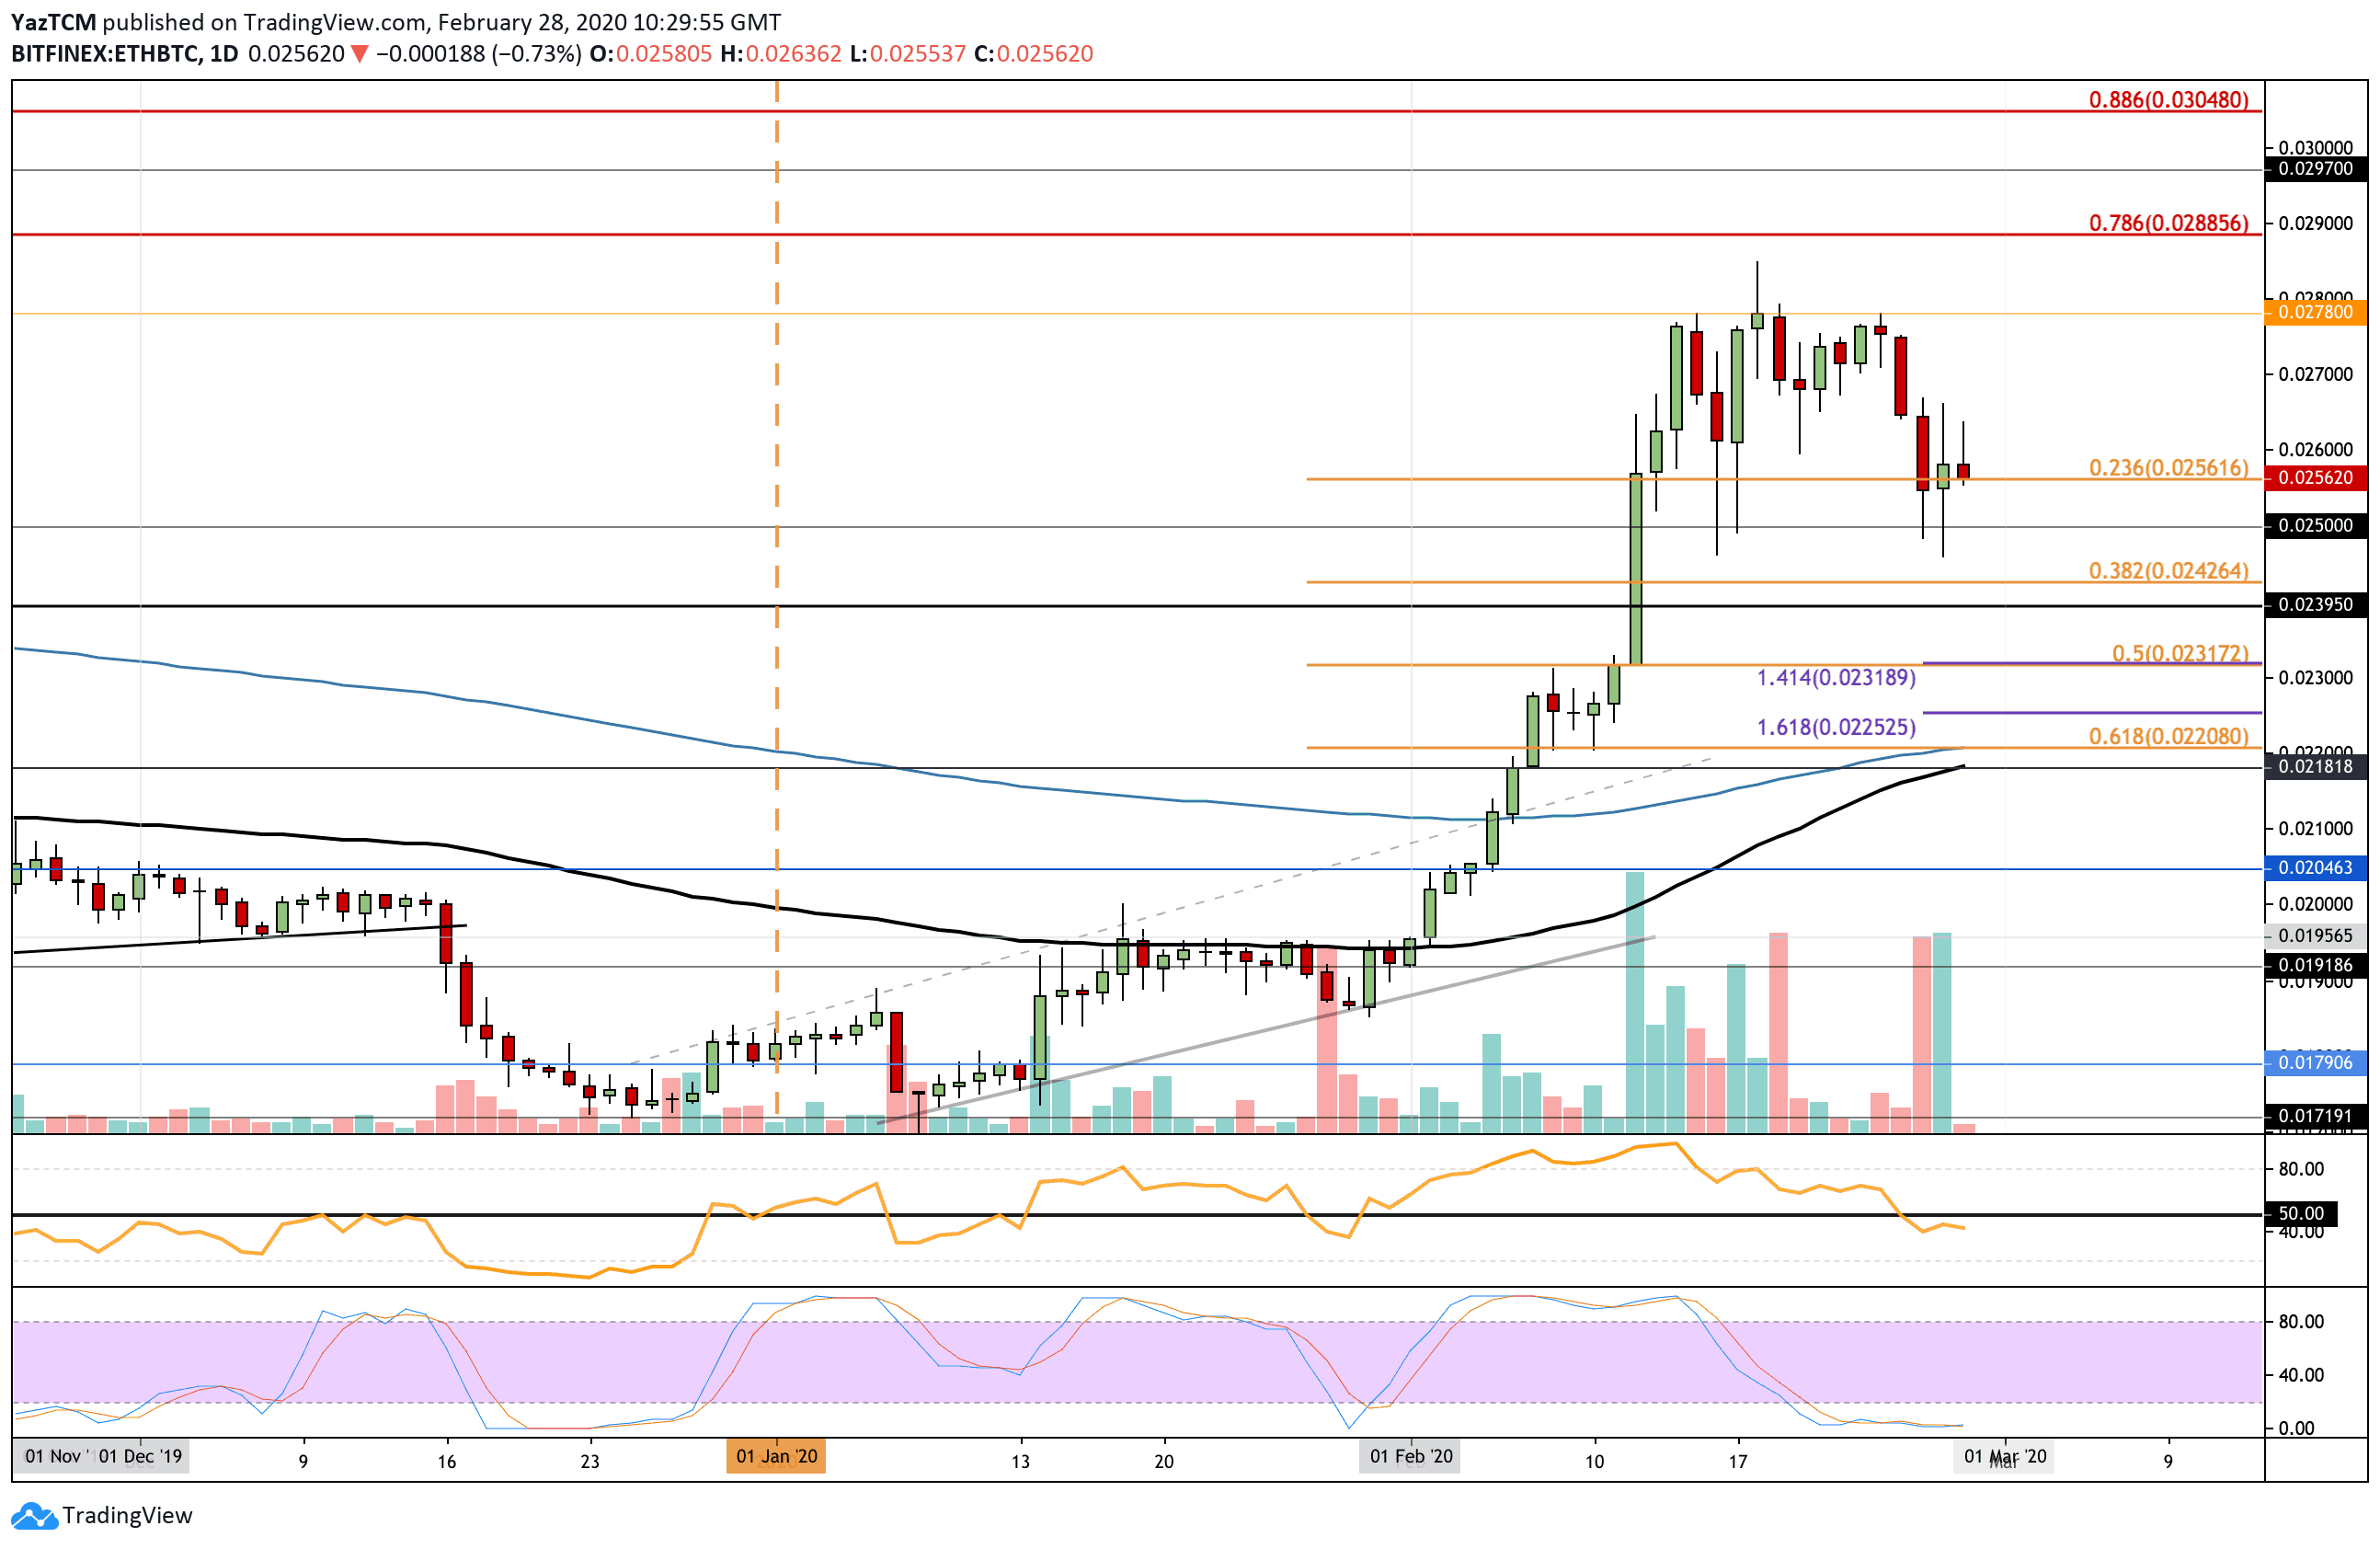
Against Bitcoin, ETH has held relatively well as it drops just by 8%; however, the momentum for the sellers is starting to increase. It has recently dropped into support at 0.0256 BTC, but it is looking likely that this will be broken.
Toward the downside, support lies at 0.025 BTC. This is followed by support at 0.0242 BTC (.382 Fib Retracement), 0.0239 BTC, and 0.0231 BTC (.5 Fib Retracement). Beyond this, additional support is located at 0.0225 BTC and 0.022 BTC (.618 Fib Retracement).
If the buyers do rebound and push above 0.026 BTC, resistance lies at 0.027 BTC and 0.0278 BTC.
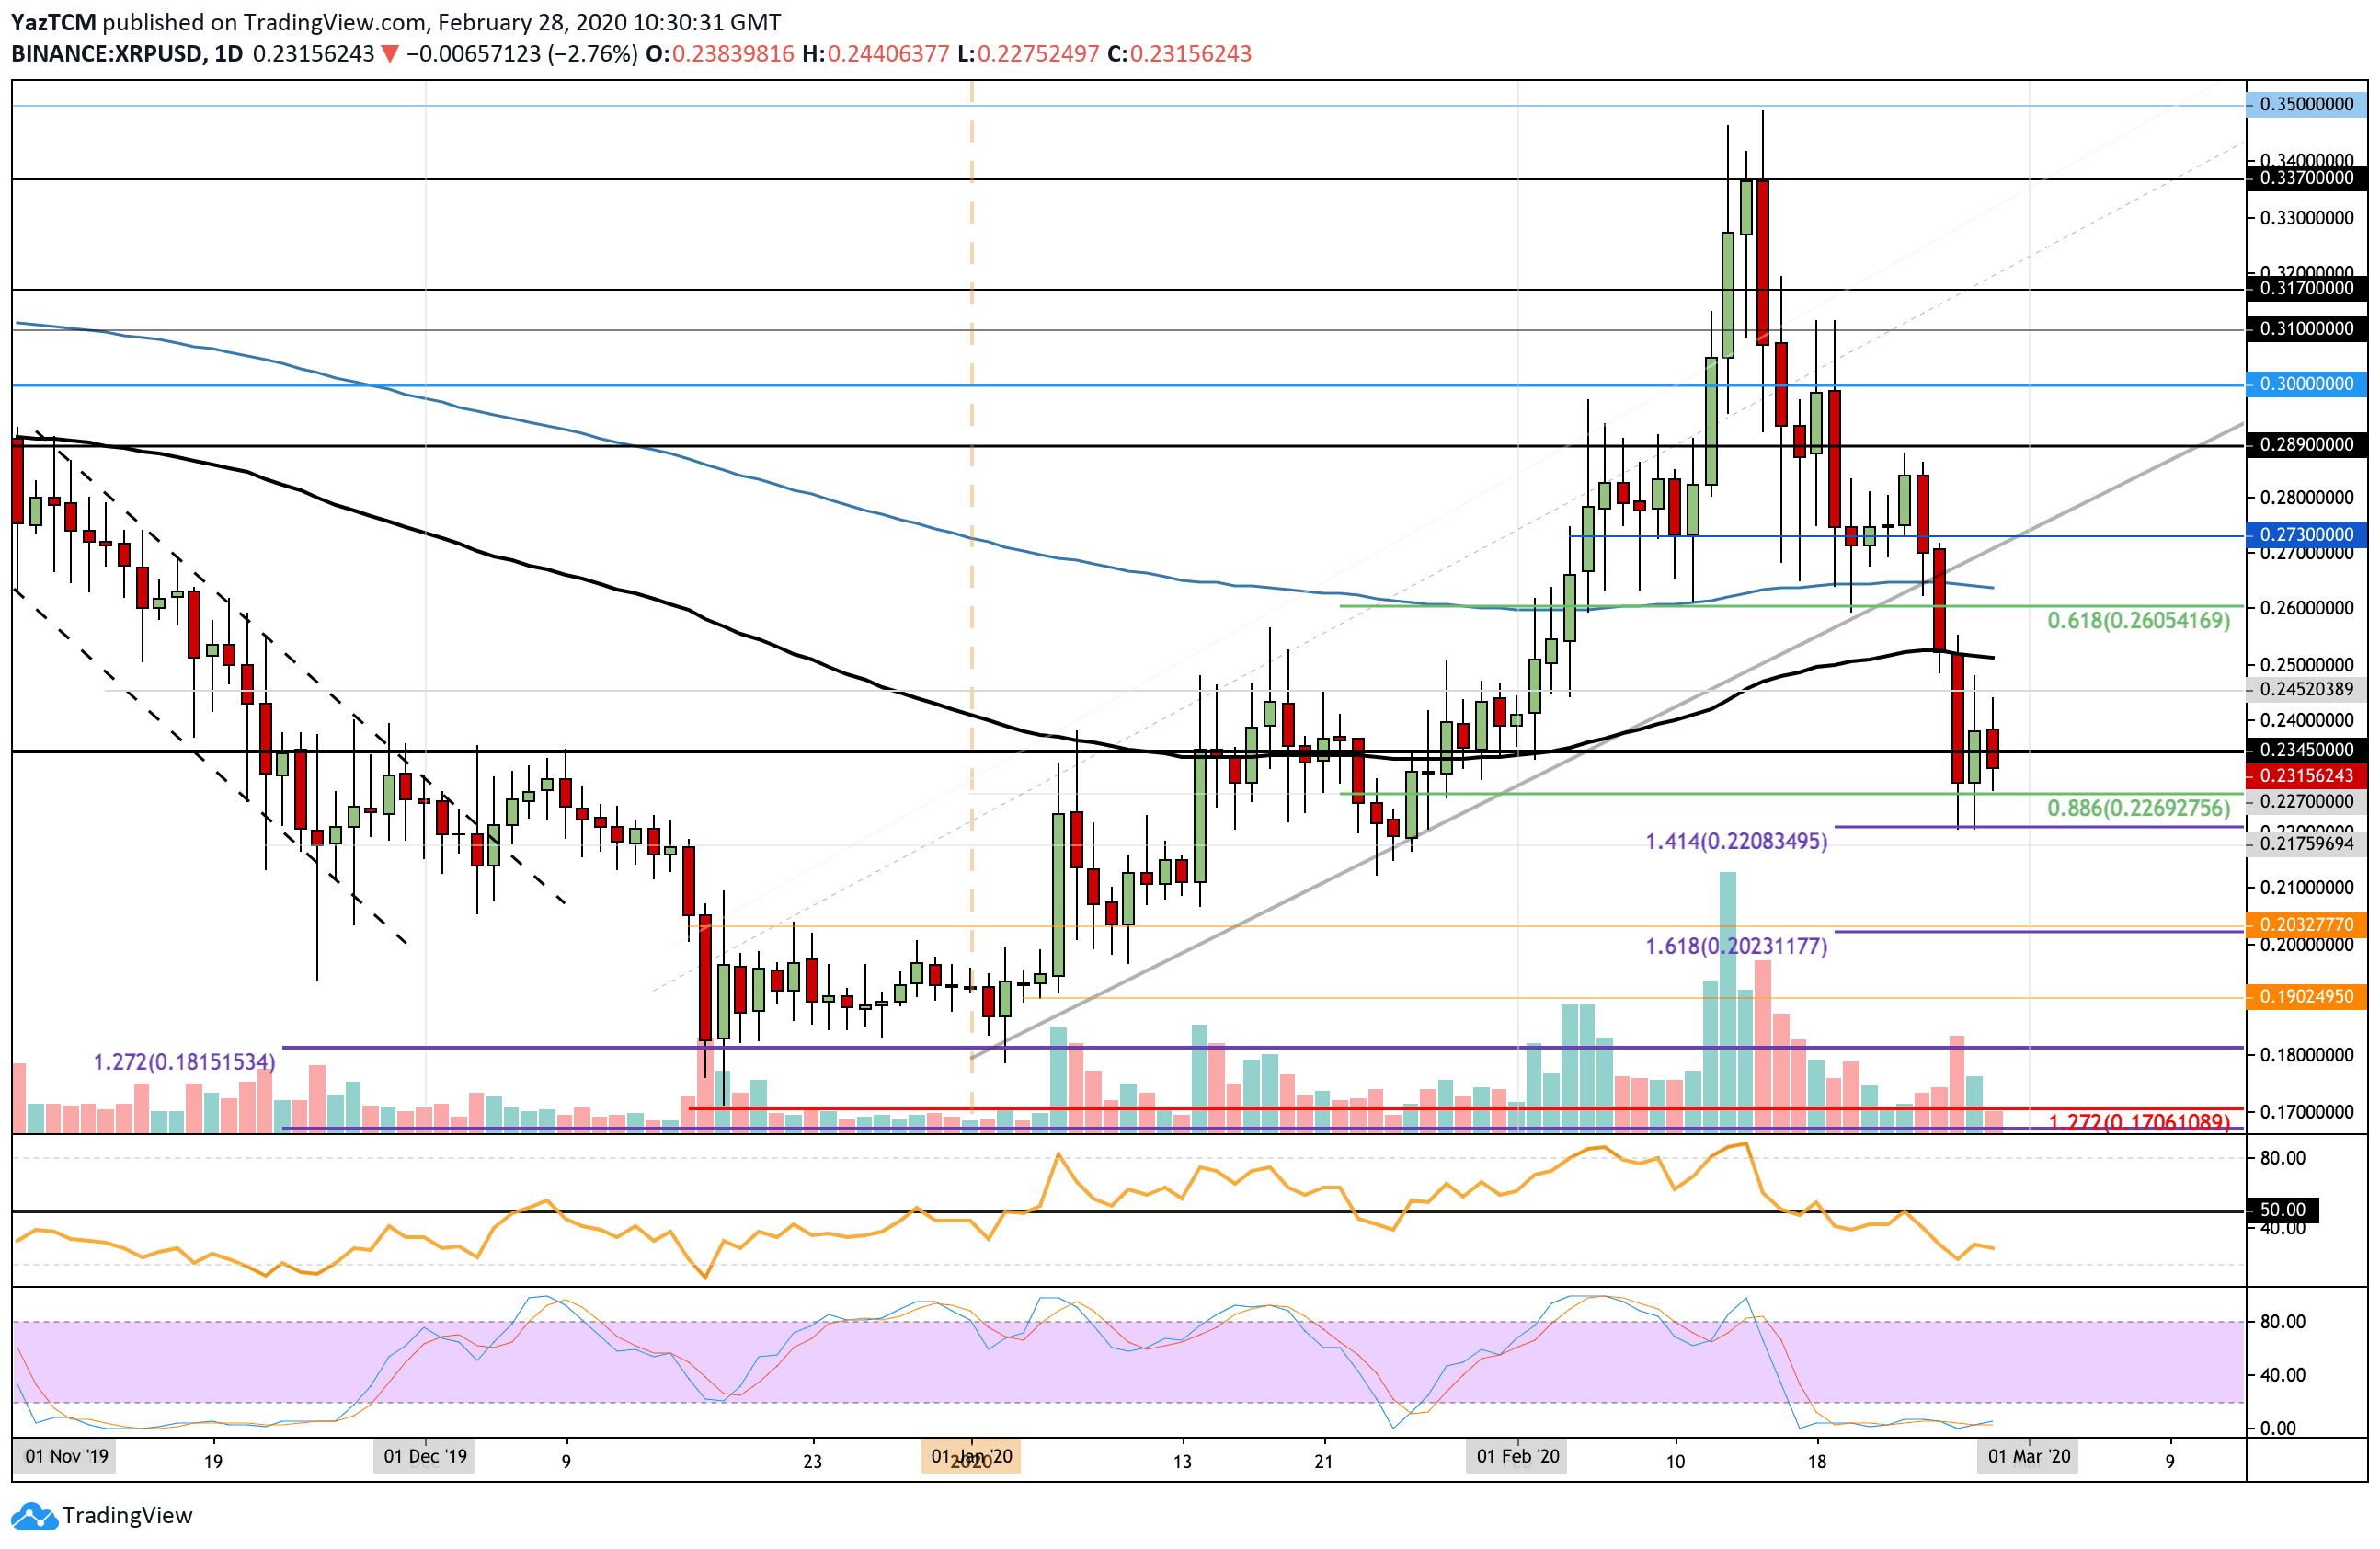
XRP also saw a 16% price fall this week as it drops beneath support at the rising trend line, the 200-days EMA, and the 100-days EMA to reach the current support at $0.227, provided by a .886 Fibonacci Retracement level.
If the sellers break beneath here, support lies at $0.22 (downside 1.414 Fib Extension), $0.21, $0.20, and $0.019. Toward the upside, resistance lies at $0.245, $0.25 (100-days EMA), and $0.26.
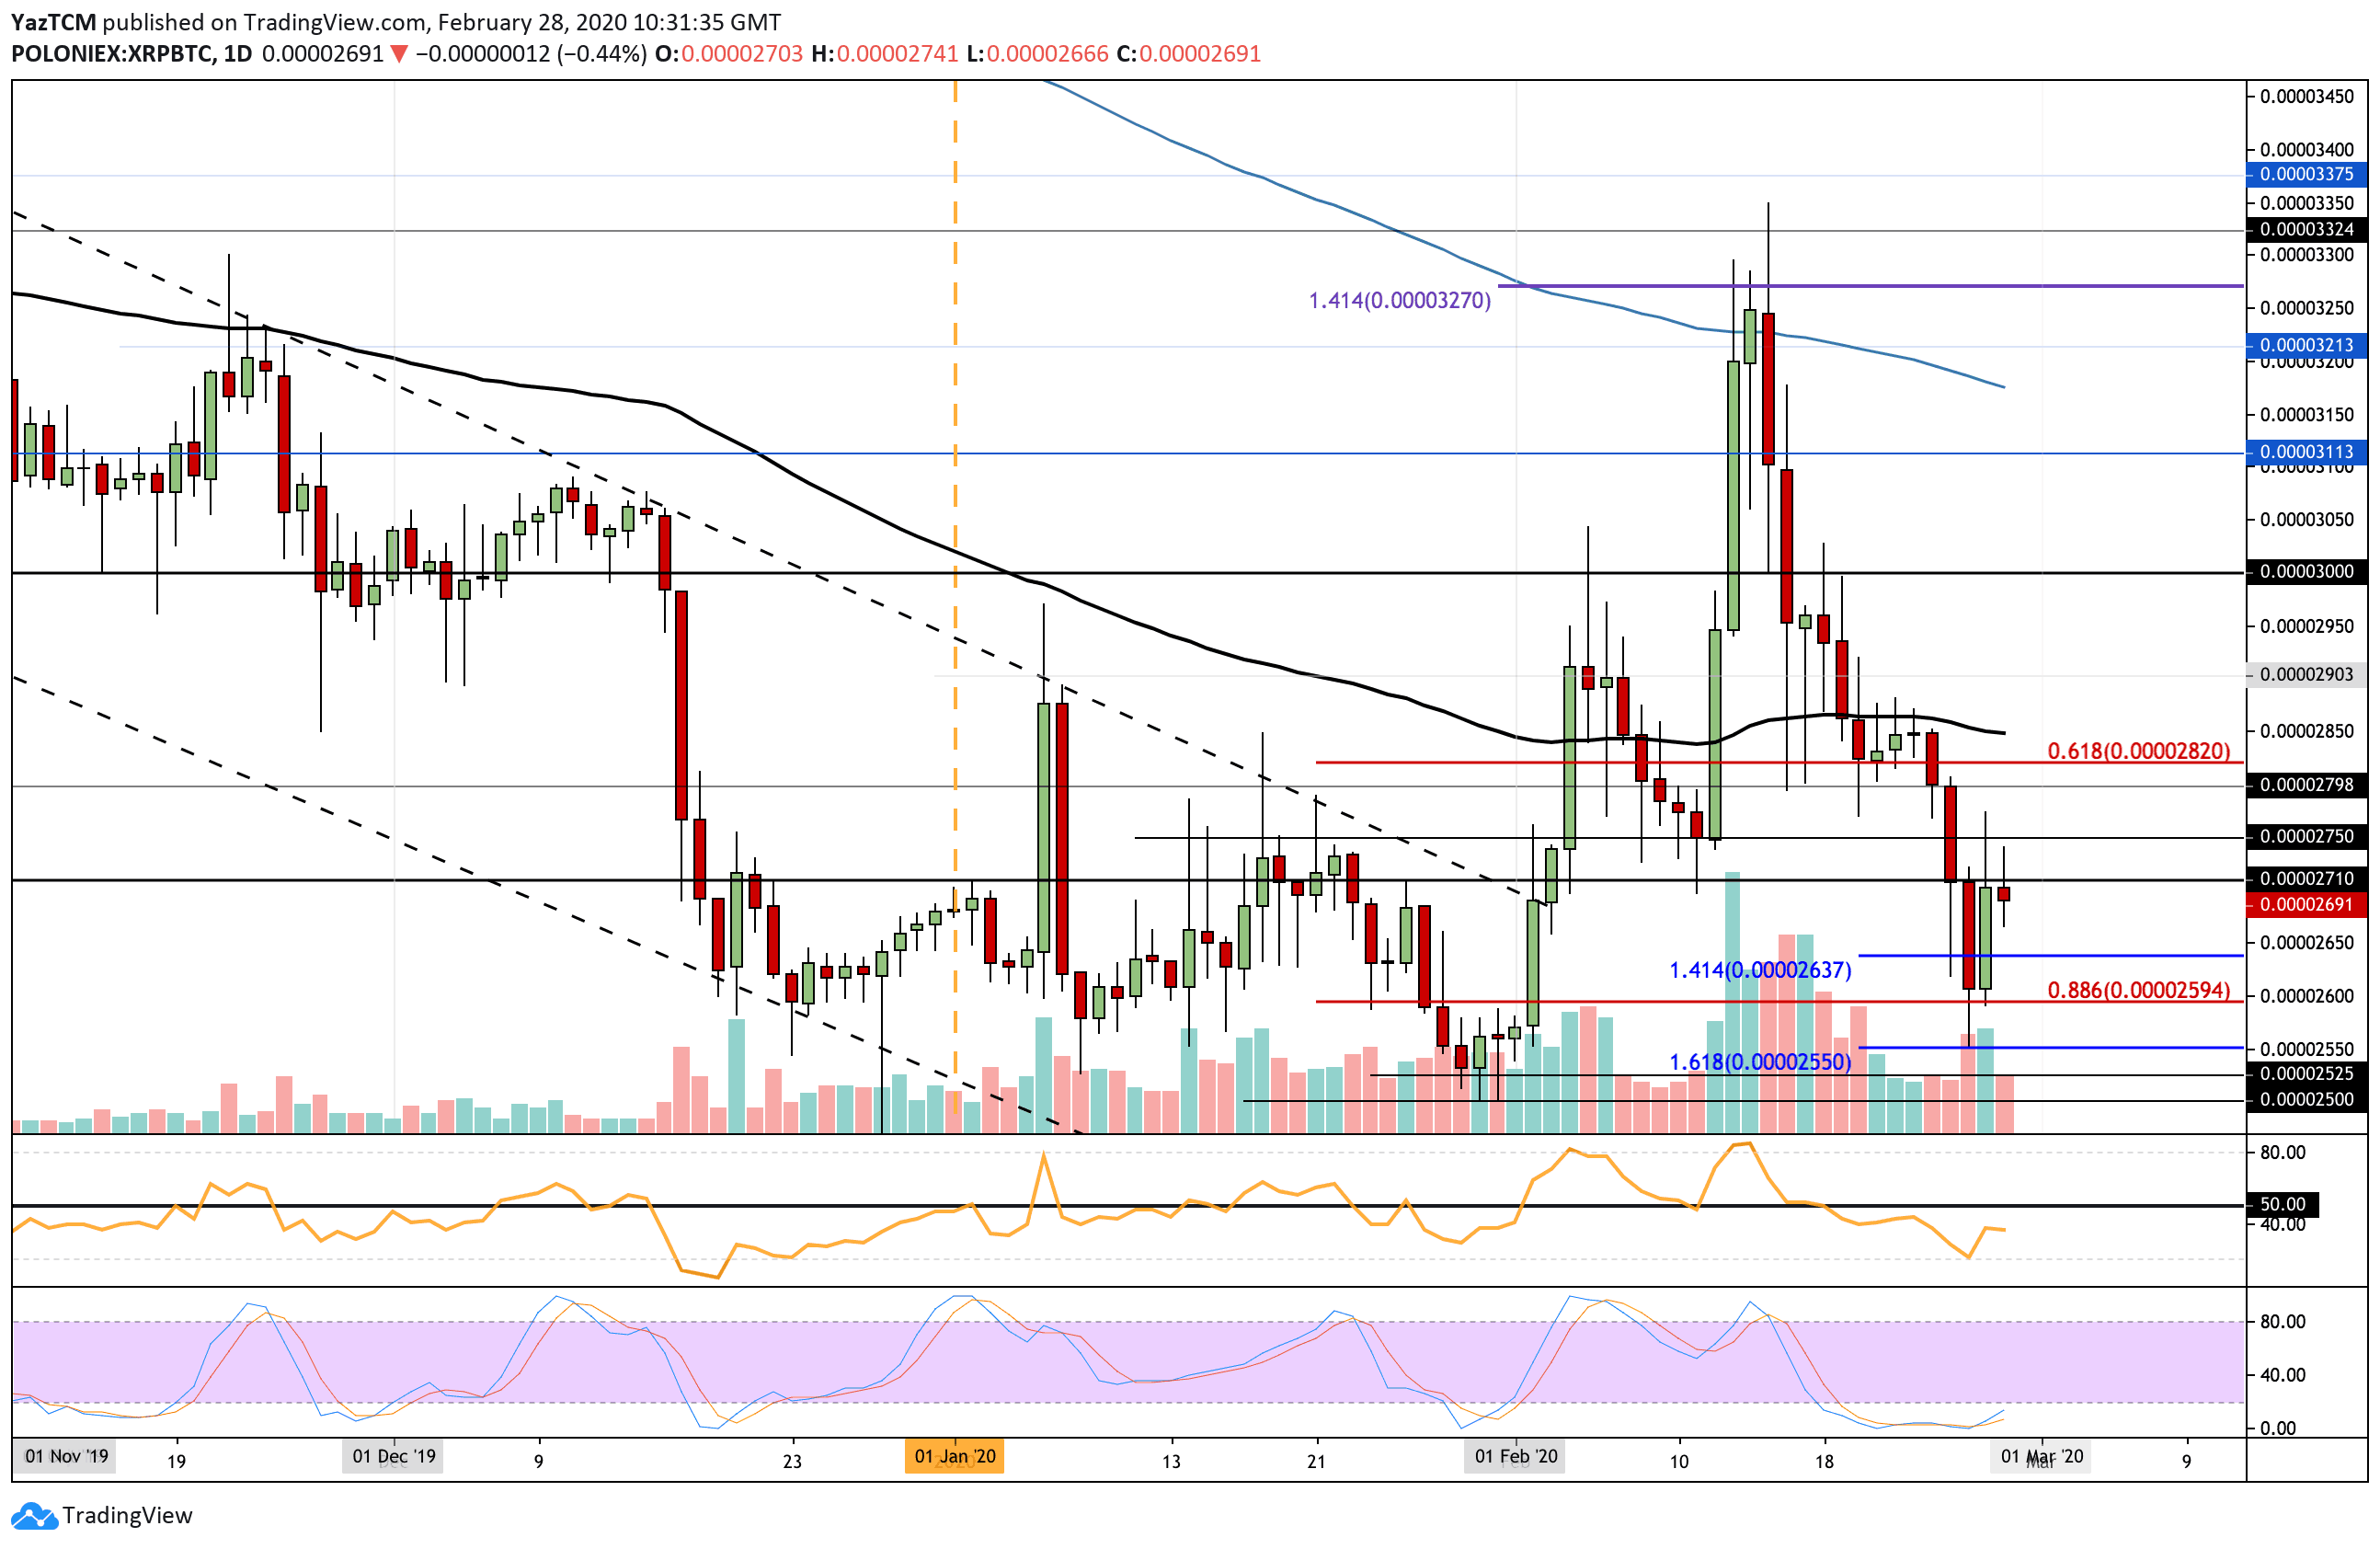
Against BTC, XRP penetrated the previous support at 2820 SAT to drop much lower by reaching support at 2600 SAT. It rebounded from here but has run into resistance at 2710 SAT.
If the bulls can break 2710 SAT, resistance lies at 2750 SAT, 2800 SAT, and 2850 SAT (100-days EMA). Toward the downside, support is located at 2640 SAT, 2600 SAT (.886 Fib Retracement), and 2550 SAT (downside 1.618 Fib Extension). This is followed by additional support at 2525 SAT and 2500 SAT.
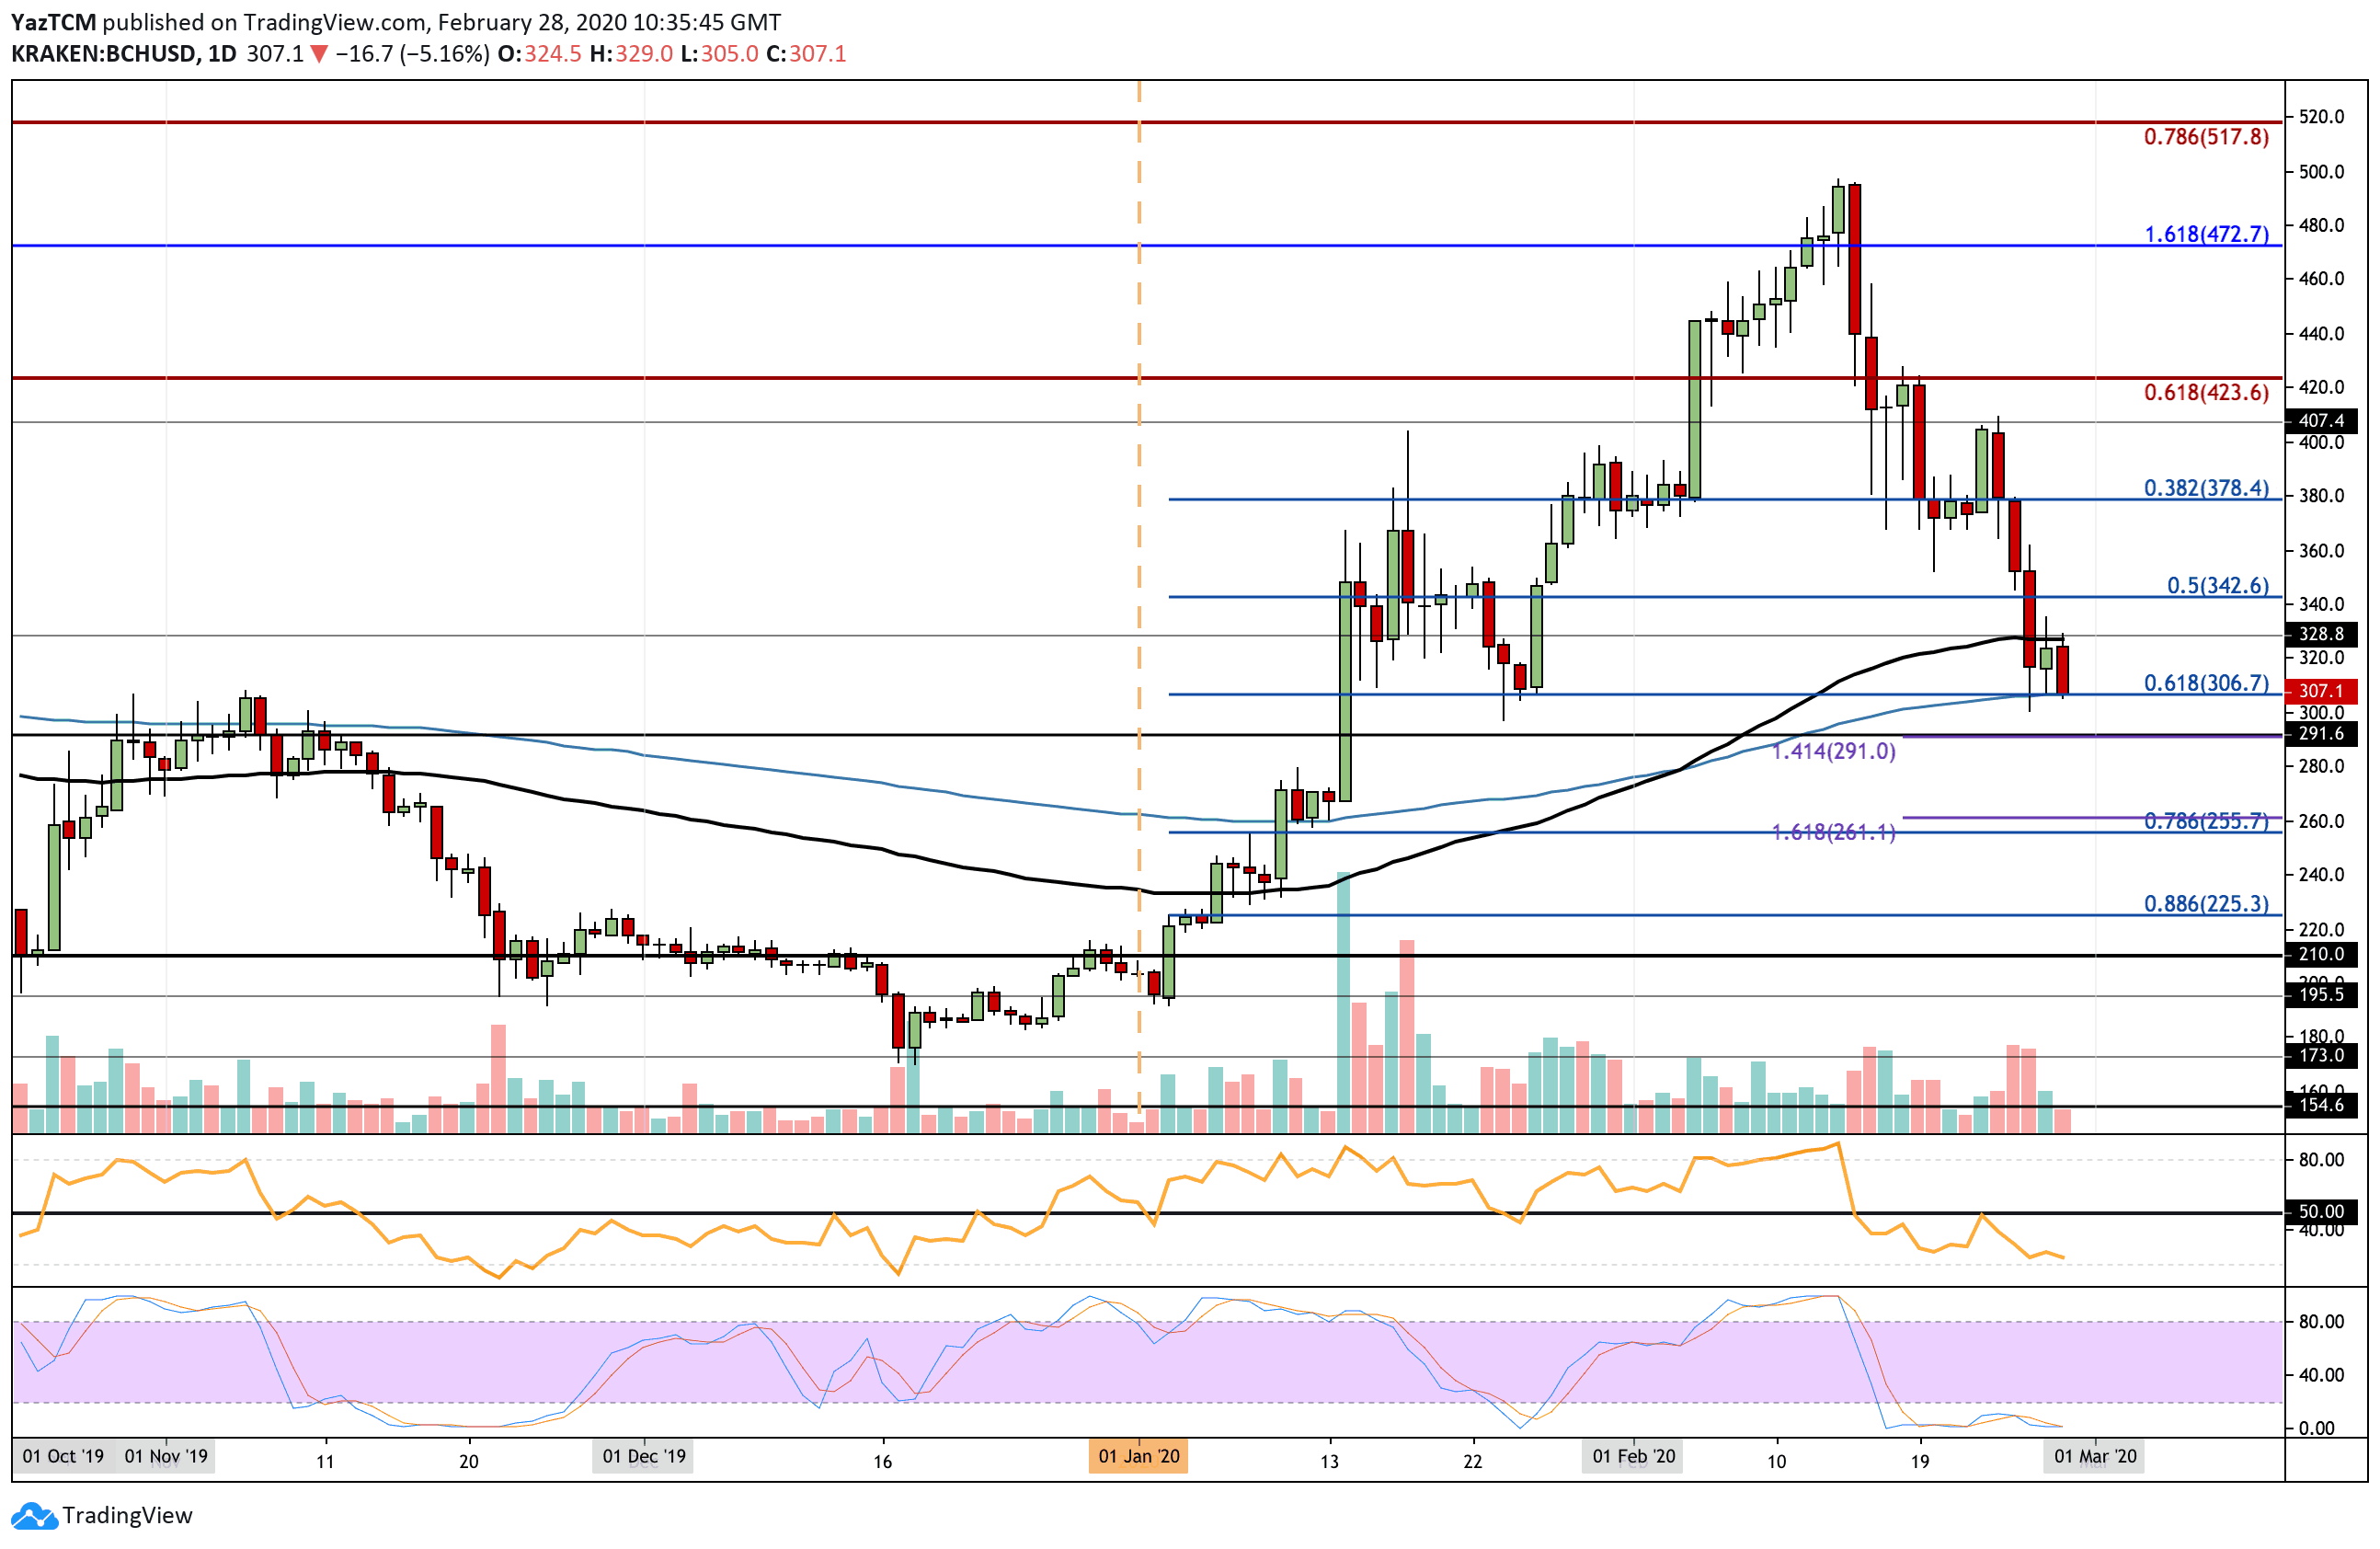
Bitcoin Cash witnessed a drastic turn around after reaching resistance at $500. It rolled over and dropped by a total of 40% over the past 13-days of trading to reach the current support at $305, provided by the .618 Fib Retracement and the 200-days EMA.
If it drops beneath the 200-days EMA and $300, support can be expected at $290 (downside 1.414 Fib Extension), $280, and $255 (.786 Fib Retracement). If it can rebound from here, resistance is located at $330 (100-days EMA), $340, and $380.
BCH has also been struggling against BTC after it rolled over at the 0.0477 BTC resistance and dropped to reach the current support at 0.035 BTC, provided by the 200-days EMA and a .618 Fib Retracement.
If we break the aforementioned support, we can expect 0.034 BTC and 0.0335 BTC to provide additional support moving forward. Beneath this, support lies at 0.032 BTC (.786 Fib Retracement) and 0.0314 (downside 1.618 Fib Extension). On the other side, resistance lies at 0.038 BTC, 0.040 BTC, and 0.042 BTC.

Compared with other coins on this list, LINK has done pretty well by only dropping by 10% over the past week. The cryptocurrency rolled over from the 2019 price high at $4.80 during mid-Feb as it started to decline. It dropped as low as $3.10 before rebounding higher over the past 3-days to reach the current price of $3.82.
If the buyers continue to push LINK higher, resistance is located at $4.20, $4.60, and the 2019 high of $4.80. If they can create a fresh 2020 high above this, resistance lies at $5.00, $5.20, and $5.40 (1.272 Fib Extension). Toward the downside, support lies at $3.75, $3.40, and $3.20. This is followed by support at $3.00, $2.90 (100-days EMA), and $2.75.

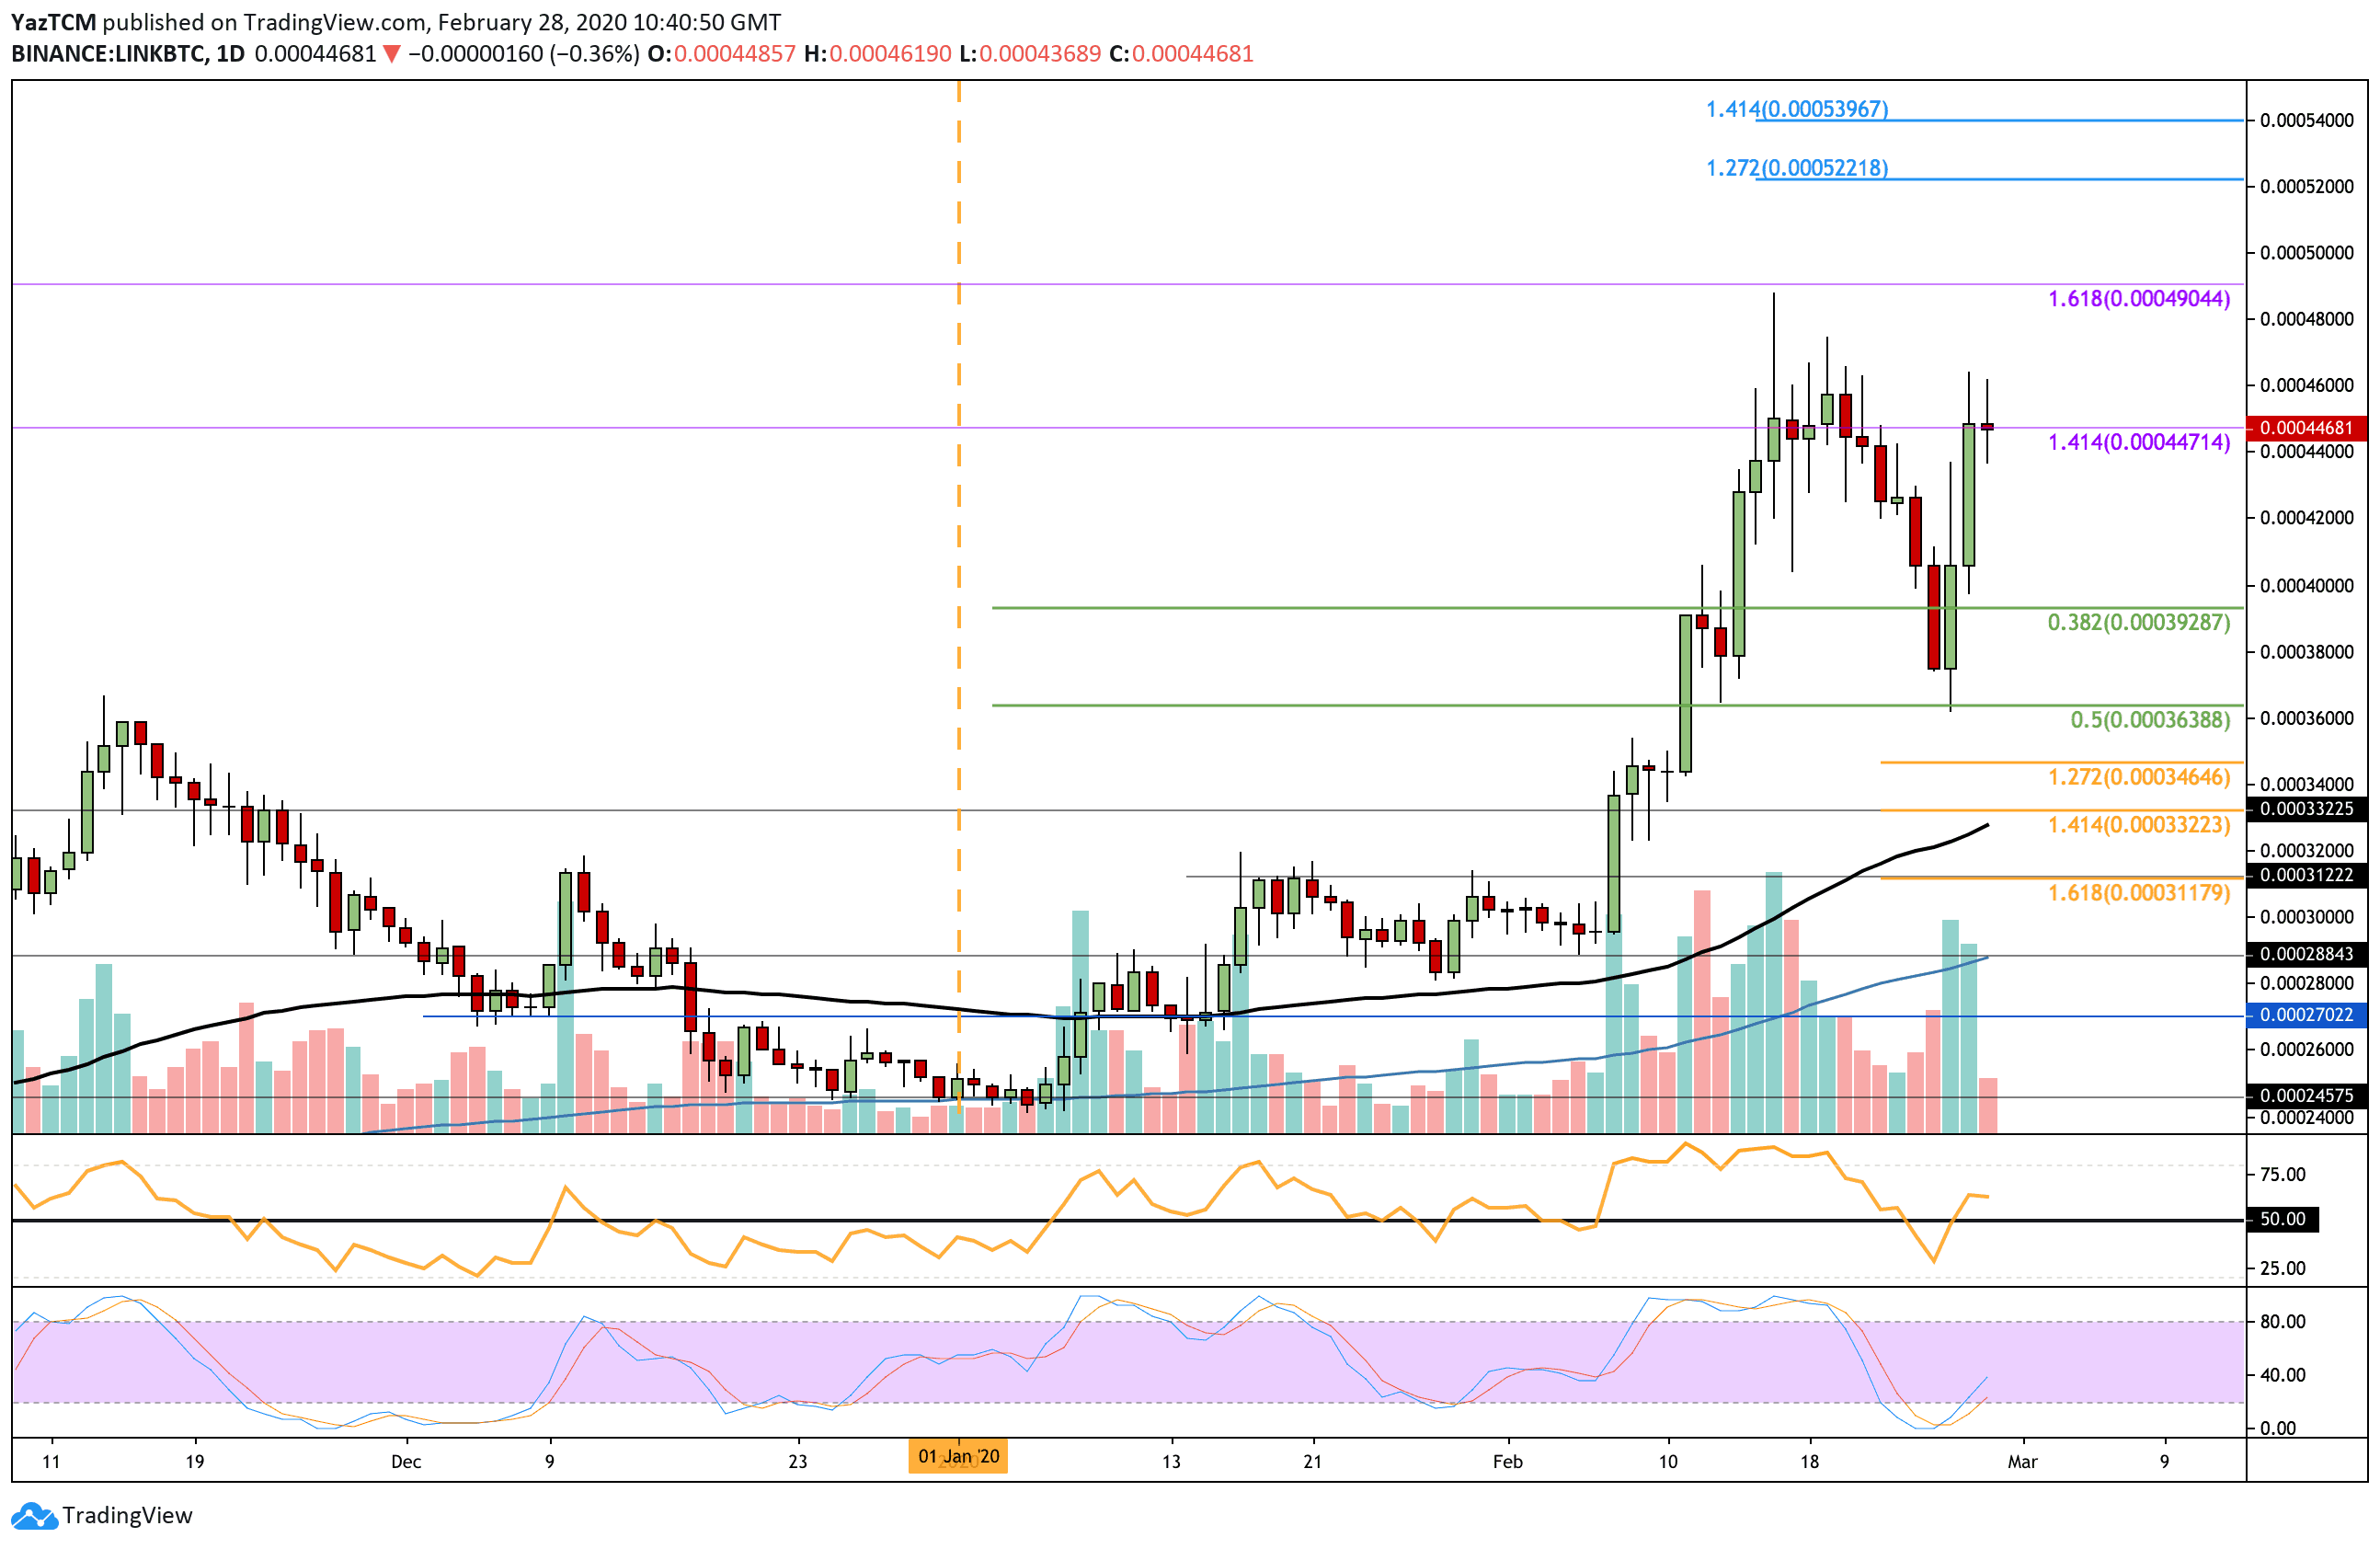
Against Bitcoin, LINK dropped from resistance at 0.00046 BTC and fell into support at 0.00036 BTC. It then rebounded from here to return above 0.0004 BTC and reach 0.00044 BTC. LINK is holding very strong against BTC, especially when compared with other altcoins.
If the buyers can break the strong resistance at 0.00046 BTC, we can expect higher resistance at 0.00048 BTC and 0.00049 BTC (1.618 Fib Extension). Following this, resistance lies at 0.0005 BTC, 0.000522 BTC, and 0.00054 BTC. Toward the downside, support is located at 0.00042 BTC, 0.00040 BTC, and 0.000363 BTC (.5 Fib Retracement).