Bitcoin Bitcoin saw an extraordinary 15.3% price surge this week which allowed the cryptocurrency to scratch the ,000 level today. It has since dropped slightly to ,500 but is still very much bullish. BTC started the week at ,200. From there it headed higher into the ,800 resistance but stalled at the weekend. As the election started in the US, BTC started to surge. Initially, it found resistance at ,190 but this was penetrated yesterday as Bitcoin surged all the way to ,500. Today, BTC spiked further to scratch ,000 but has since dropped back to ,500. Looking ahead, if the sellers push BTC lower, the first level of support lies at ,200. This is followed by support at ,000, ,635 (.236 Fib), ,400, and ,190. Beneath ,000, added
Topics:
Yaz Sheikh considers the following as important: ADABTC, ADAUSD, Bitcoin (BTC) Price, BTC Analysis, BTCEUR, BTCGBP, btcusd, btcusdt, Cardano (ADA) Price, ETH Analysis, ETHBTC, Ethereum (ETH) Price, ethusd, Litecoin (LTC) Price, LTCBTC, ltcusd, Market Updates, Price Analysis, Ripple (XRP) Price, XRP Analysis, xrpbtc, xrpusd
This could be interesting, too:
Mandy Williams writes Bitcoin ETFs Record Over .6B in Outflows in the Past 2 Weeks
Dimitar Dzhondzhorov writes Millions of ADA Sold by Cardano Whales During Market Crash – Will the Decline Continue?
Chayanika Deka writes Bitcoin Whales Offload 6,813 BTC as Selling Pressure Mounts
Wayne Jones writes Bitcoin Sentiment Hits 2022 Lows as Fear & Greed Index Falls to 10
Bitcoin
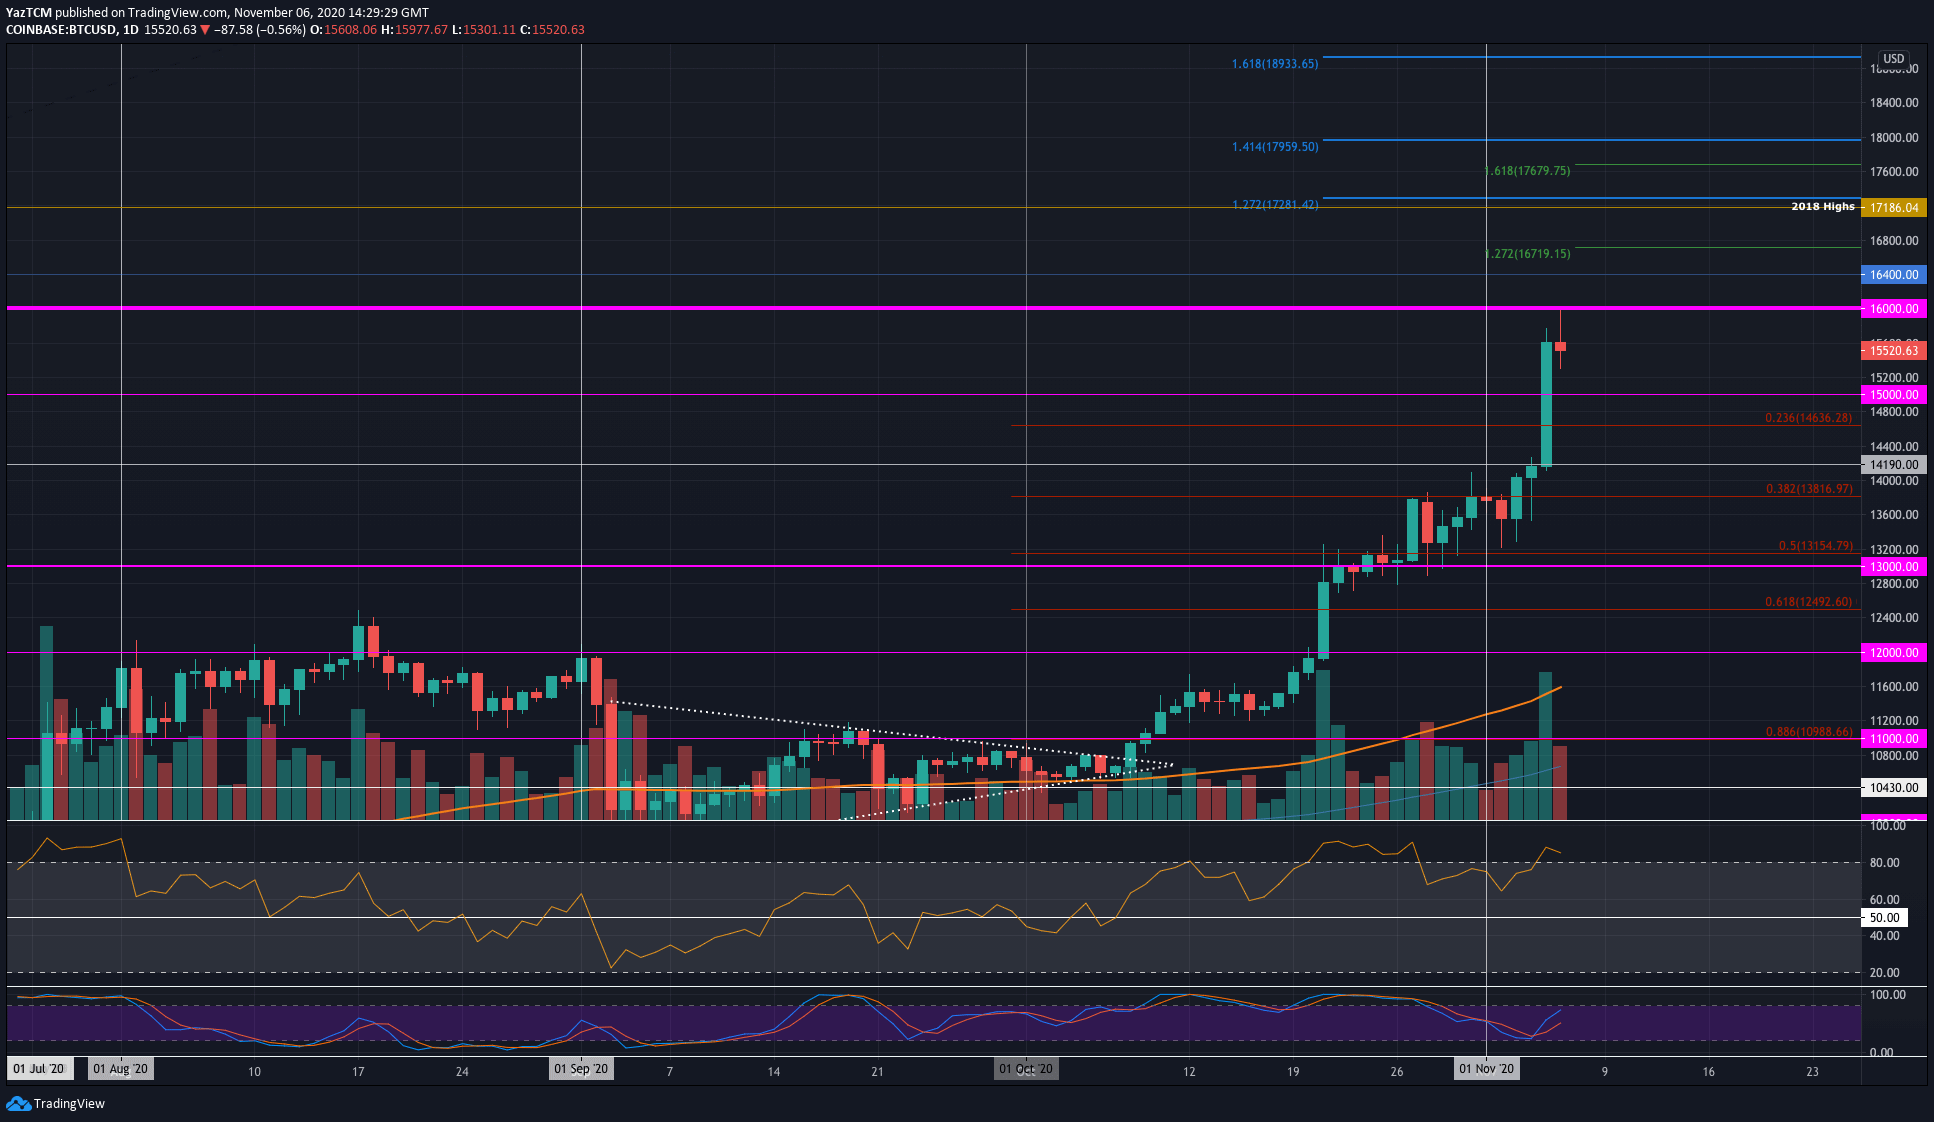
Bitcoin saw an extraordinary 15.3% price surge this week which allowed the cryptocurrency to scratch the $16,000 level today. It has since dropped slightly to $15,500 but is still very much bullish.
BTC started the week at $13,200. From there it headed higher into the $13,800 resistance but stalled at the weekend. As the election started in the US, BTC started to surge. Initially, it found resistance at $14,190 but this was penetrated yesterday as Bitcoin surged all the way to $15,500.
Today, BTC spiked further to scratch $16,000 but has since dropped back to $15,500.
Looking ahead, if the sellers push BTC lower, the first level of support lies at $15,200. This is followed by support at $15,000, $14,635 (.236 Fib), $14,400, and $14,190. Beneath $14,000, added support lies at $14,815 (.382 Fib), $13,600, and $12,155 (.5 Fib).
On the other side, if the bulls push higher again, the first level of resistance lies at $16,000. Above this, resistance lies at $16,400, $16,720 (1.272 Fib Extension), and $17,000. Beyond $17,000, resistance is expected at $17,186 (2018 Highs).
Ethereum
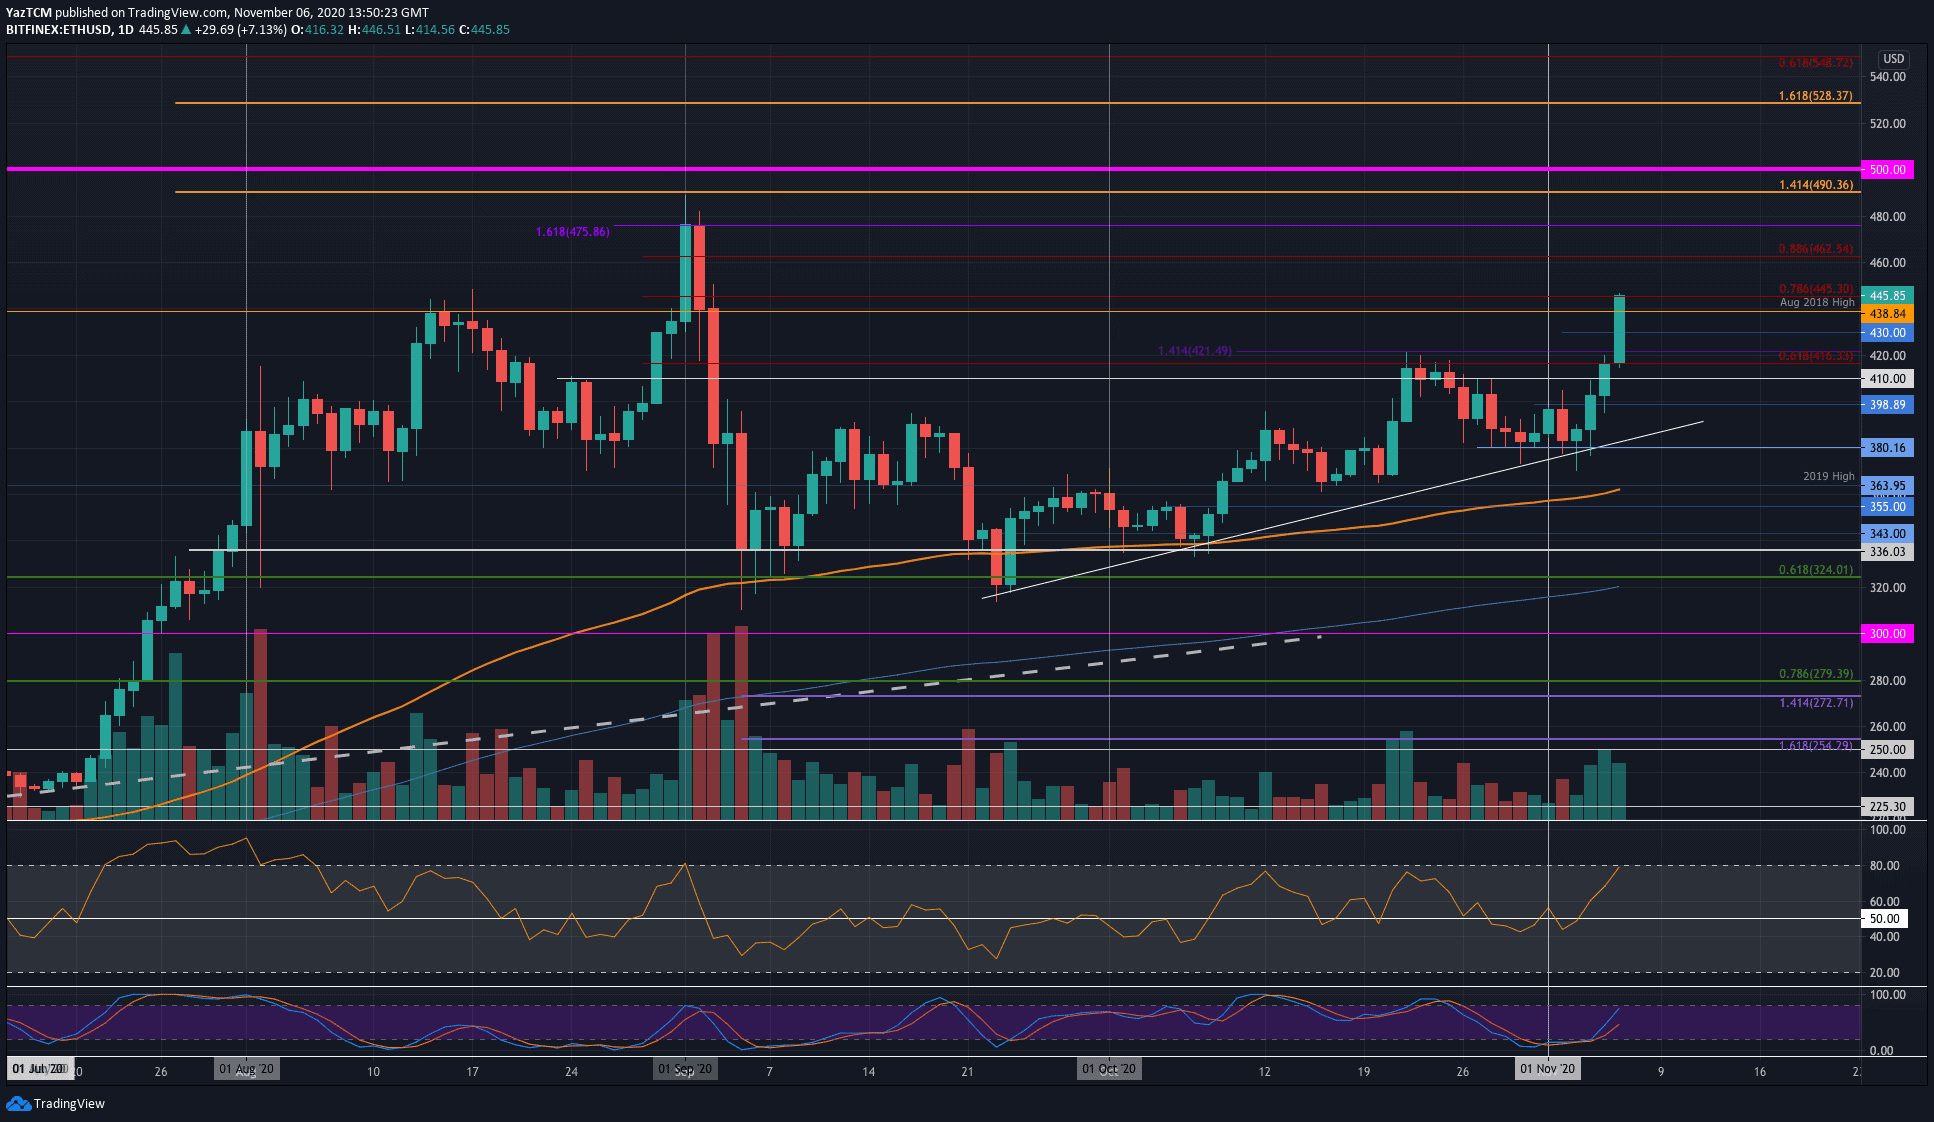
Ethereum saw a powerful 15.3% price surge as it reached the $441 level today. It was trading at the $380 support last Friday as it pushed higher into $400 over the weekend. At the start of this week, ETH dropped back to $380 but managed to rebound from a rising trend line.
After rebounding, Ethereum surged higher to reach the $416 resistance (bearish .618 Fib Retracement) yesterday. This resistance was penetrated today as ETH climbed higher into the $445 resistance – provided by a bearish .786 Fib Retracement.
Looking ahead, if the buyers continue above $445, the first level of higher resistance lies at $462 (bearish .886 Fib Retracement). Following this, resistance lies at $475 (September high-day closing price), $490, and $500.
On the other side, the first level of support lies at $438 (August 2018 highs). Beneath this, support lies at $420, $416, $410, and $400.
Against Bitcoin, Ethereum was trading at the 0.0294 BTC (Feb 2020 Highs) at the start of the week. During the week, Ethereum headed lower to break beneath 0.0207 BTC and hit the support at 0.0267 BTC yesterday.
It managed to rebound from this support today as it pushed higher again to reach the 0.0284 BTC resistance.
If the bulls can climb back above the Feb 2020 highs at 0.0284 BTC, the first level of higher resistance lies at 0.029 BTC. Above this, resistance lies at 0.0296 BTC (200-days EMA), 0.03 BTC, and 0.0311 BTC (100-days EMA).
On the other side, the first level of support lies at 0.0278 BTC. This is followed by support at 0.027 BTC, 0.0267 BTC, and 0.0262 BTC.

Ripple
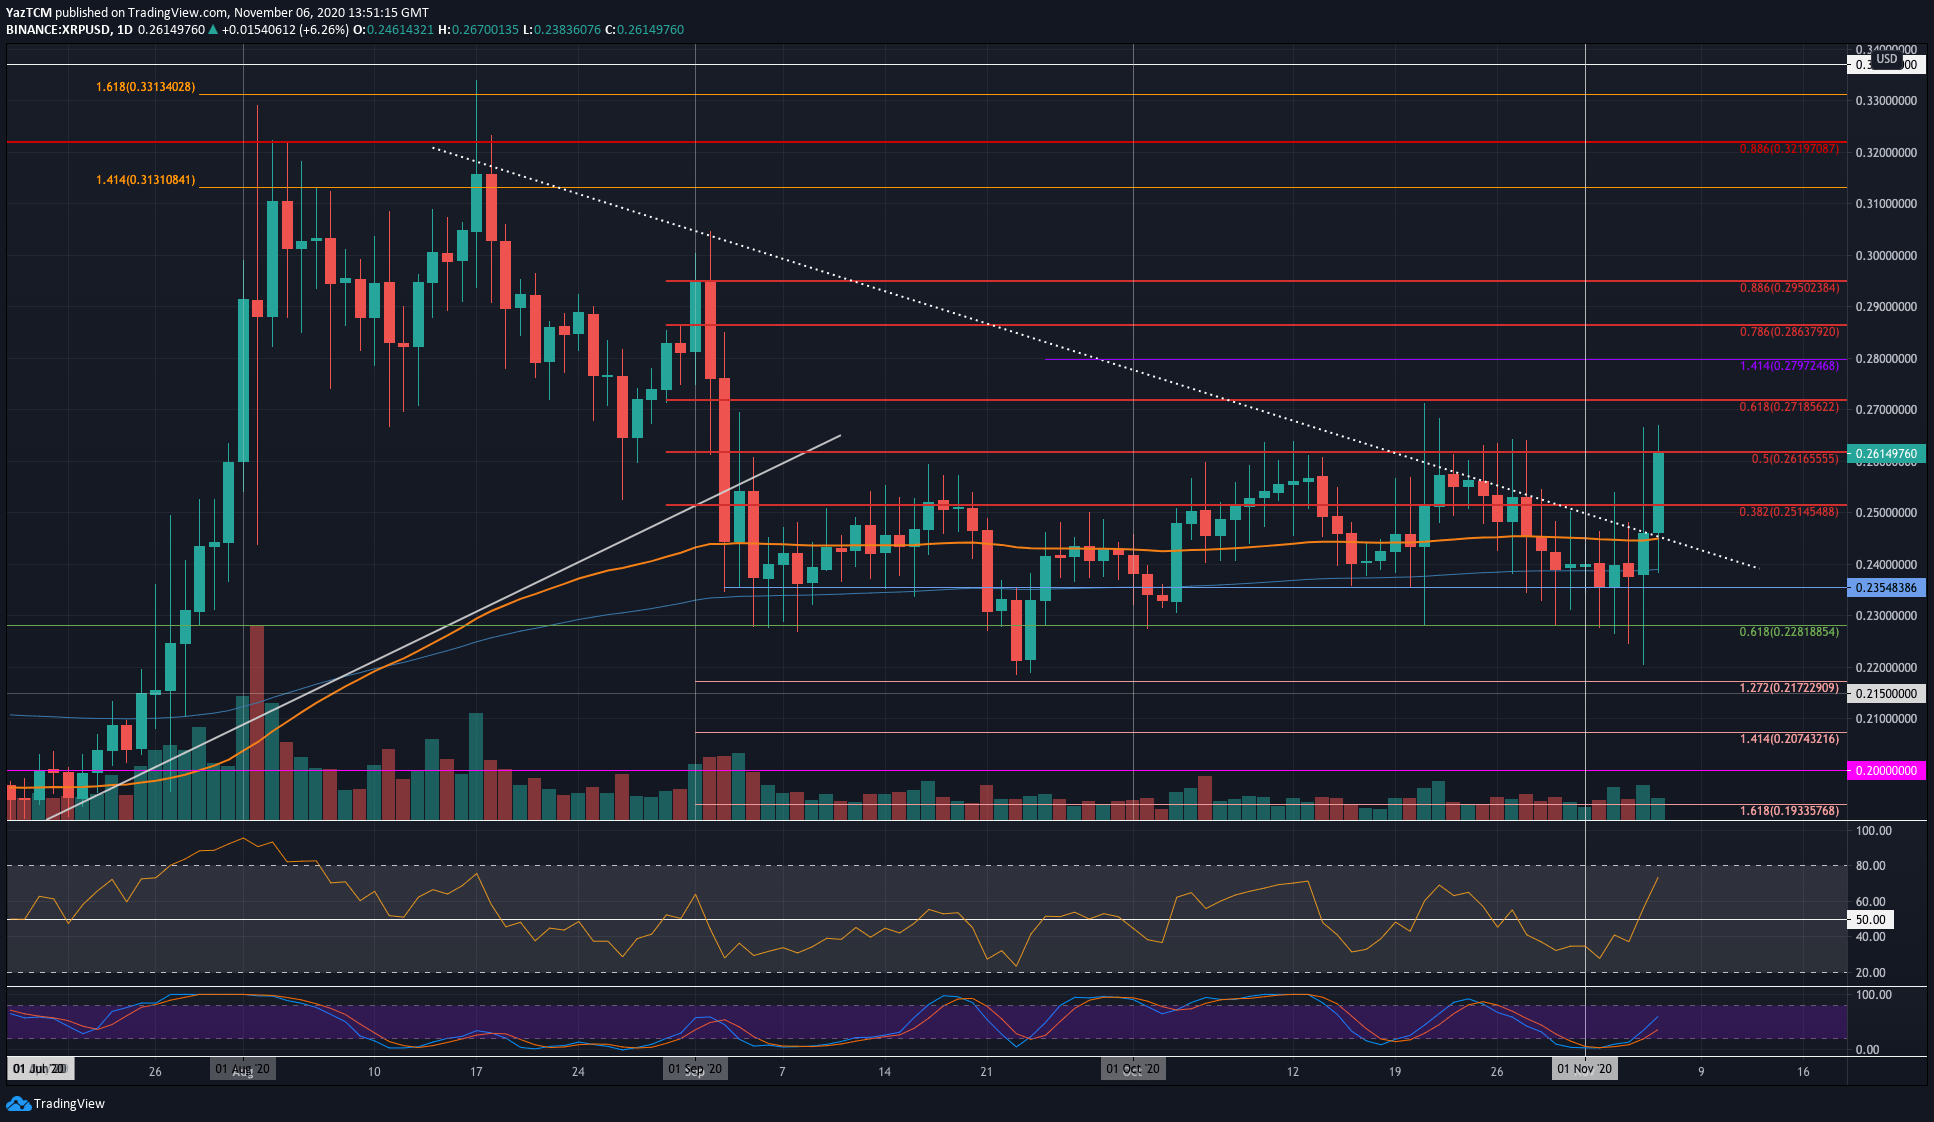
Ripple saw a smaller 6.4% price surge over the last week as it hit the $0.261 resistance today. It was trading at the 200-days EMA last Friday at around $0.24. Over the weekend, XRP headed lower but managed to defend the support at $0.235.
Yesterday, XRP climbed higher to reach the resistance at a long-term falling trend line. This trend line was penetrated today as XRP surged higher to break the resistance at $0.251 and reach the current resistance at $0.261 (bearish .5 FIb Retracement).
Moving forward, if the buyers can break the $0.261 resistance, higher resistance lies at $0.271 (bearish .618 fib Retracement), $0.28, and $0.286 (bearish .786 Fib Retracement).
Alternatively, the first level of support lies at $0.251. Beneath this, support lies at $0.245 (100-days EMA), $0.24 (200-days EMA), and $0.235.
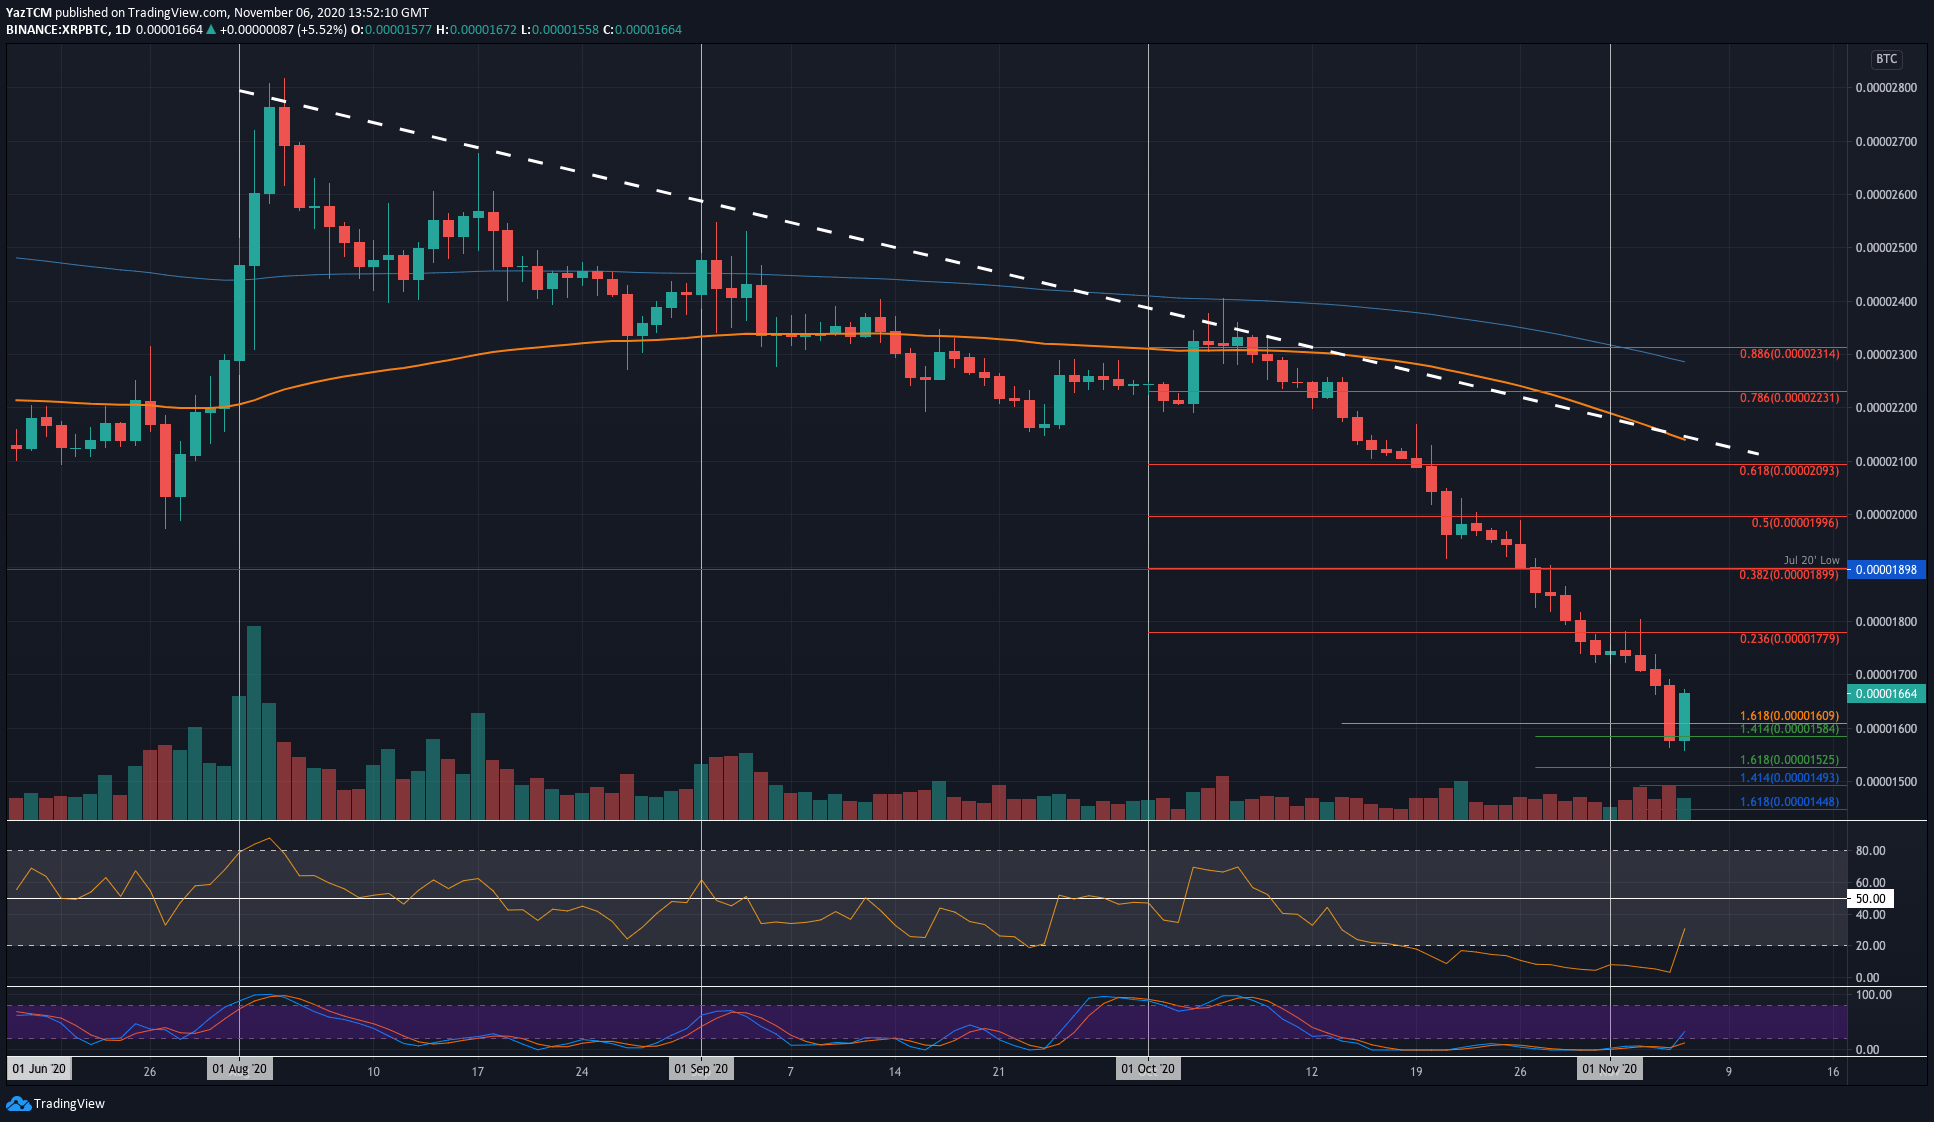
XRP has been in freefall against BTC during October. At the start of November, XRP was trading around the 1780 SAT level as it started to head lower. It continued to fall throughout the week until it hit 1555 SAT today which allowed it to rebound.
It has since pushed higher to trade at around 1665 SAT. The buyers will need to push above 1800 SAT before it can be considered as a reversal of some form.
Looking ahead, if the bulls can continue to drive above 1700 SAT, resistance lies at 1780 SAT (bearish .236 Fib Retracement), 1800 SAT, 1900 SAT (July 20 lows), and 1996 SAT (bearish .5 Fib Retracement).
On the other side, the first level of support lies at 1600 SAT. Beneath this, support lies at 1585 SAT, 1555 SAT, 1525 SAT, and 1500 SAT.
Litecoin
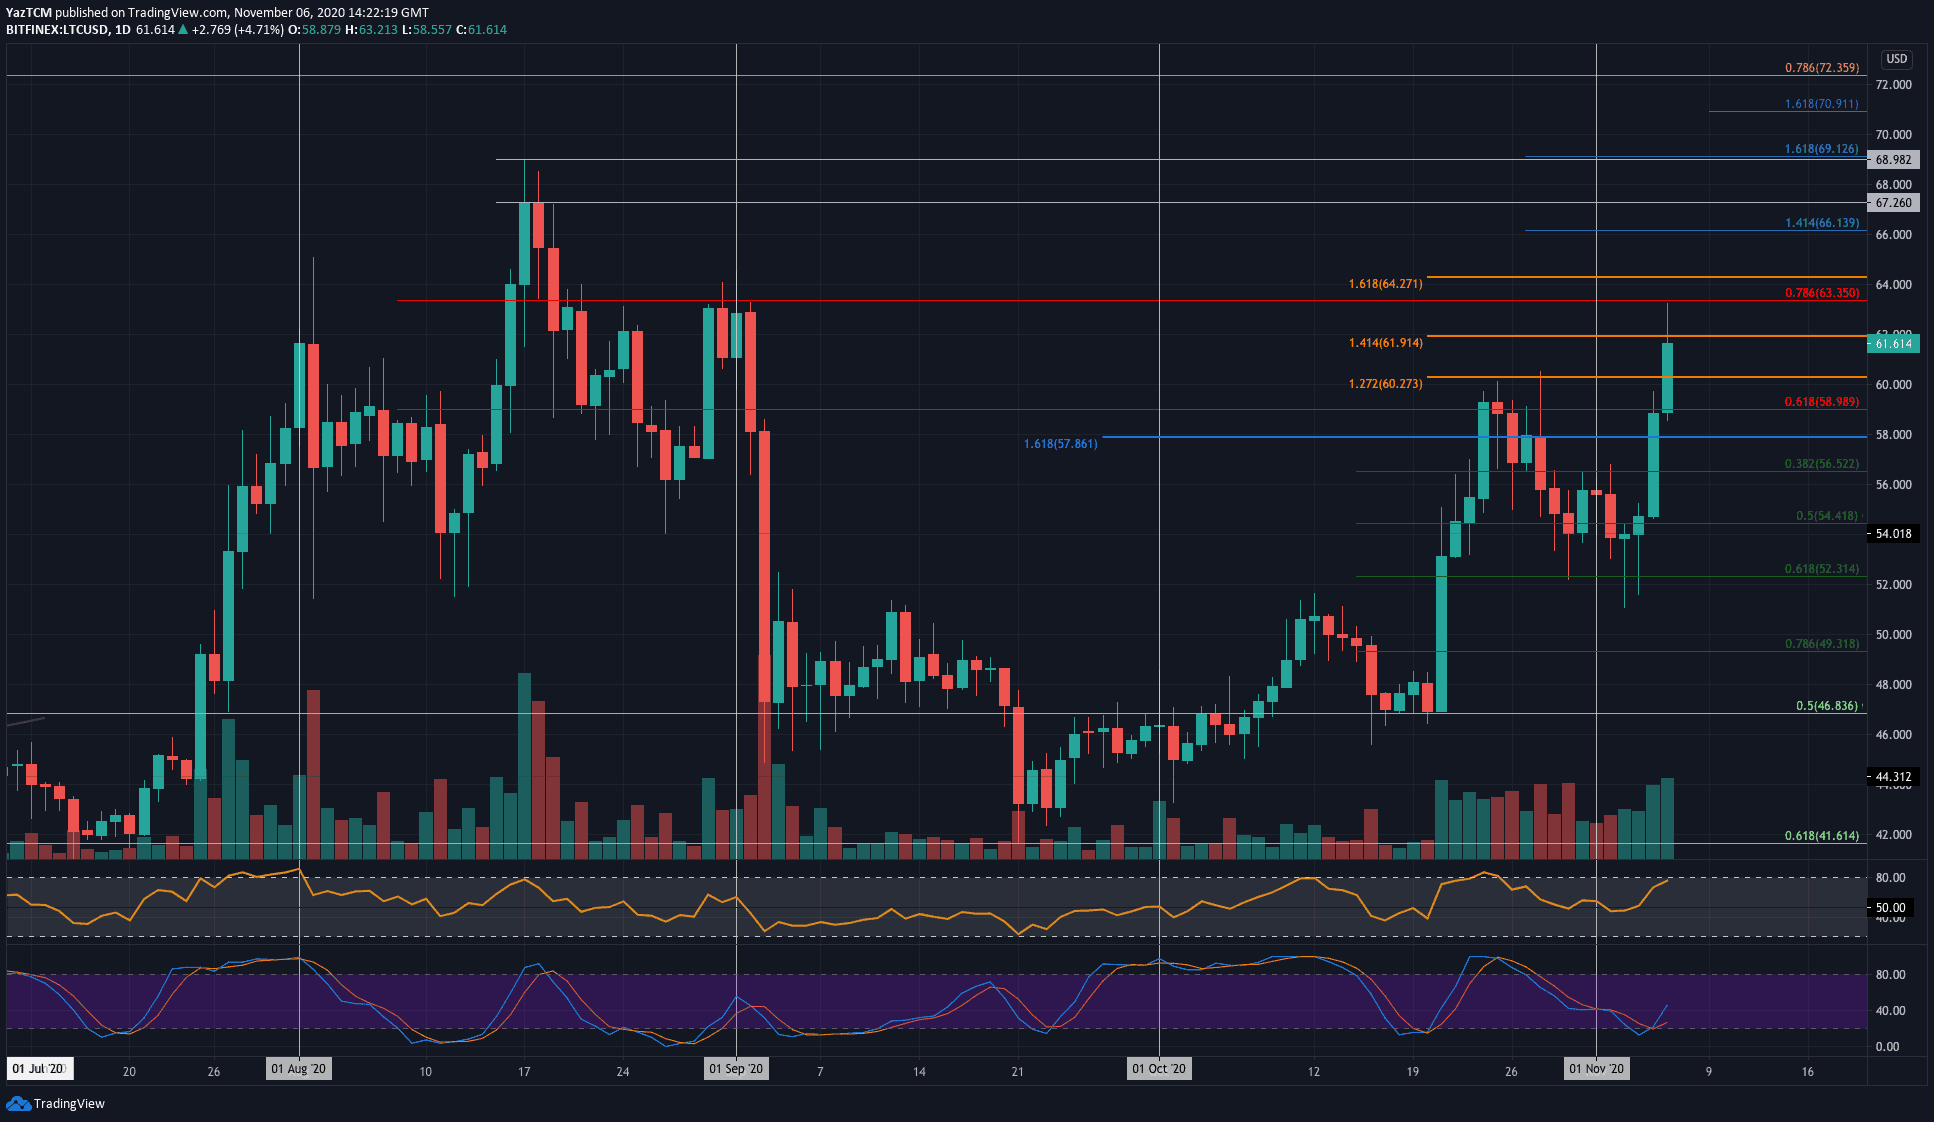
Litecoin saw a strong 13.7% price increase this week as it surged to 2-month highs to reach $62. The coin was trading at around $54 at the start of the week. It dropped lower during the weekend but managed to close each daily candle around $54.
Over the past four days, Litecoin started to climb higher. Yesterday, it reached the resistance at $59 (bearish .618 Fib Retracement). This resistance broke today as Litecoin surged above the October highs at $60.30 and continued higher to touch the resistance at $63.35 (bearish .786 Fib Retracement).
It has since dropped lower to trade at $61.90.
Moving forward, if the buyers can break the $61.90 resistance (1.414 Fib Extension), the first level of resistance lies at $63.35 (bearish .786 Fib Retracement). Above this, resistance lies at $64.27, $66.15, $67.26, and $68.98 (August 2020 highs).
On the other side, the first level of support lies at $60. Following this, support lies at $590m $57.86, $56.50 (.382 Fib Retracement), $54.40 (.5 Fib Retracement), and $52.
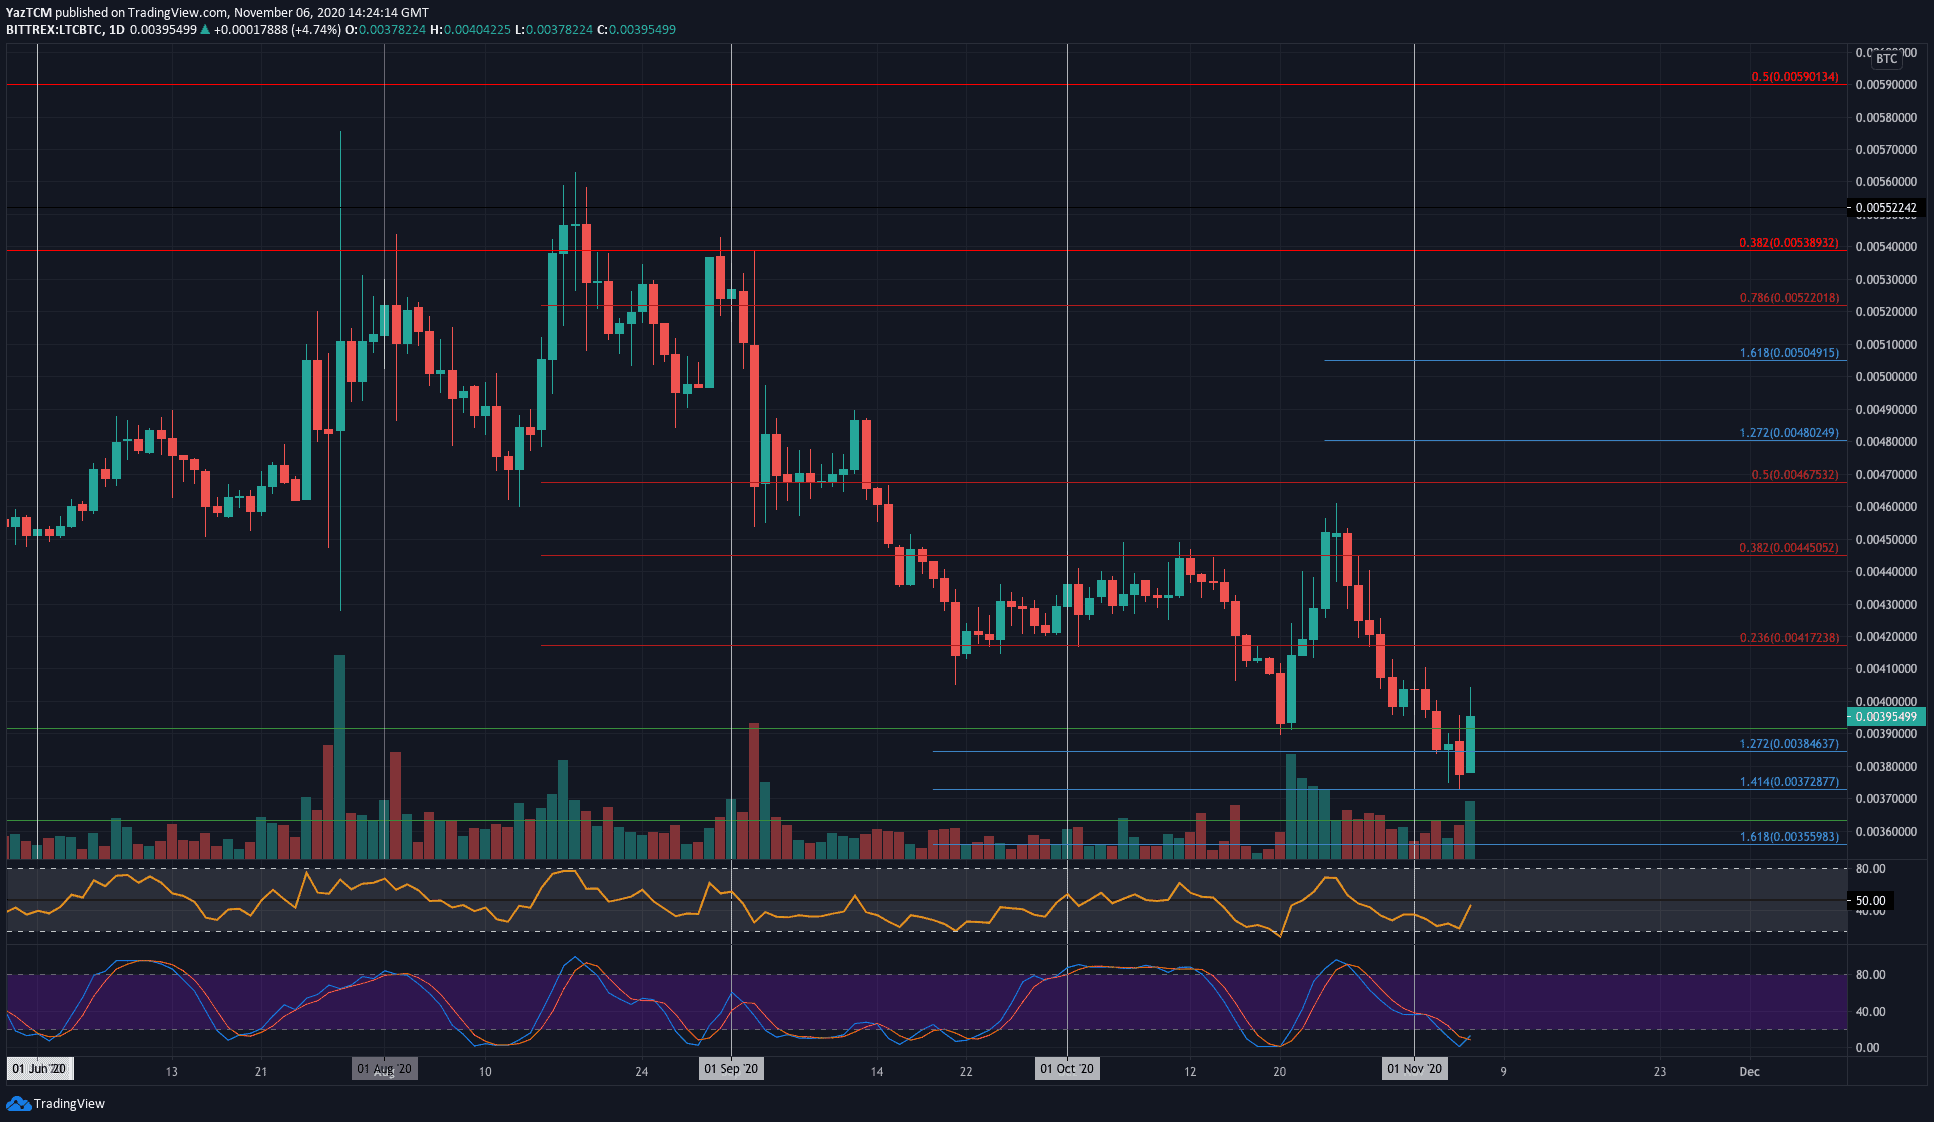
Against Bitcoin, Litecoin was trading at around 0.0041 BTC last Friday. From there, it headed lower through the week as it broke beneath 0.004 BTC to reach as low as 0.00372 BTC (downside 1.414 Fib Extension).
The buyers managed to rebound from this support today as they push higher toward 0.00395 BTC.
Looking ahead, if the bulls can continue to climb above 0.004 BTC, resistance is first located at 0.0041 BTC. This is followed by resistance at 0.00417 BTC (bearish .236 Fib), 0.0043 BTC, and 0.0044 BTC (bearish .382 Fib).
Alternatively, the first level of support lies at 0.0039 BTC. Beneath this, support is expected at 0.00384 BTC, 0.0038 BTC, and 0.00372 BTC.
Cardano
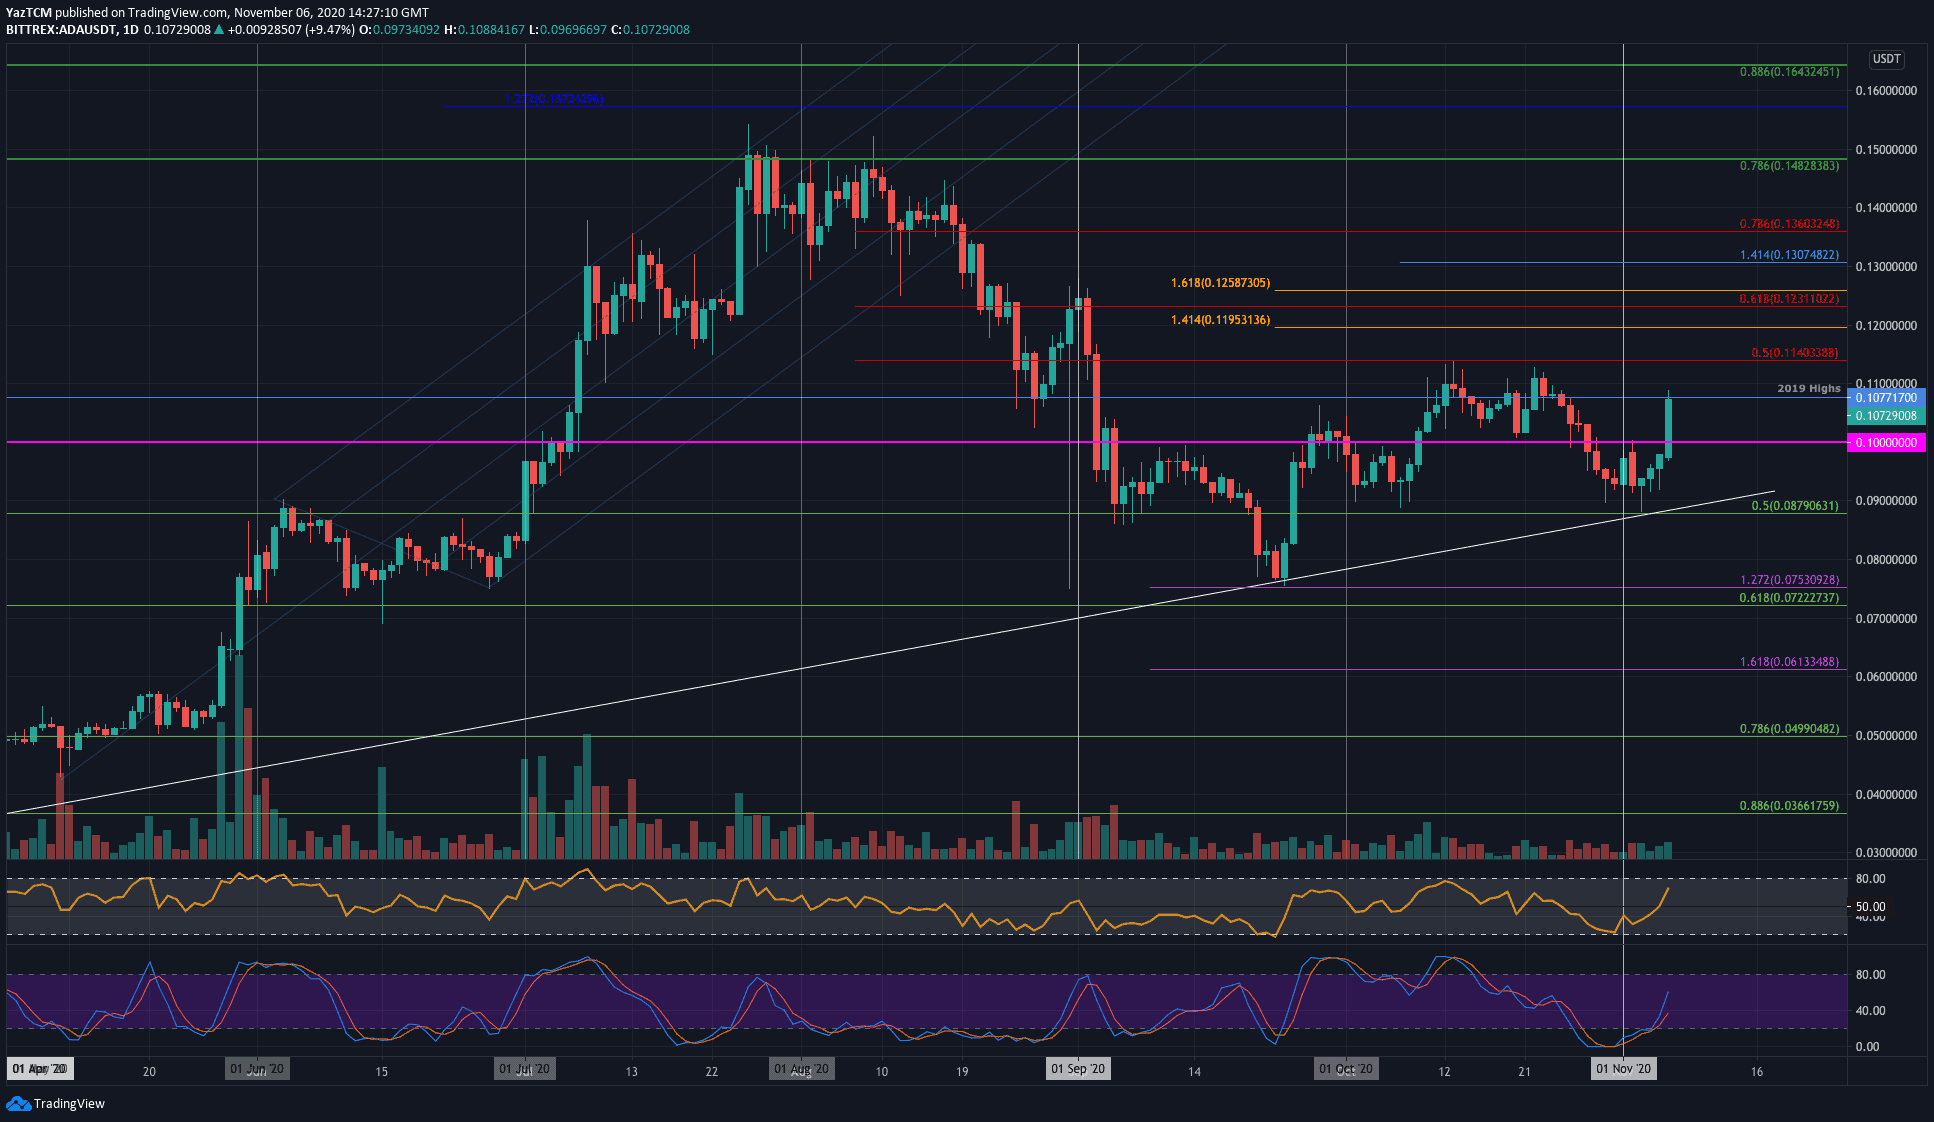
ADA managed to climb by a total of 10.6% this week to return to the 2019 highs at $0.107. The coin had spiked lower into the $0.087 (.5 Fib) support on Tuesday and managed to rebound from here. The support here was further bolstered by a long term rising trend line.
After it rebounded, ADA went on to push above $0.1 and reach the $0.107 resistance today.
Looking ahead, if the bulls break $0.107, the first level of strong resistance is expected at $0.114 (bearish .5 Fib & October highs). Beyond this, resistance is located at $0.119, $0.123 (bearish .618 Fib Retracement), and $0.13.
On the other side, the first level of support is expected at $0.1. Beneath this, support lies at $0.095, $0.09, and $0.087 (.5 Fib & rising support trend line).
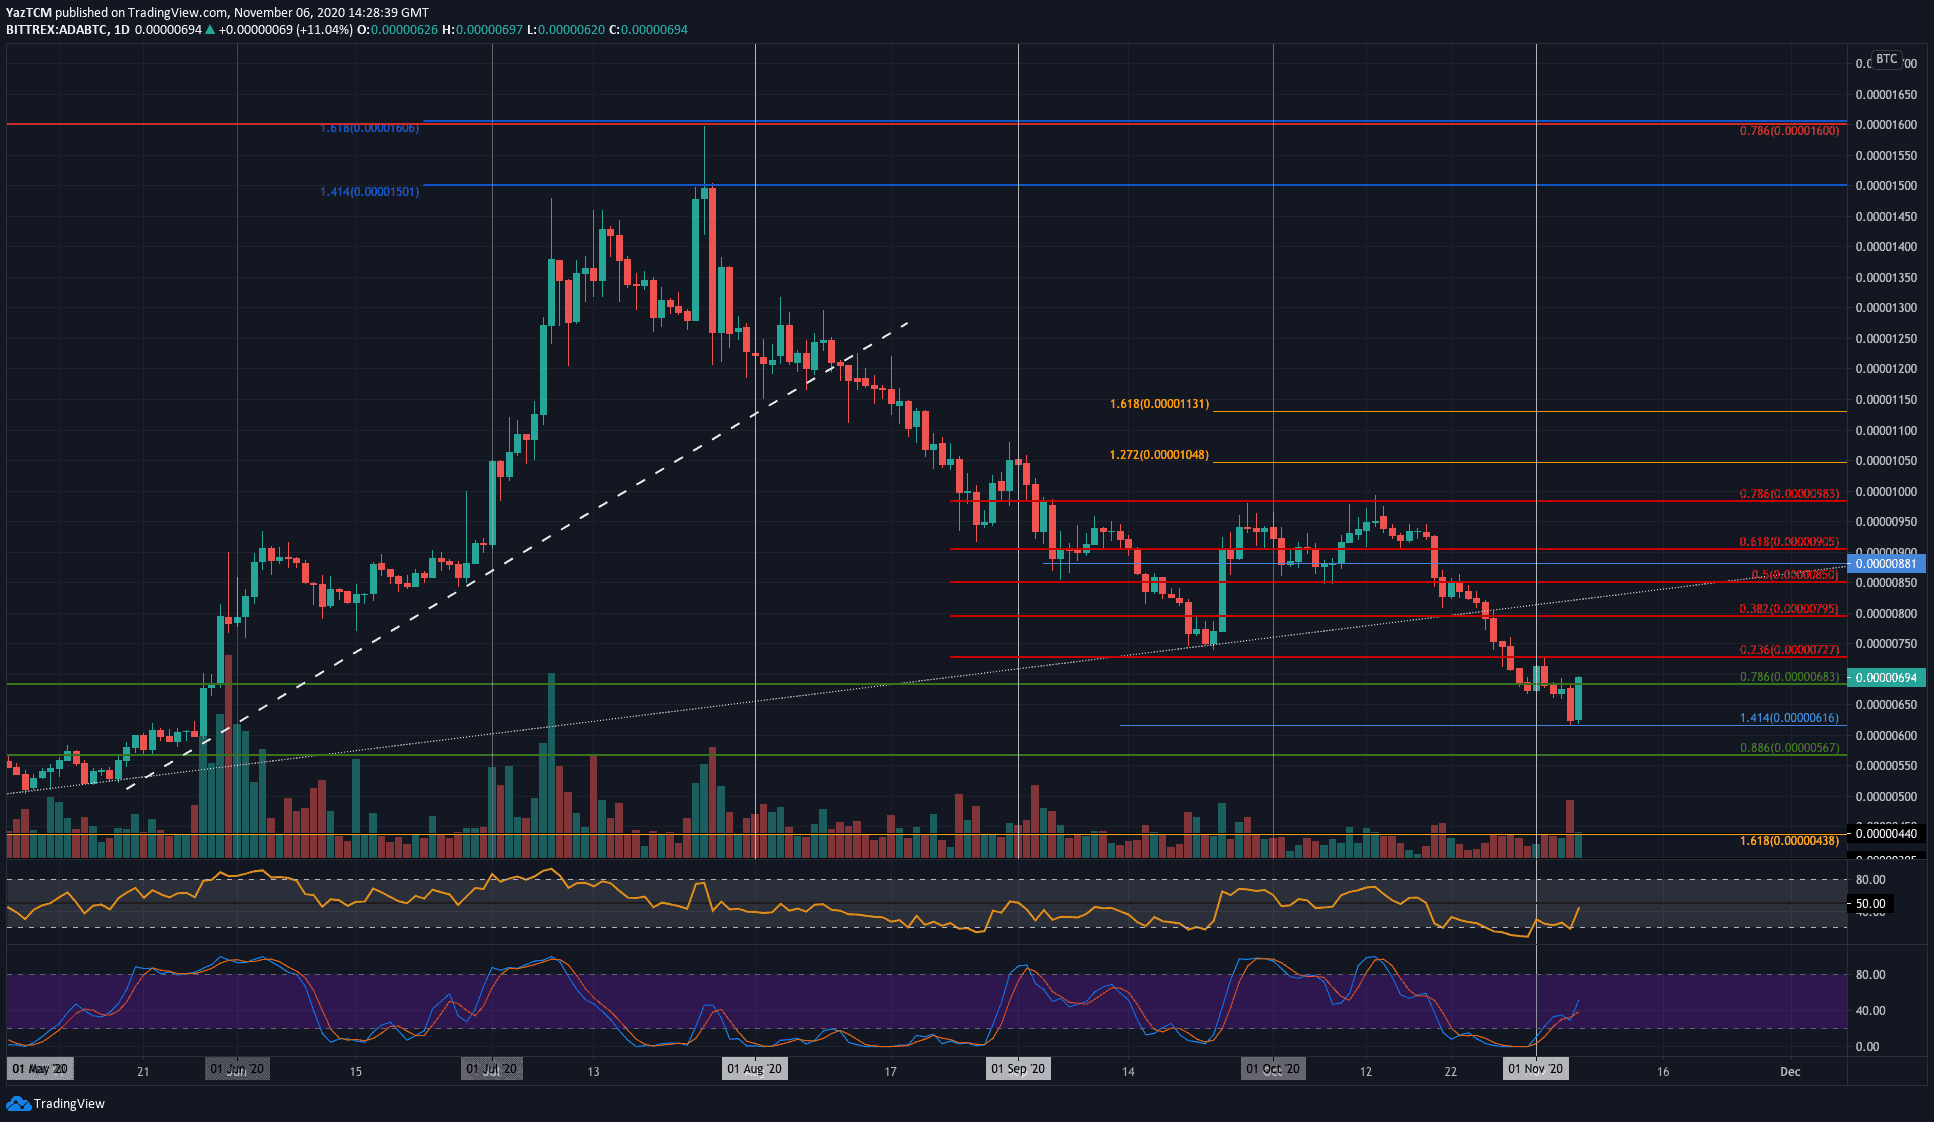
Against Bitcoin, ADA started the week at around the 685 SAT level. It did spike higher over the weekend to reach as high as 727 SAT but continued to fall throughout the week until support was met at 616 SAT (downside 1.414 Fib Extension) yesterday.
ADA rebounded from this support today to reach as high as 695 SAT.
Moving forward, if the bulls push higher, the first level of resistance lies at 727 SAT (bearish .236 Fib). Above this, resistance lies at 800 SAT, 850 SAT (bearish .5 Fib), and 905 SAT.
On the other side, the first level of support lies at 650 SAT. Beneath this, support lies at 616 SAT, 600 SAT, and 570 SAT.