Bitcoin The Bitcoin price surge continued this week and it managed to increase by 4.5% to reach ,60 at the time of this writing. The coin was trading slightly above ,000 last Friday and moved sideways along this level over the weekend. On Tuesday, Bitcoin started to surge higher as broke resistance at ,415, climbed above ,500, and reached the resistance at ,815 (1.272 Fib Extension). The bulls could not close a daily candle above this resistance, which led to Bitcoin dropping as low as ,000 on Wednesday. Since then, Bitcoin has traded sideways in a wide range between ,815 and ,000. Looking ahead, if the buyers push higher again, the first level of resistance lies at ,500. Following this, resistance lies at ,815, ,000, ,190, and ,500
Topics:
Yaz Sheikh considers the following as important: Binance Coin (BNB) Price, Bitcoin (BTC) Price, BNBBTC, bnbusd, BTC Analysis, BTCEUR, BTCGBP, btcusd, btcusdt, Chainlink (LINK) Price, ETH Analysis, ETHBTC, Ethereum (ETH) Price, ethusd, LINKBTC, LINKUSD, Market Updates, Price Analysis, Ripple (XRP) Price, XRP Analysis, xrpbtc, xrpusd
This could be interesting, too:
Mandy Williams writes Bitcoin ETFs Record Over .6B in Outflows in the Past 2 Weeks
Chayanika Deka writes Bitcoin Whales Offload 6,813 BTC as Selling Pressure Mounts
Wayne Jones writes Bitcoin Sentiment Hits 2022 Lows as Fear & Greed Index Falls to 10
Dimitar Dzhondzhorov writes Is a Major Ripple v. SEC Lawsuit Development Expected This Week? Here’s Why
Bitcoin
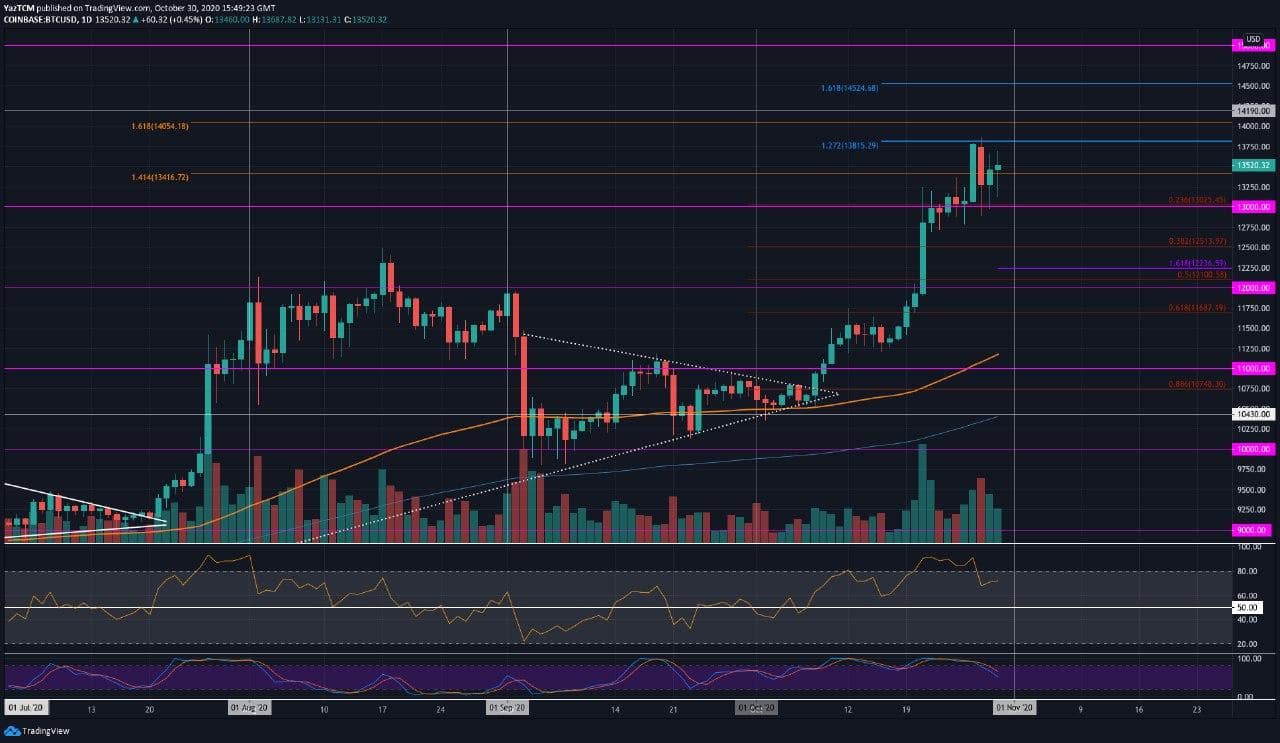
The Bitcoin price surge continued this week and it managed to increase by 4.5% to reach $13,60 at the time of this writing. The coin was trading slightly above $13,000 last Friday and moved sideways along this level over the weekend.
On Tuesday, Bitcoin started to surge higher as broke resistance at $13,415, climbed above $13,500, and reached the resistance at $13,815 (1.272 Fib Extension). The bulls could not close a daily candle above this resistance, which led to Bitcoin dropping as low as $13,000 on Wednesday.
Since then, Bitcoin has traded sideways in a wide range between $13,815 and $13,000.
Looking ahead, if the buyers push higher again, the first level of resistance lies at $13,500. Following this, resistance lies at $13,815, $14,000, $14,190, and $14,500 (1.618 Fib Extension).
On the other side, if the sellers push lower, the first level of strong support lies at $13,000 (.236 Fib Retracement). Added support then lies at $12,750, $12,500 (.382 FIb Retracement), $12,236 (downside 1.618 Fib Extension), $12,100 (.5 Fib), and $12,000.
Ethereum
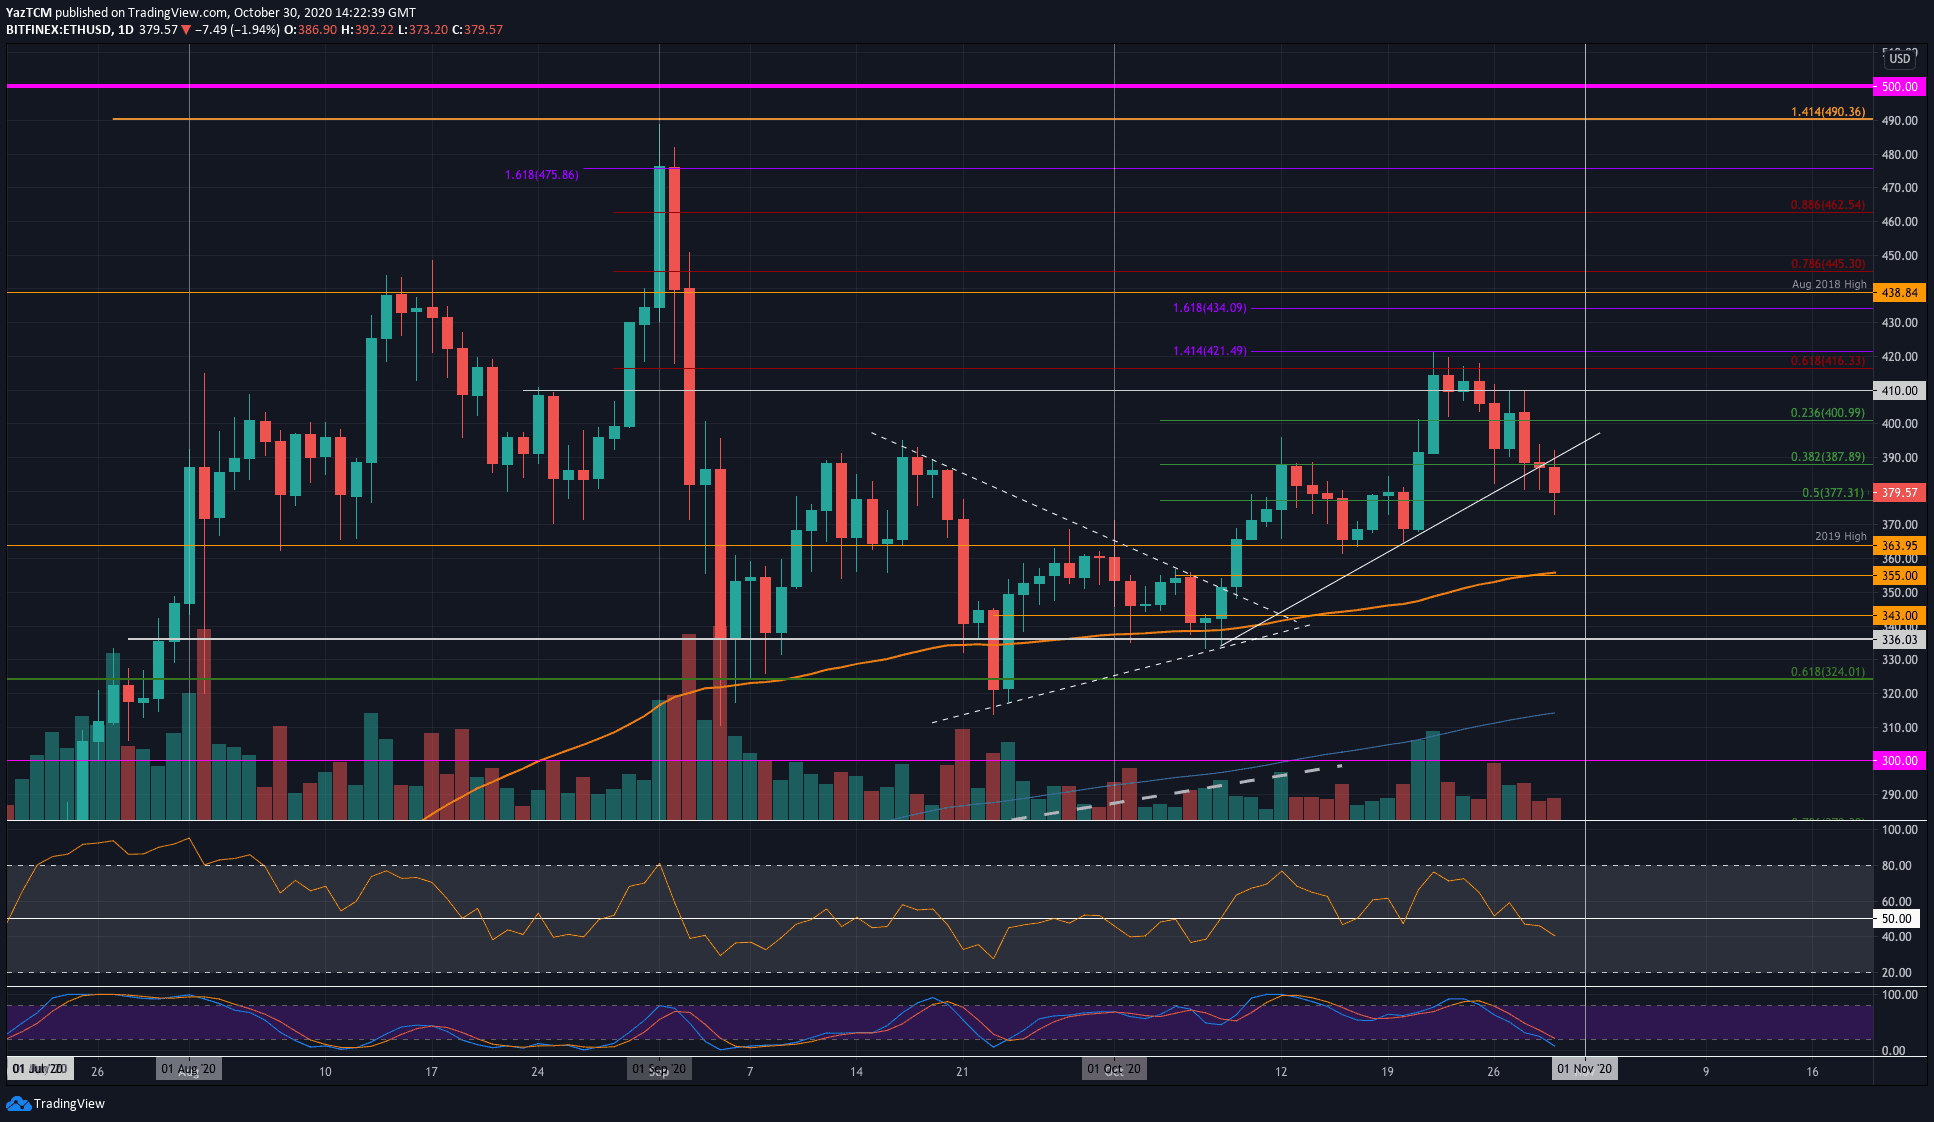
Ethereum saw a sharp 8.3% price drop this week as it falls into the $380 support (.5 Fib Retracement). Last Friday, Ethereum struggled to break above the resistance at $416 – provided by a bearish .618 Fib Retracement. It rolled over from here and started to head lower during the week as it fell beneath $400.
Initially, Ethereum managed to find support at $389 (.382 Fib Retracement). However, the sellers broke past this support today as it plummeted into the $377 level (.5 Fib Retracement).
Moving forward, if the sellers break beneath $377, the first level of support lies at $364 (2019 High). Beneath this, support lies at $355 (100-days EMA), $350, and $342.
On the other side, if the buyers can rebound from $377, resistance lies at $390, $400, $410, and $416.
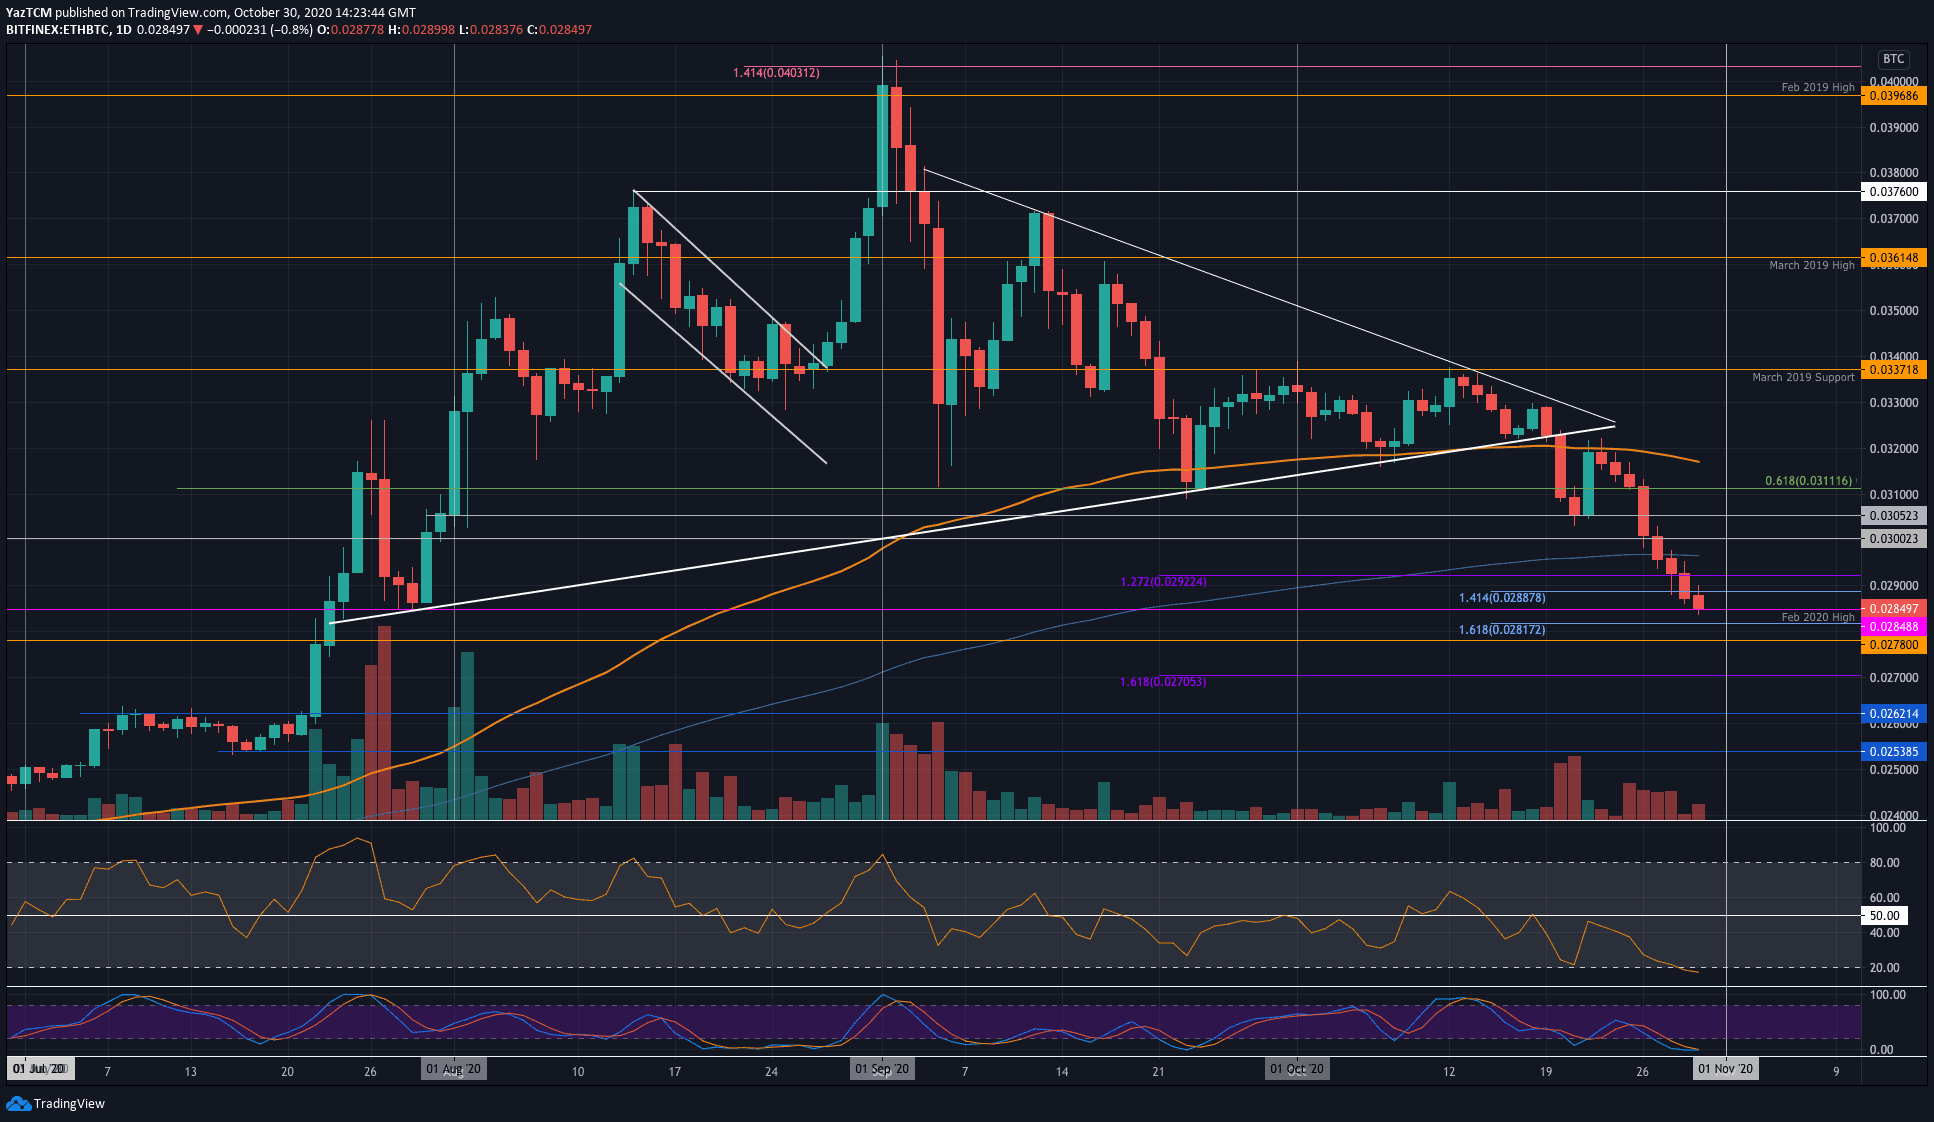
Against Bitcoin, Ethereum has struggled heavily this week as it hits as low as 0.0284 BTC(Feb 2020 Highs). The coin was trading above 0.031 BTC at the start of the week as it was trading at the 100-days EMA resistance. From there, ETH headed lower as it collapsed beneath both 0.031 BTC and 0.030 BTC in a couple of days.
The coin continued to plummet over the last few days as it dropped beneath the 200-days EMA and 0.029 BTC to reach the current support at 0.0284 BTC.
Looking ahead, if the selling continues to break 0.0284 BTC, support lies at 0.0281 BTC, 0.0278 BTC, and 0.027 BTC.
On the other side, resistance is first expected at 0.029 BTC. This is followed by resistance at the 200-days EMA, 0.03 BTC, and 0.0305 BTC.
Ripple
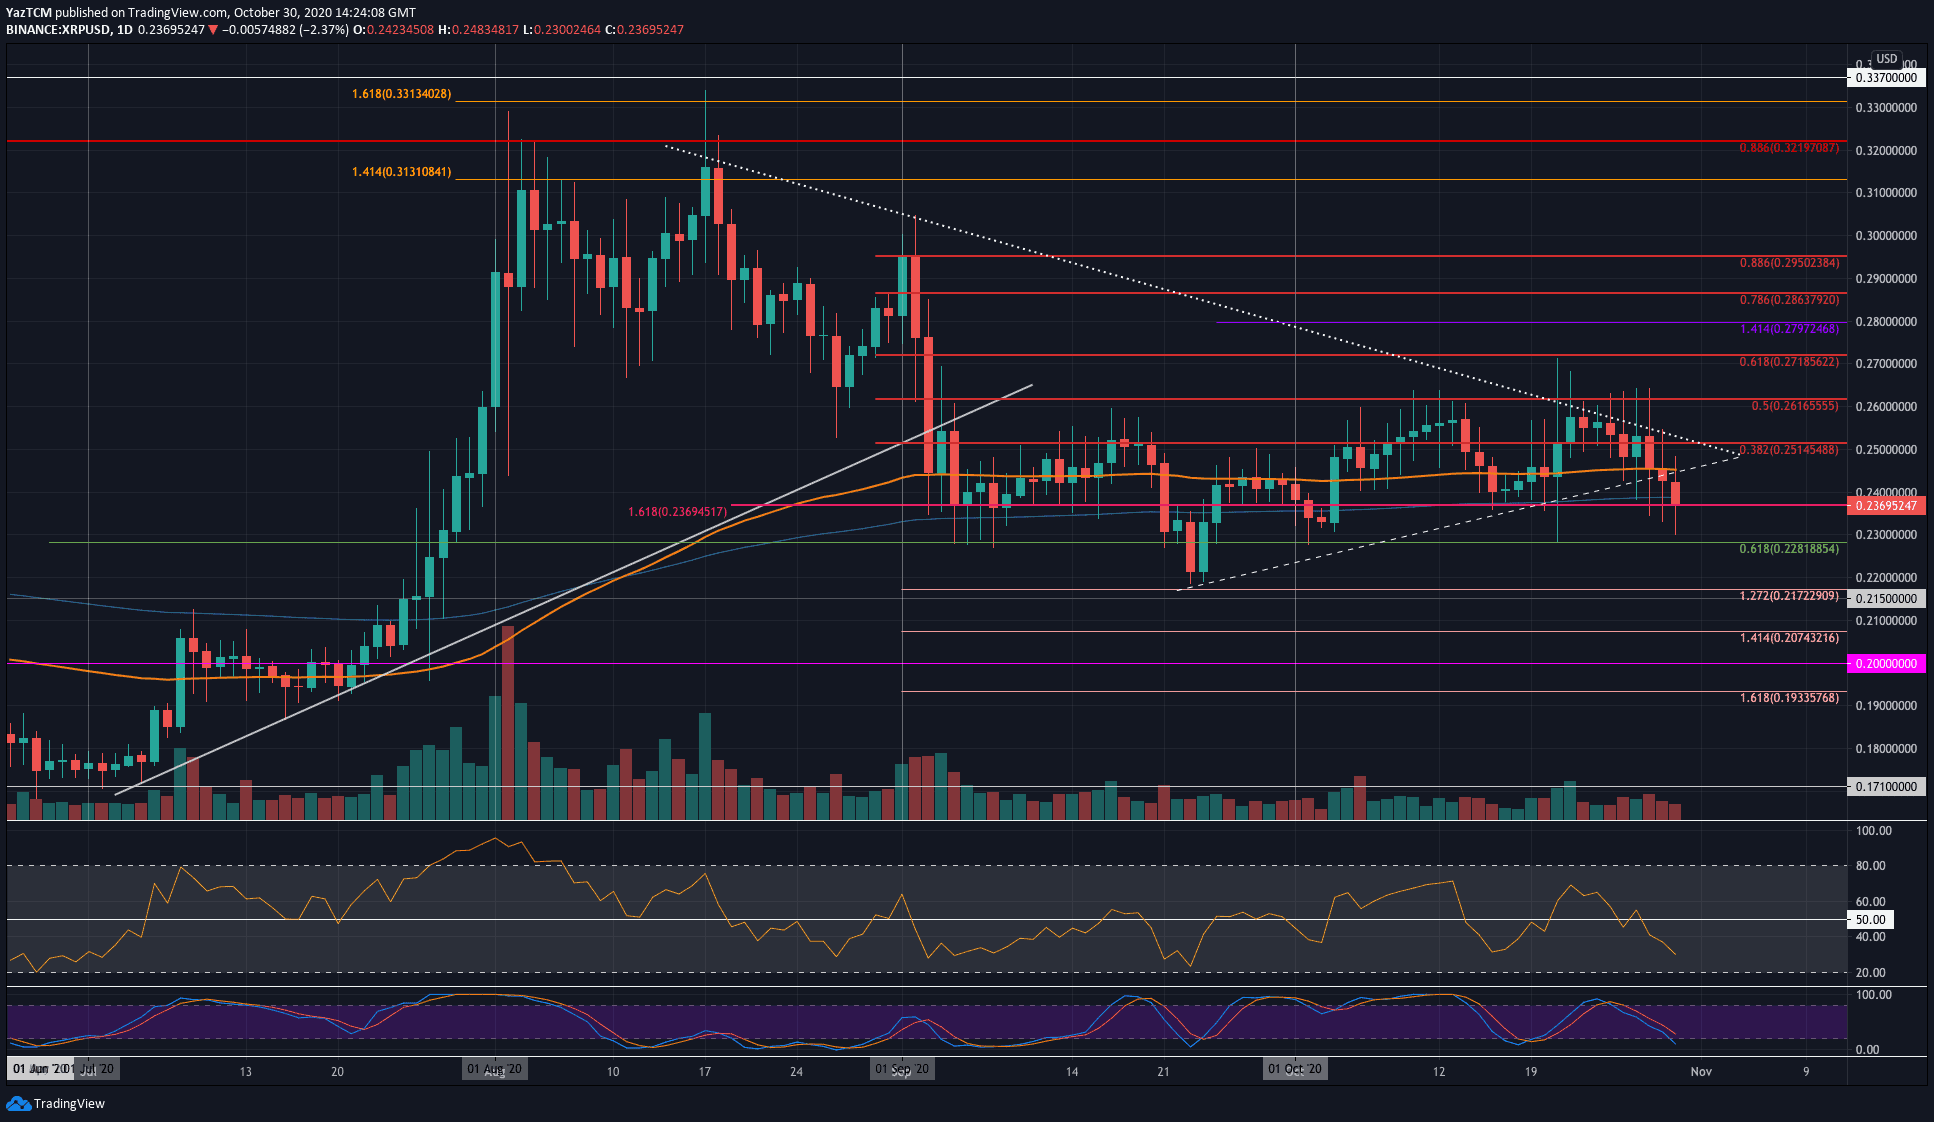
Ripple also saw quite a sharp 7.8% price fall this week as the coin drops beneath the 200-days EMA into the $0.237 level. Last Friday, XRP was trying to overcome resistance at a falling trend line but could not do so. As a result, the coin headed lower throughout the week and broke beneath the 100-days EMA yesterday.
Today, XRP continued lower to break beneath a rising trend line (the lower boundary of a triangle) to drop beneath the 200-days EMA and hit the current $0.237 support. XRP spiked as low as $0.23 today, but the buyers have since pushed the price higher.
Moving forward, if the selling continues beneath $0.237, support initially lies at $0.23. This is followed by support at $0.228 (.618 Fib), $0.22, and $0.217.
On the other side, the first level of resistance lies at $0.24. Added resistance lies at $0.245 (100-days EMA), $0.251 (bearish .382 Fib), and $0.261 (bearish .5 Fib).
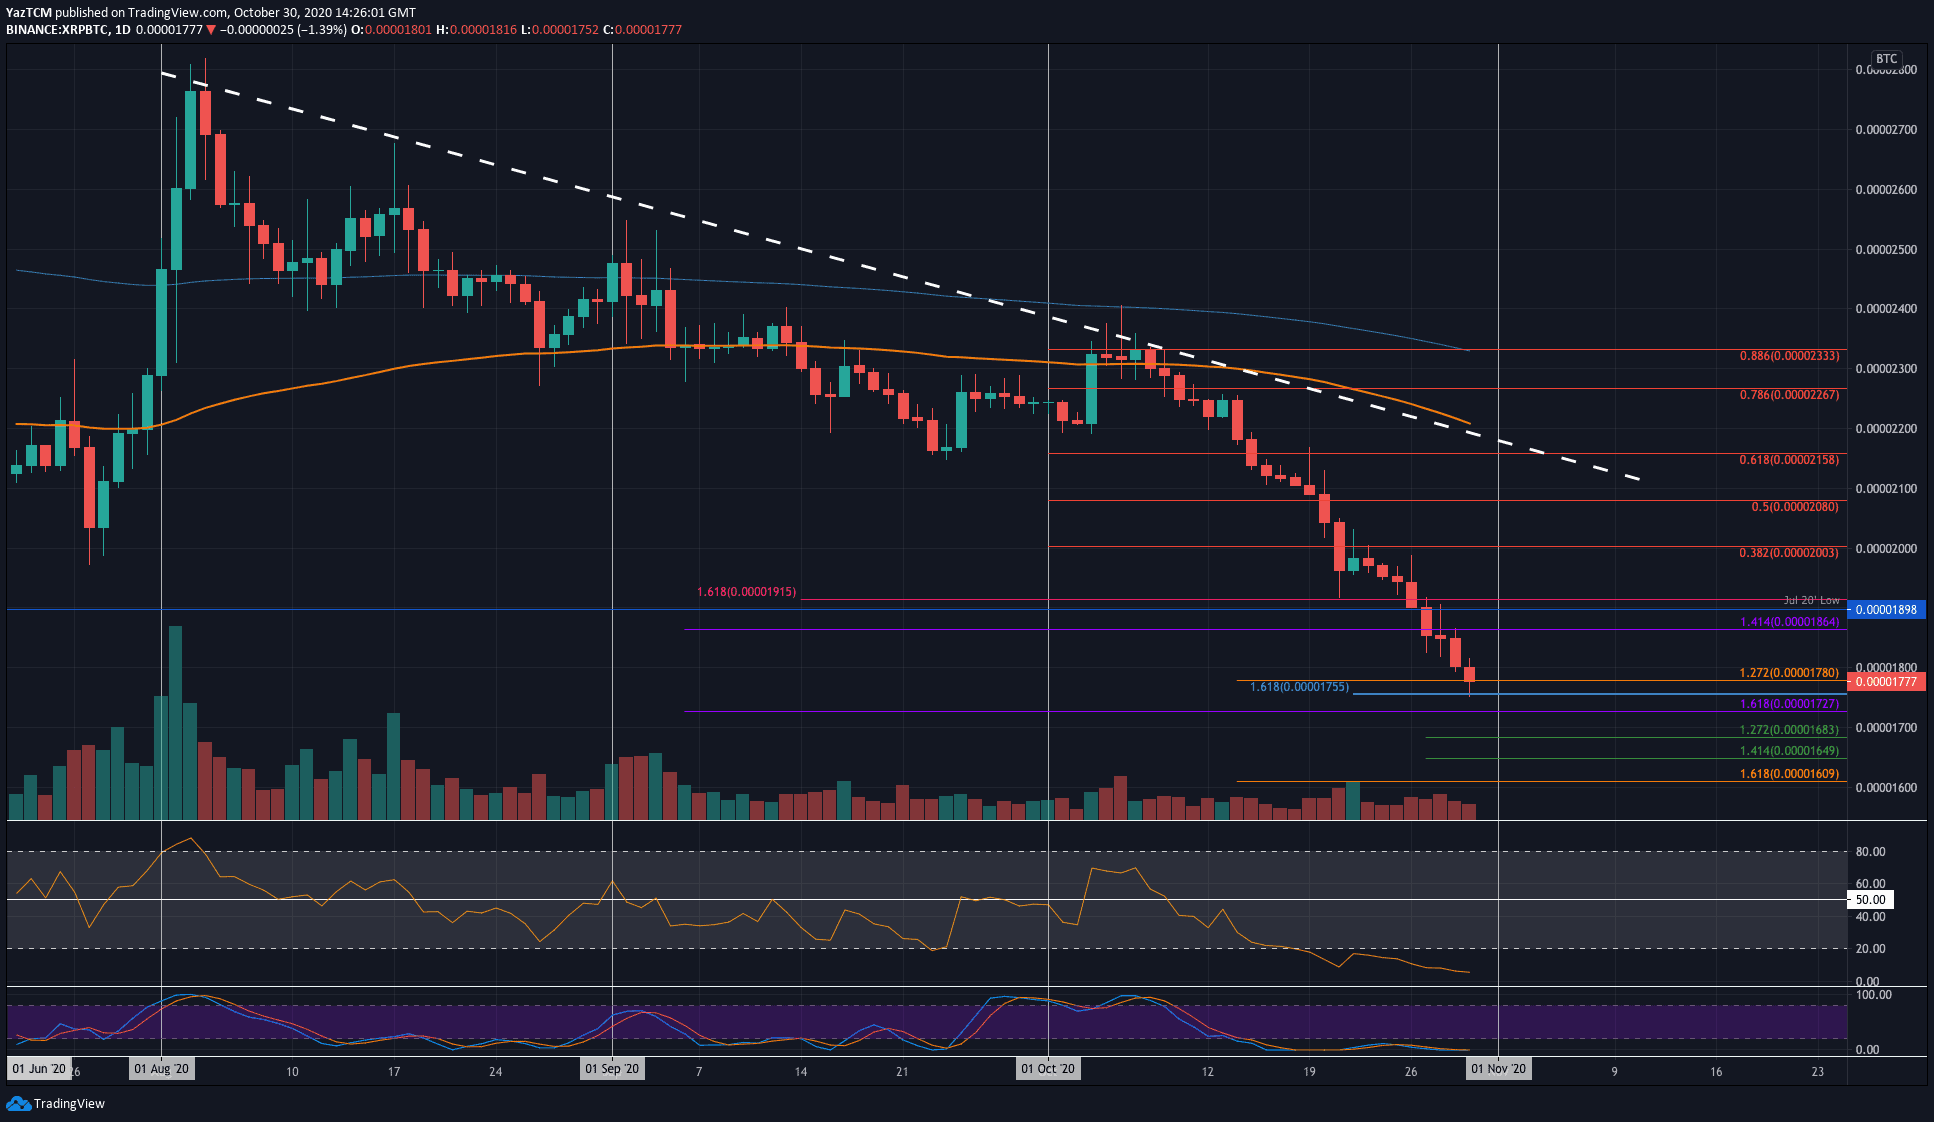
XRP is currently in a terrible downward spiral against BTC and reached lows that have not been since December 2017 this week. It was trying to reclaim the resistance at 2000 SAT last Friday but failed to do so and proceeded to plummet over the weekend.
The price collapse continued throughout the week as XRP reached as low as 1755 SAT today. The buyers have since pushed it higher slightly to trade near 1780 SAT, but the situation is extremely bearish.
Looking ahead, it is likely that the selling will continue. If the sellers push beneath 1755 SAT, additional support is found at 1730 SAT, 1700 SAT, 1680 SAT, 1650 SAT, and 1600 SAT.
On the other side, resistance lies at 1800 SAT, 1865 SAT, and 1900 SAT.
Chainlink
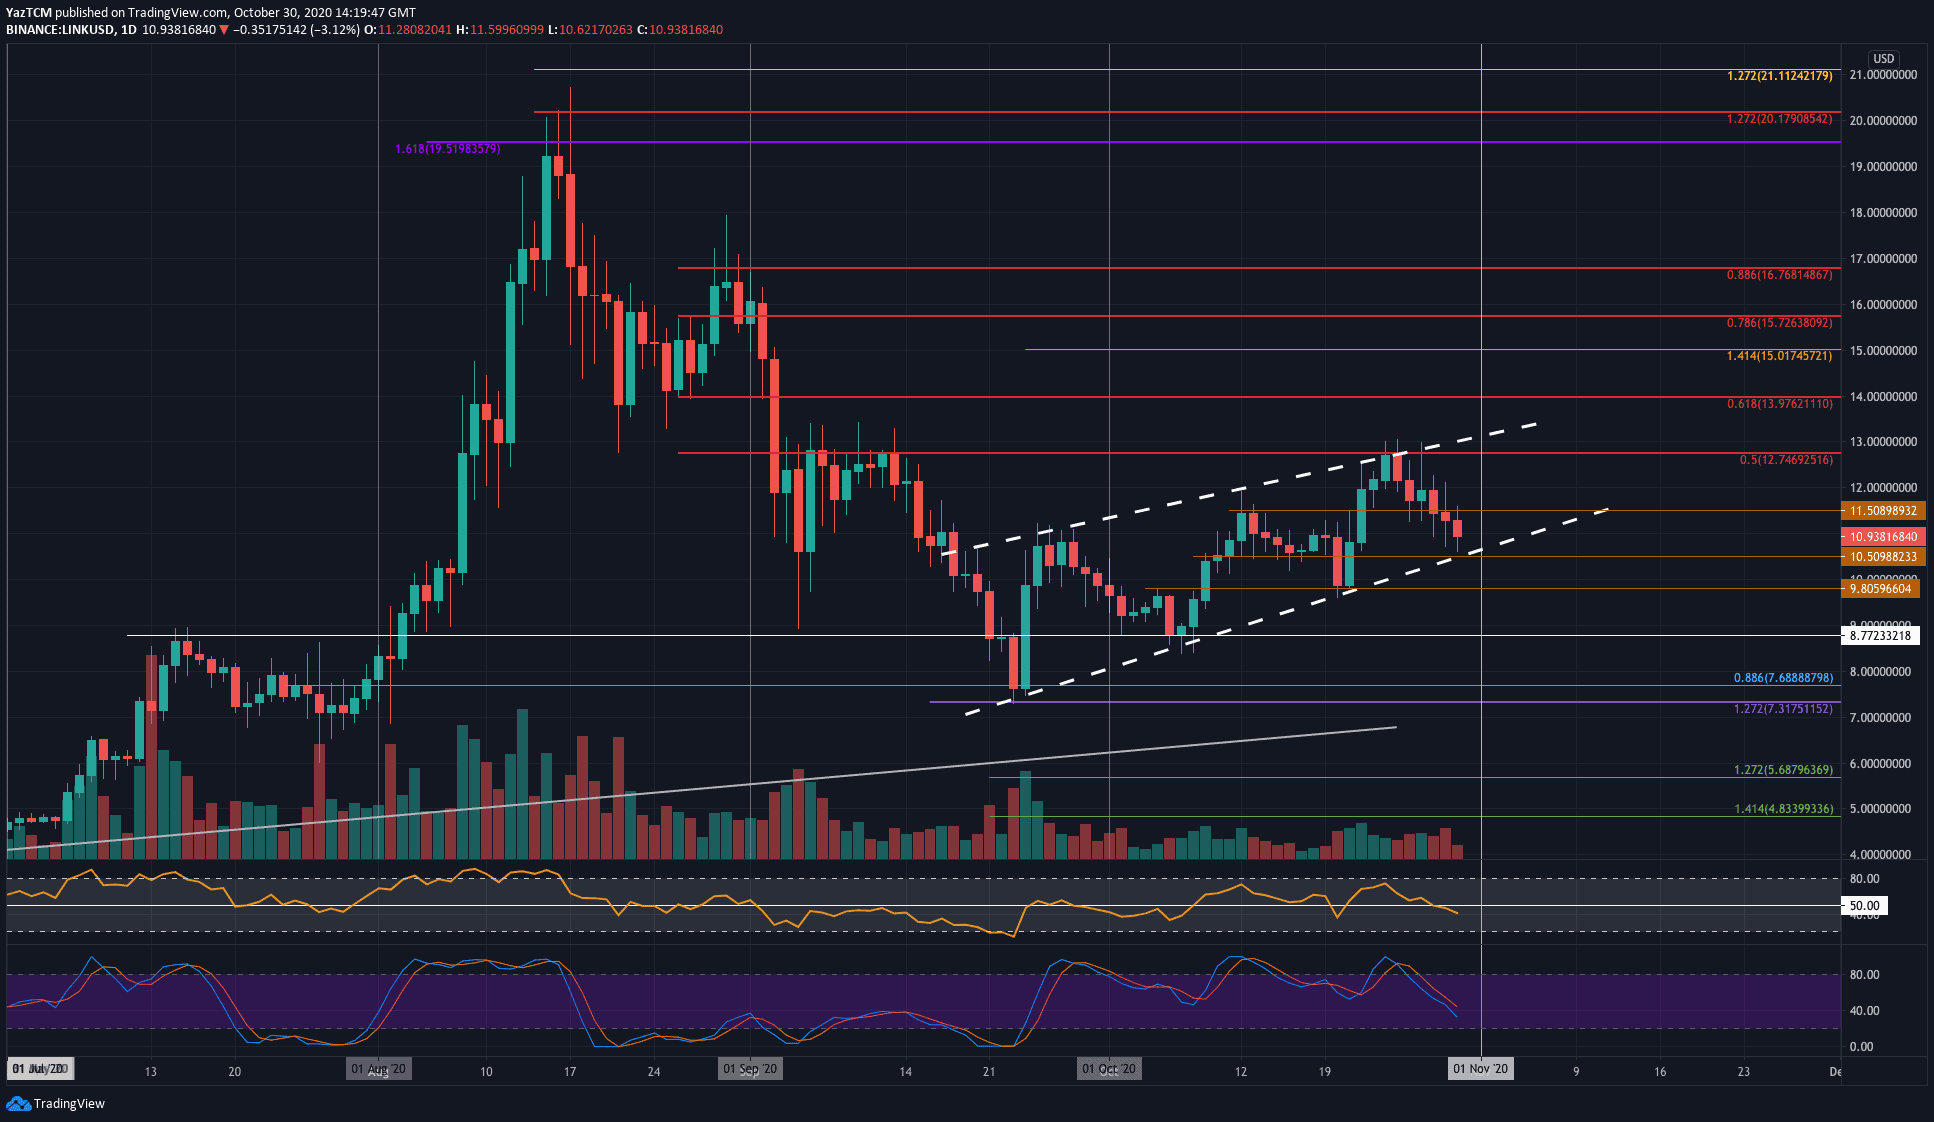
LINK saw an 8.6% price fall over the past week as it approaches the lower boundary of an ascending price channel. The coin was trading at the upper boundary of this price channel at the start of the week but was unable to break above it. A bearish .5 Fib Retracement further bolsters the upper boundary at $12.75.
As a result, LINK rolled over and started to head lower throughout the week as it broke back beneath $11.50 to reach the current $10.95 level.
Looking ahead, if the bears push LINK lower, the first level of support lies at $10.50 – the lower boundary of the price channel. If the sellers break beneath the channel, support lies at $10, $9.80, $9.00, and $8.77.
On the other side, if the buyers can rebound at the lower boundary, resistance lies at $11.50, $12, and $12.75 (bearish .5 Fib Retracement).
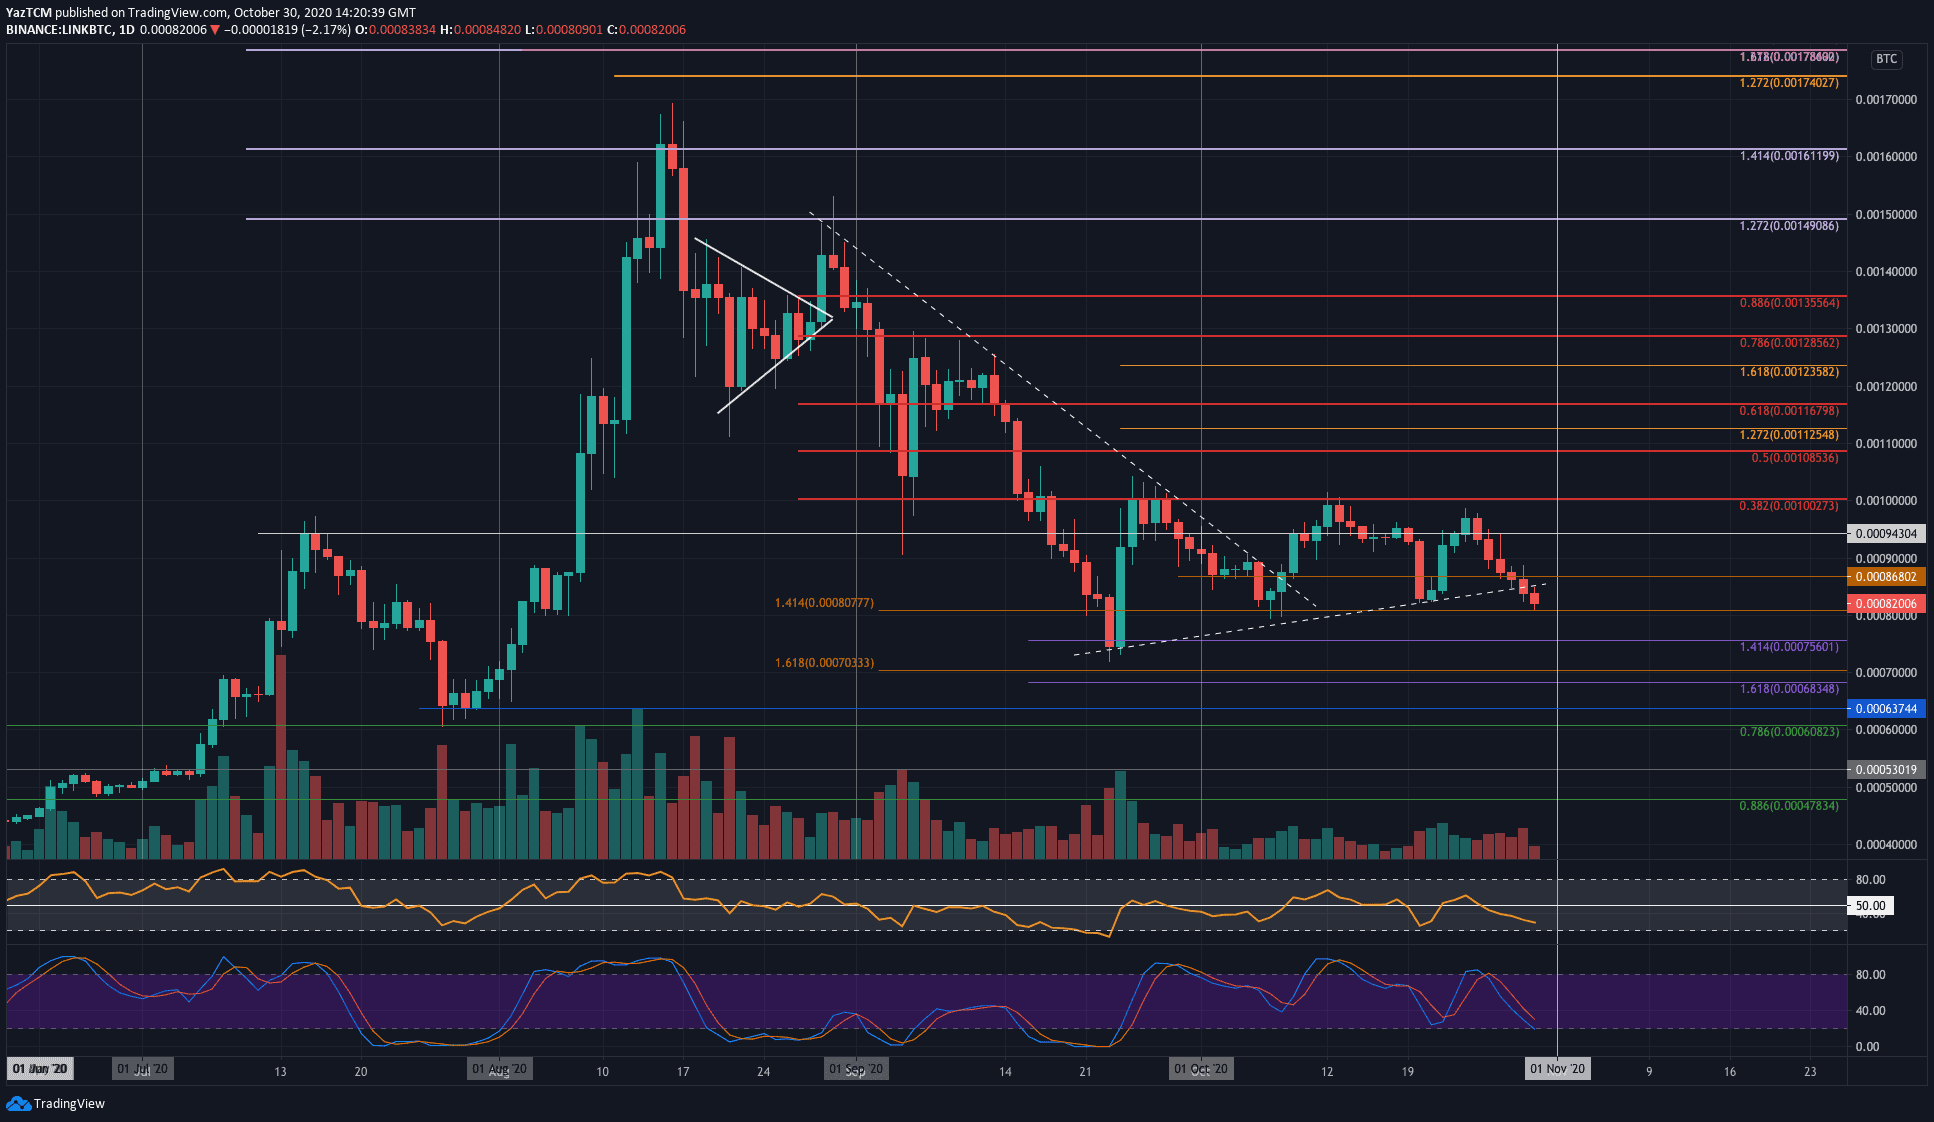
Against Bitcoin, LINK has also been falling this week. It was trading near 100,000 SAT last Friday but started to head lower from here. It dropped beneath 90,000 SAT throughout the week and fell beneath a rising trend line yesterday to hit 80,777 SAT today.
Moving forward, if the sellers break beneath 80,777 SAT the first level of support lies at 80,000 SAT. Beneath this, support is found at 75,600 SAT (downside 1.414 Fib Extension), 70,000 SAT, 68,400 SAT, and 60,000 SAT (.786 Fib Retracement).
On the other side, resistance lies at 86,800 SAT. Above this, resistance is expected at 90,000 SAT, 94,300 SAT, and 100,000 SAT (bearish .382 Fib Retracement).
Binance Coin
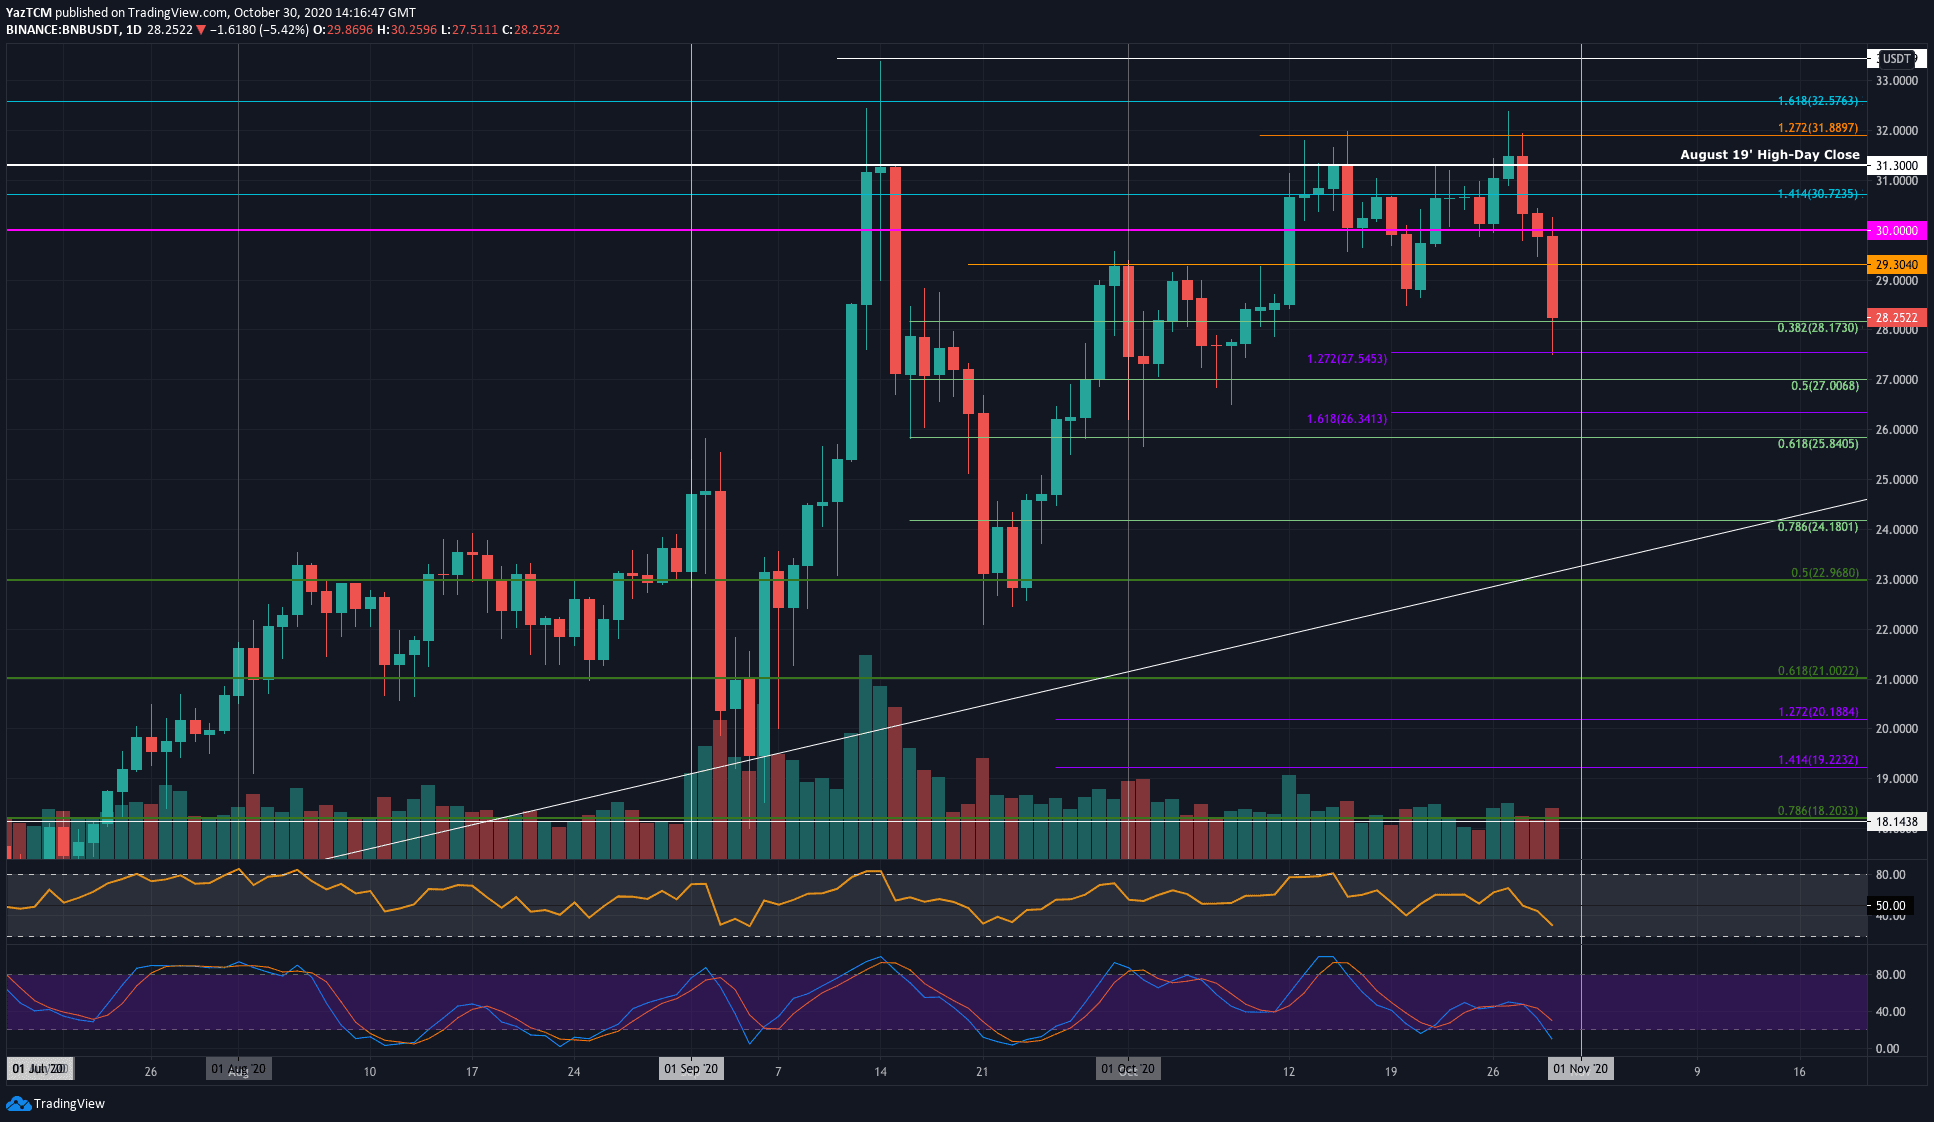
BNB also suffered a 7.6% price fall this week as it drops into the $28.17 support (.382 Fib Retracement). BNB managed to climb above $32 on Tuesday, but the sellers quickly stepped in to push the coin lower.
Today, BNB fell sharply beneath $30 and continued to fall until support was found at $27.54 (downside 1.272 Fib Extension). It has rebounded from here and is now trading at $28.17 (.382 Fib).
Looking ahead, if the bulls can continue to rebound from the current support, the first level of resistance lies at $29.30. This is followed by resistance at $30, $30.72, $31.30, and $32.
On the other side, if the sellers push beneath $28.17, support lies at $27.55, $27 (.5 Fib), $26.34 (fownside 1.618 Fib Extension), and $25.84 (.618 Fib).
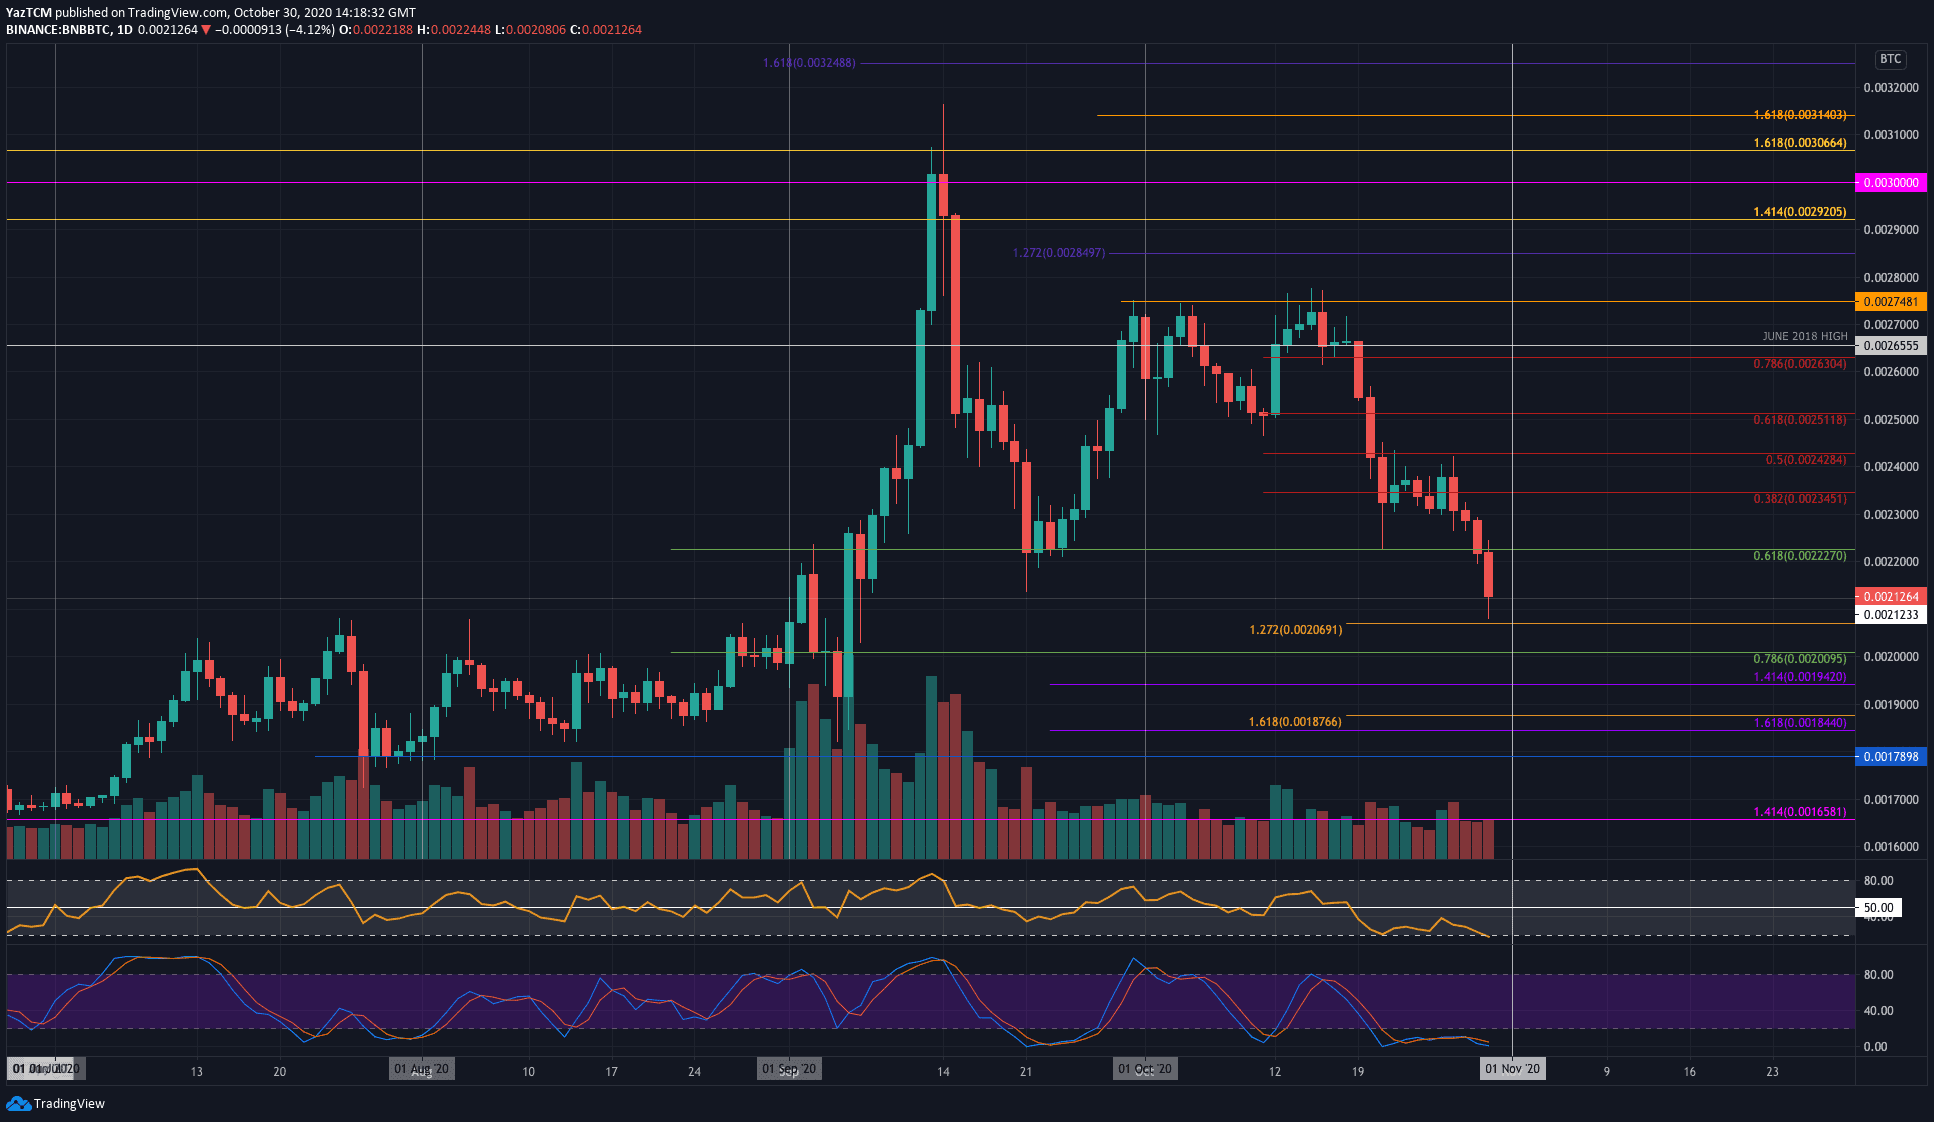
Against Bitcoin, BNB created a fresh October low today at the 0.00207 BTC level (downside 1.272 Fib Extension). The coin was trading at around 0.00236 BTC last Friday, and it pushed higher on Monday and Tuesday to reach as high as 0.00242 BTC. It was unable to break this resistance, which caused the coin to roll over and head lower.
Today, BNB dropped beneath the support at 0.0222 BTC (.618 Fib), and it dropped lower to reach the support at 0.00212 BTC – where it is currently trading.
Moving forward, if the sellers continue to push lower, the first level of support lies at 0.00206 BTC (downside 1.272 Fib Extension). Following this, support is found at 0.002 BTC (.786 Fib), 0.00194 BTC, and 0.0019 BTC.
Resistance is expected at 0.0022 BTC, 0.0023 BTC, and 0.00235 BTC.