BitcoinBitcoin saw a 5.6% price increase over the past seven days as it finally breaks above the ,000. The cryptocurrency was trading within a symmetrical triangle pattern since mid-September and struggled to break above this consolidation until yesterday.BTC was trading at the 100-days EMA last Friday as it rebounded from here and started to push higher. On Monday, the coin reached the upper boundary of the triangle and was rejected. This caused it to head toward the lower boundary on Tuesday as it rebounded once again.Bitcoin managed to push higher yesterday as it broke above the upper boundary of this consolidation pattern. It continued today to reach the current resistance at around ,130 (bearish .5 Fib Retracement).If the bulls break ,130, resistance is expected at ,200.
Topics:
Yaz Sheikh considers the following as important: BCHBTC, bchusd, Bitcoin (BTC) Price, Bitcoin Cash (BCH) Price, BTCEUR, BTCGBP, btcusd, btcusdt, ETH Analysis, ETHBTC, Ethereum (ETH) Price, ethusd, Market Updates, Monero (XMR) Price, Price Analysis, Ripple (XRP) Price, XMRBTC, XMRUSD, XRP Analysis, xrpbtc, xrpusd
This could be interesting, too:
Mandy Williams writes Bitcoin ETFs Record Over .6B in Outflows in the Past 2 Weeks
Chayanika Deka writes Bitcoin Whales Offload 6,813 BTC as Selling Pressure Mounts
Wayne Jones writes Bitcoin Sentiment Hits 2022 Lows as Fear & Greed Index Falls to 10
Dimitar Dzhondzhorov writes Is a Major Ripple v. SEC Lawsuit Development Expected This Week? Here’s Why
Bitcoin
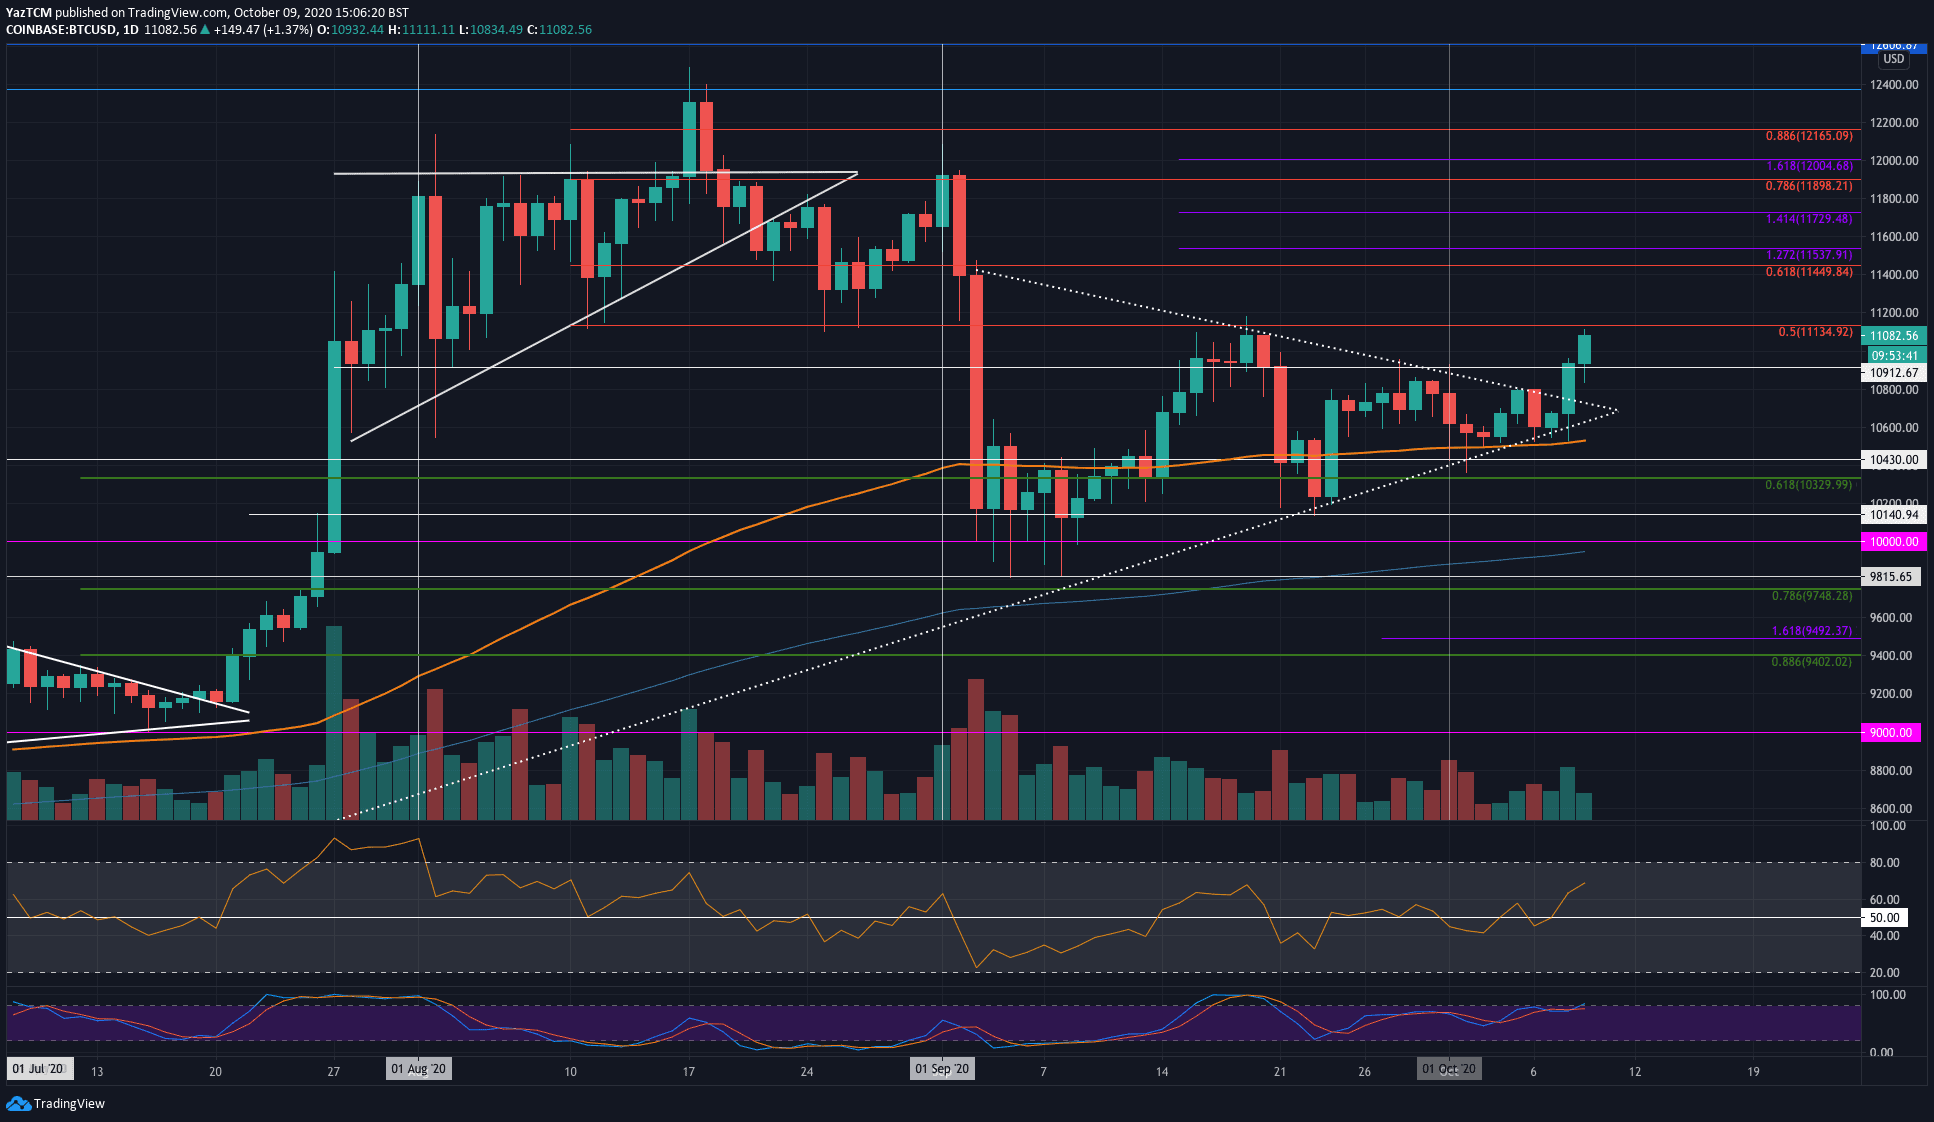
Bitcoin saw a 5.6% price increase over the past seven days as it finally breaks above the $11,000. The cryptocurrency was trading within a symmetrical triangle pattern since mid-September and struggled to break above this consolidation until yesterday.
BTC was trading at the 100-days EMA last Friday as it rebounded from here and started to push higher. On Monday, the coin reached the upper boundary of the triangle and was rejected. This caused it to head toward the lower boundary on Tuesday as it rebounded once again.
Bitcoin managed to push higher yesterday as it broke above the upper boundary of this consolidation pattern. It continued today to reach the current resistance at around $11,130 (bearish .5 Fib Retracement).
If the bulls break $11,130, resistance is expected at $11,200. Following this, resistance lies at $11,450 (bearish .618 Fib), $11,540 (1.272 Fib Extension), $11,730 (1.414 Fib Extension), and $11,900 (bearish .786 Fib). The last level of resistance to mention lies at $12,000.
On the other side, if Bitcoin falls beneath $11,000, the first support level lies at $10,920. Beneath this, support lies at $10,800, $10,600, and $10,525 (100-day EMA).
Ethereum
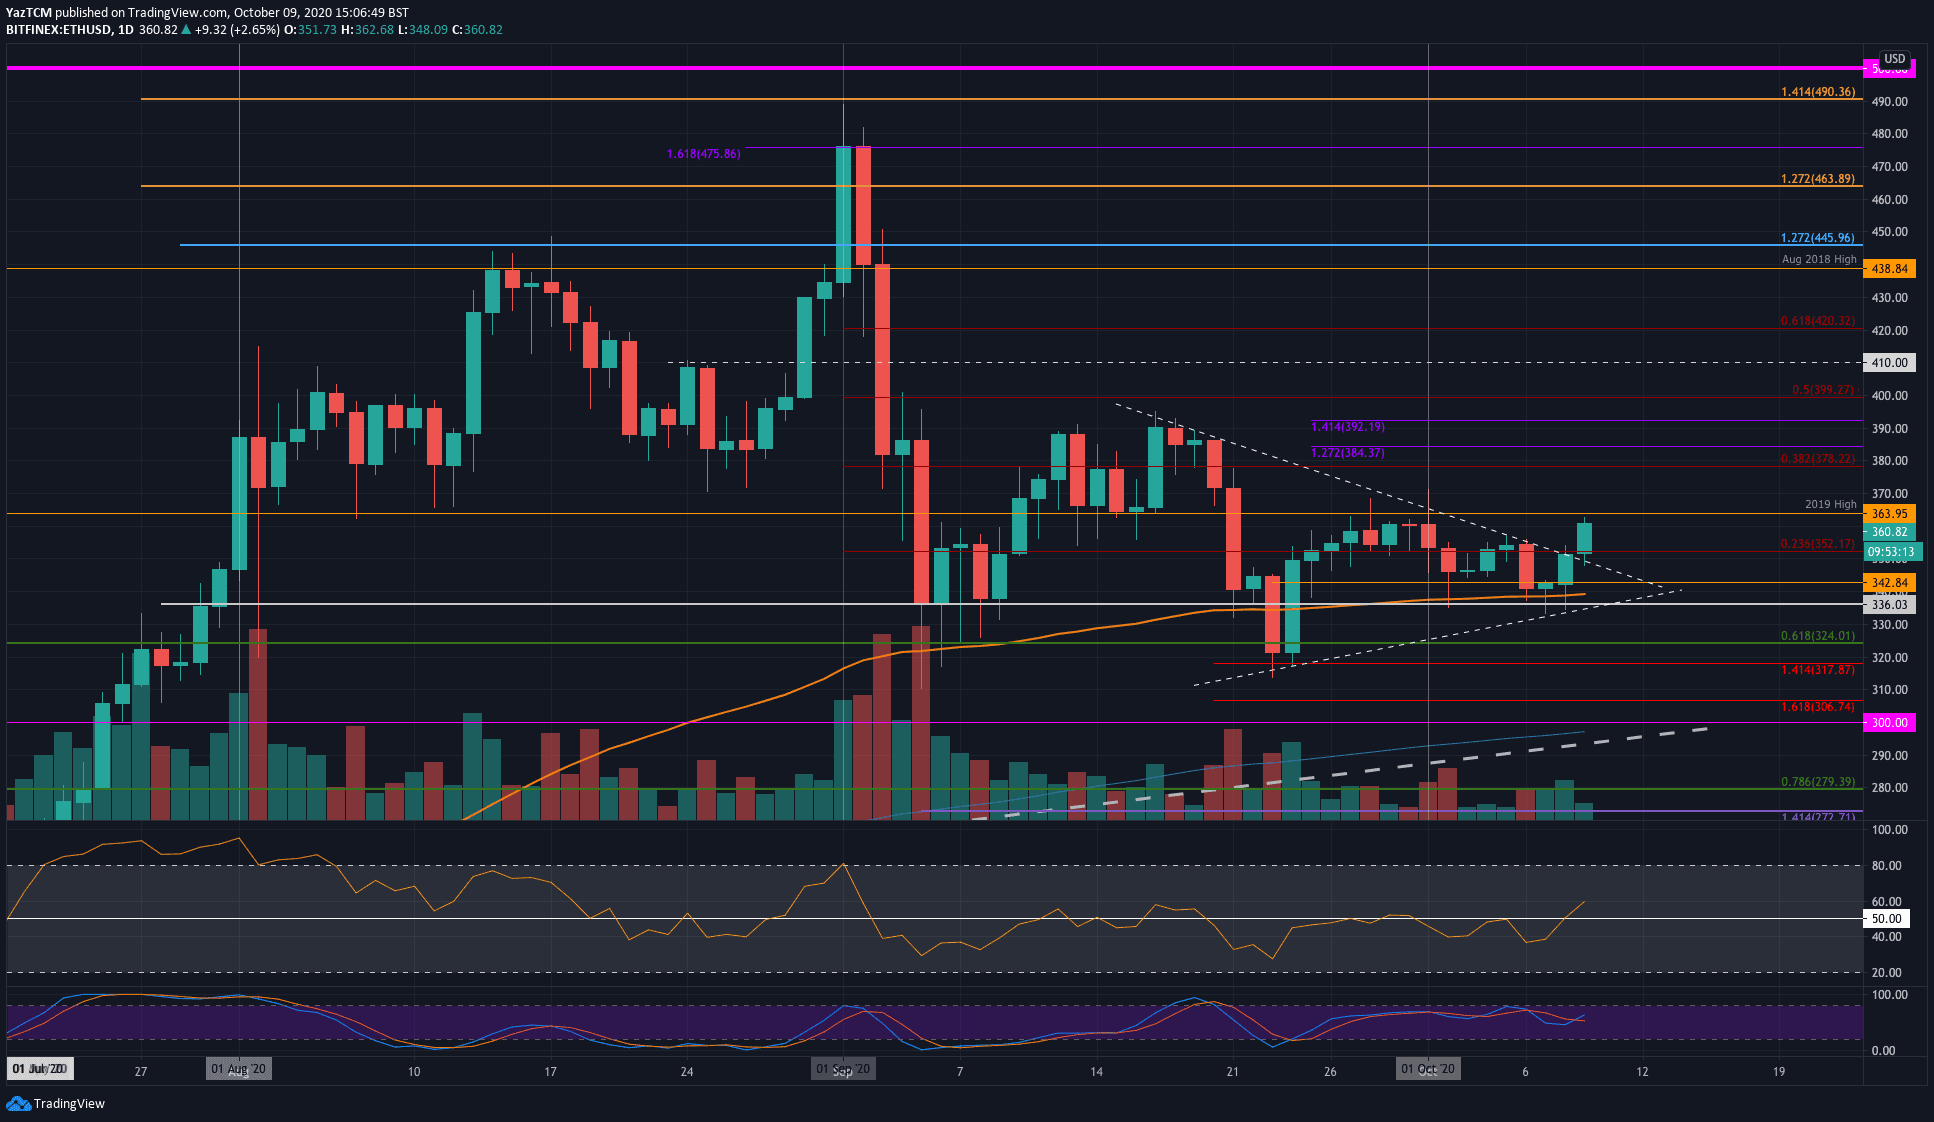
Ethereum also saw a 4.8% price rise this week as the coin reached the $360 level today. The cryptocurrency was also trading in a short term symmetrical triangle pattern. Still, the price increase seen today allowed the coin to break above the upper boundary and head back toward the 2019 highs.
The cryptocurrency had found support at the 100-days EMA earlier in the week, which allowed ETH to rebound and break above the consolidation phase with the bullish momentum entering the market.
Looking ahead, if the buyers can break $364 (2019 Highs), resistance lies at $378 (bearish .382 Fib Retracement), $394, $392, and $400 (bearish .5 Fib Retracement). Beyond $400, additional resistance is found at $410, $420 (bearish .618 Fib), and $438 (August 2018 Highs).
On the other side, the first level of support lies at $350. Beneath this, support is located at $343, $336, and $320.
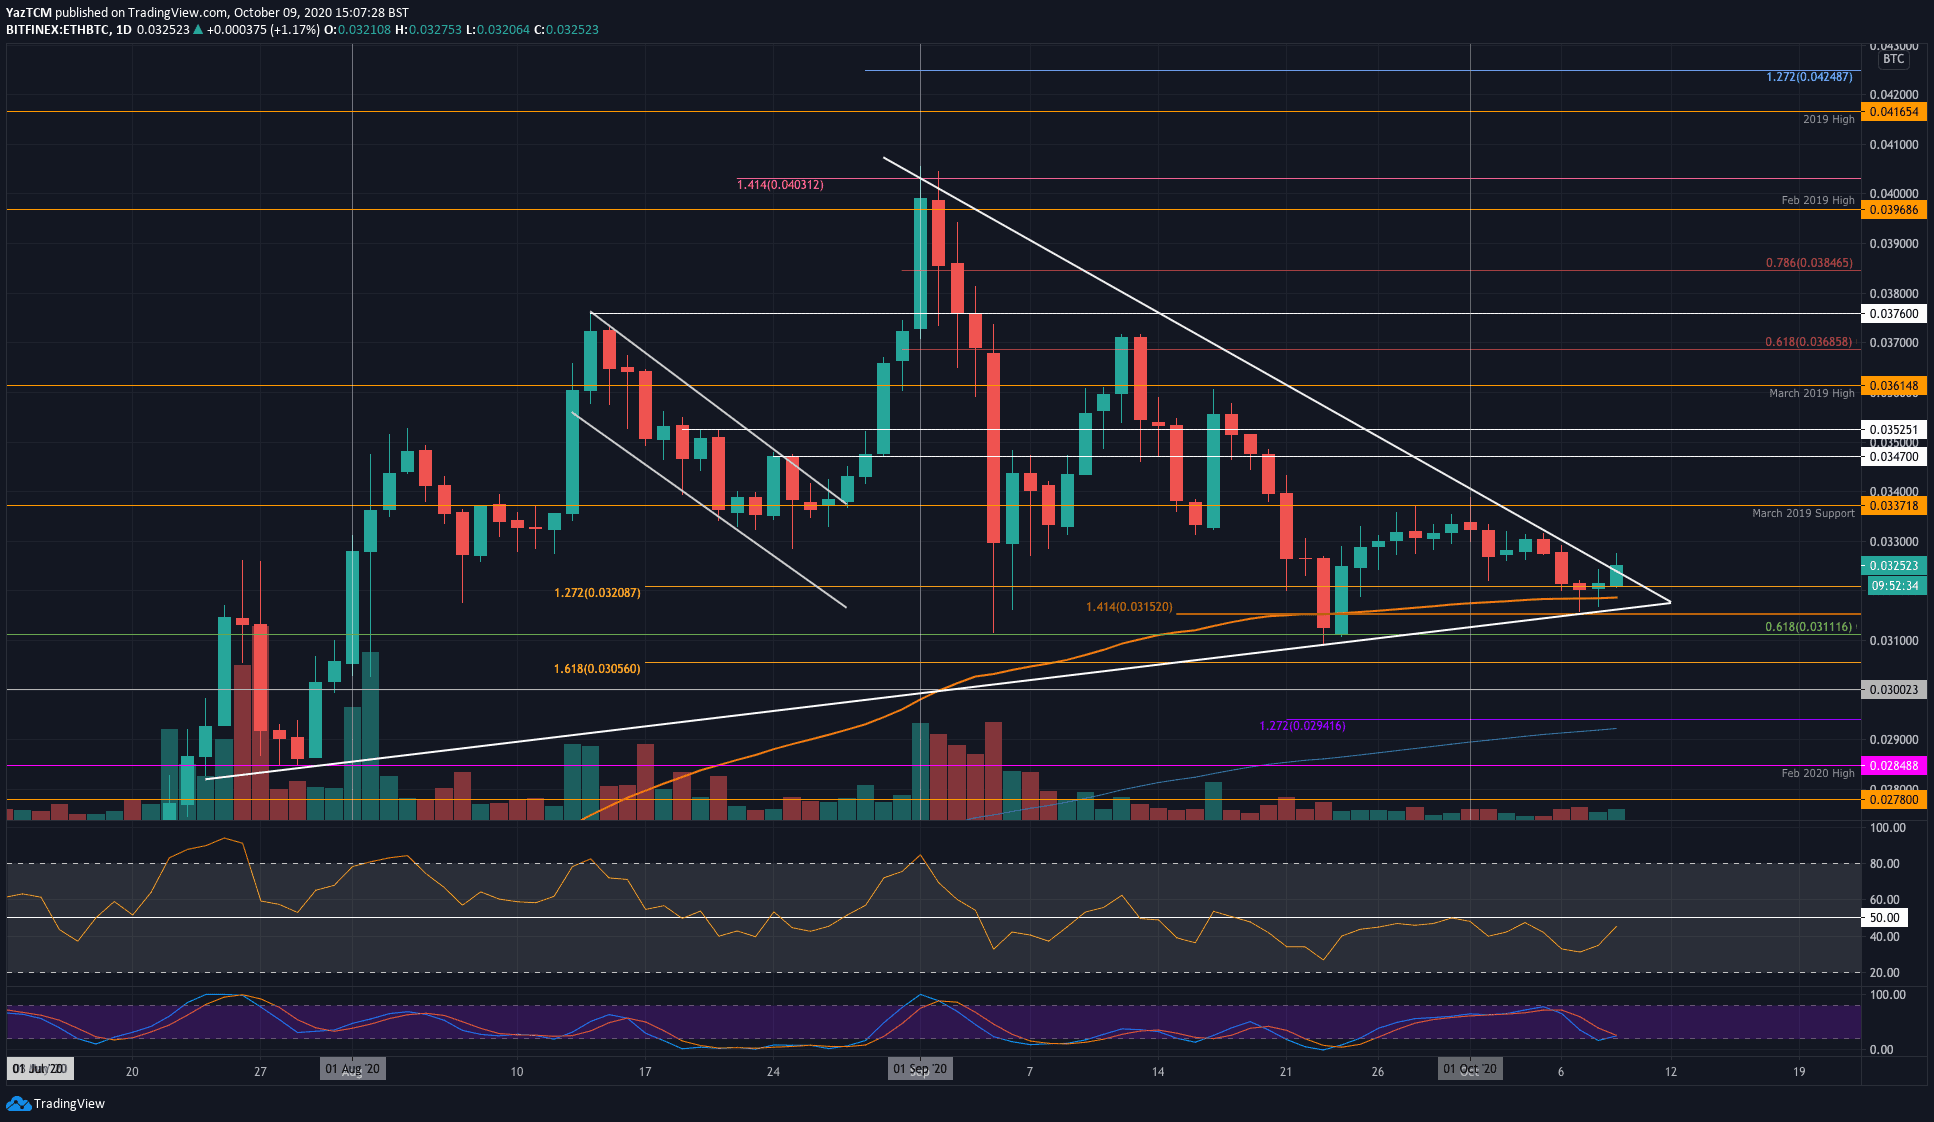
Against Bitcoin, Ethereum dropped by a small 1% over the past week. The coin found resistance at a 1-month-old falling trend line on Monday, which caused the coin to head lower. Luckily, it found support at the 0.0315 BTC level, which allowed the coin to rebound a couple of days ago.
Since bouncing, Ethereum pushed higher above 0.032 BTC and has reached 0.0325 BTC. It is in the process of breaking above the aforementioned falling trend line; however, we must wait for a daily closing candle to confirm the breakout.
Looking ahead, if the buyers push higher, resistance is first located at 0.033 BTC. This is followed by resistance at 0.0337 BTC (March 2019 Support – now resistance), 0.034 BTC, and 0.0347 BTC.
On the other side, the first level of support lies at 0.032 BTC. Beneath this, support is found at 0.0315 BTC, and 0.0311 BTC (.618 Fib Retracement).
Ripple
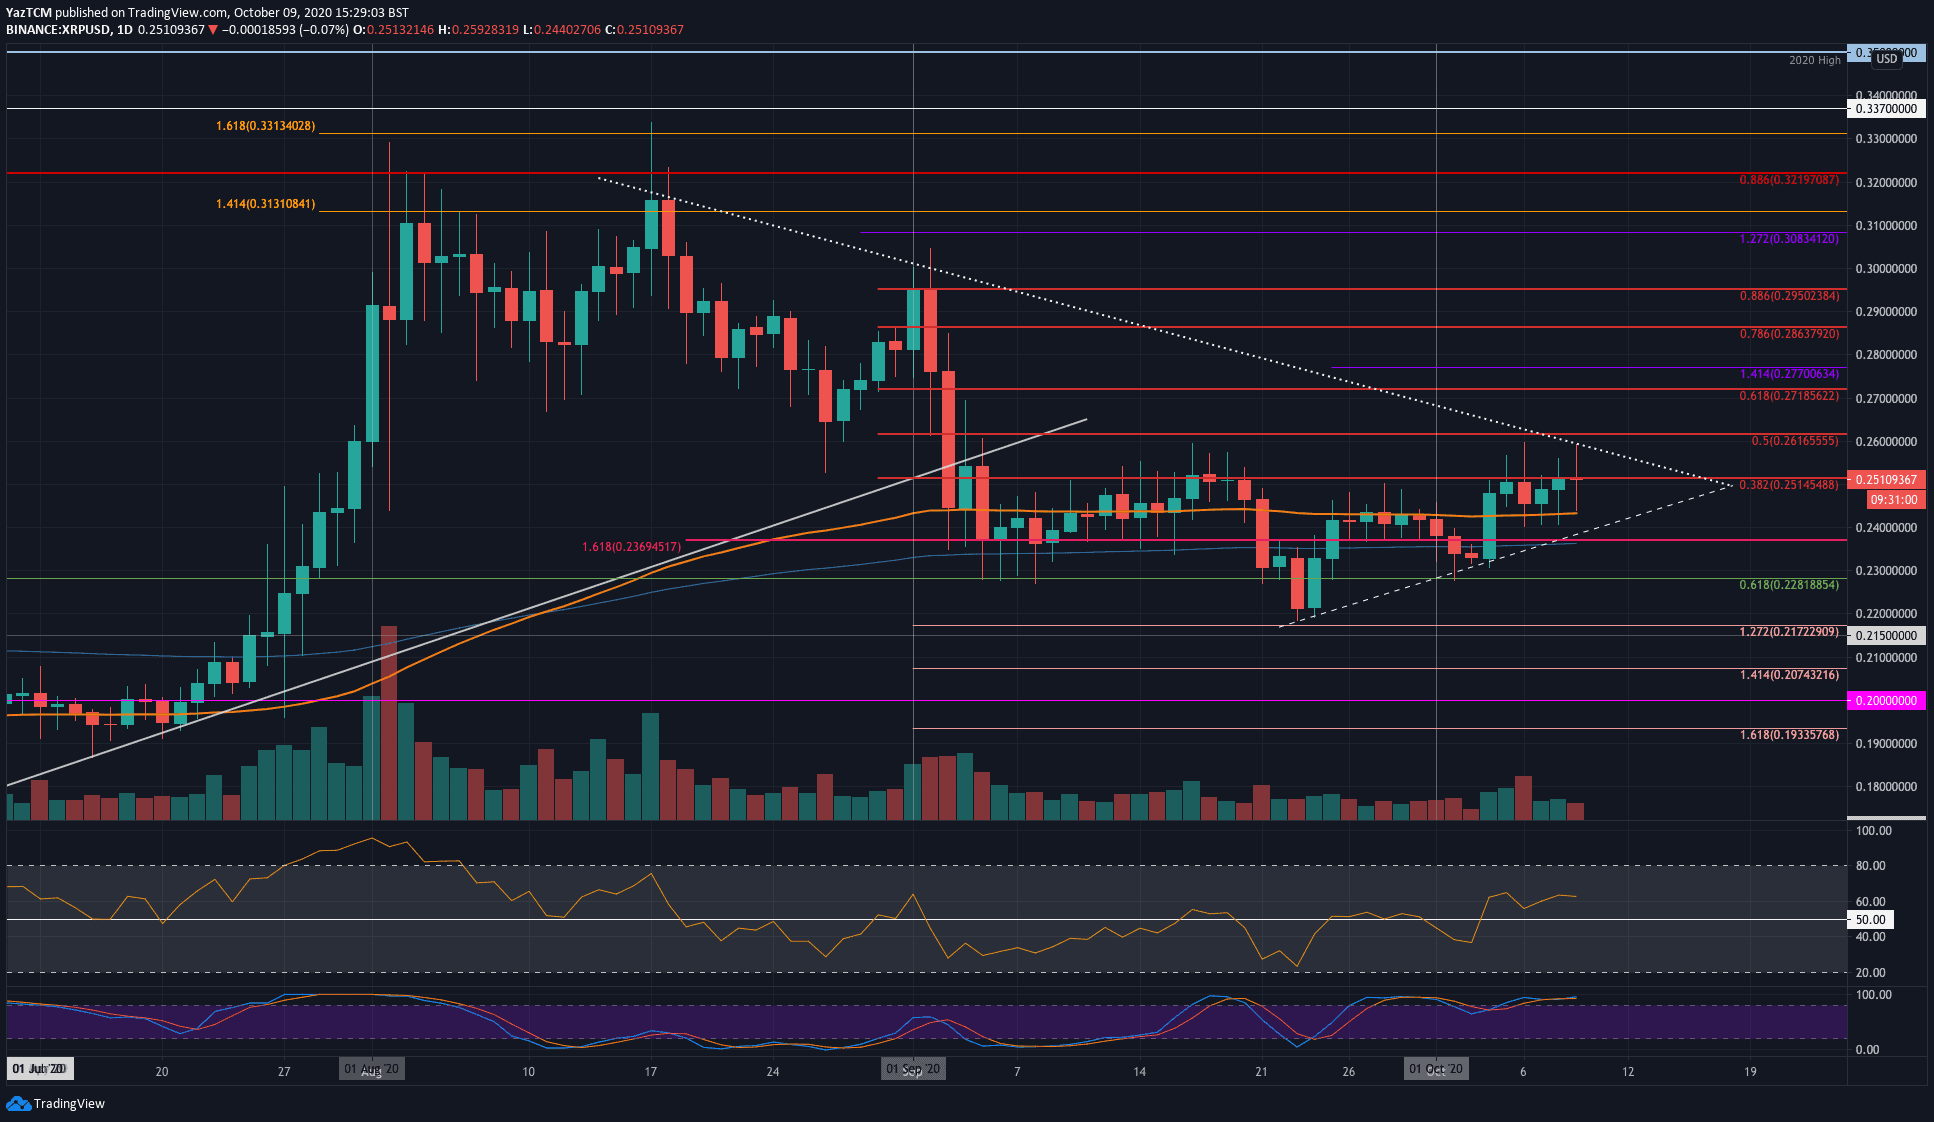
XRP saw a stronger 8% price increase this week but it struggled at the $0.251 resistance (bearish .382 Fib Retracement) for the past five days. On Sunday, XRP found support at the lower boundary of a short-term triangle, which allowed it to rebound higher.
On the way up, it ran into resistance at the $0.251 level and has struggled to break above here since. It has spiked higher beyond $0.251 – reaching as high as $0.26 – however, the sellers always stepped in to close each daily candle beneath $0.251.
Looking ahead, if the buyers do close above $0.251, resistance first lies at the falling trend line and then at $0.261 (bearish .5 Fib). Above this, resistance is located at $0.271 (bearish .618 Fib), $0.277, and $0.286 (bearish .786 Fib).
On the other side, the first level of support lies at $0.243 (100-days EMA). Beneath this, support lies at the short-term rising trend line, $0.237 (200-days EMA), and $0.228.
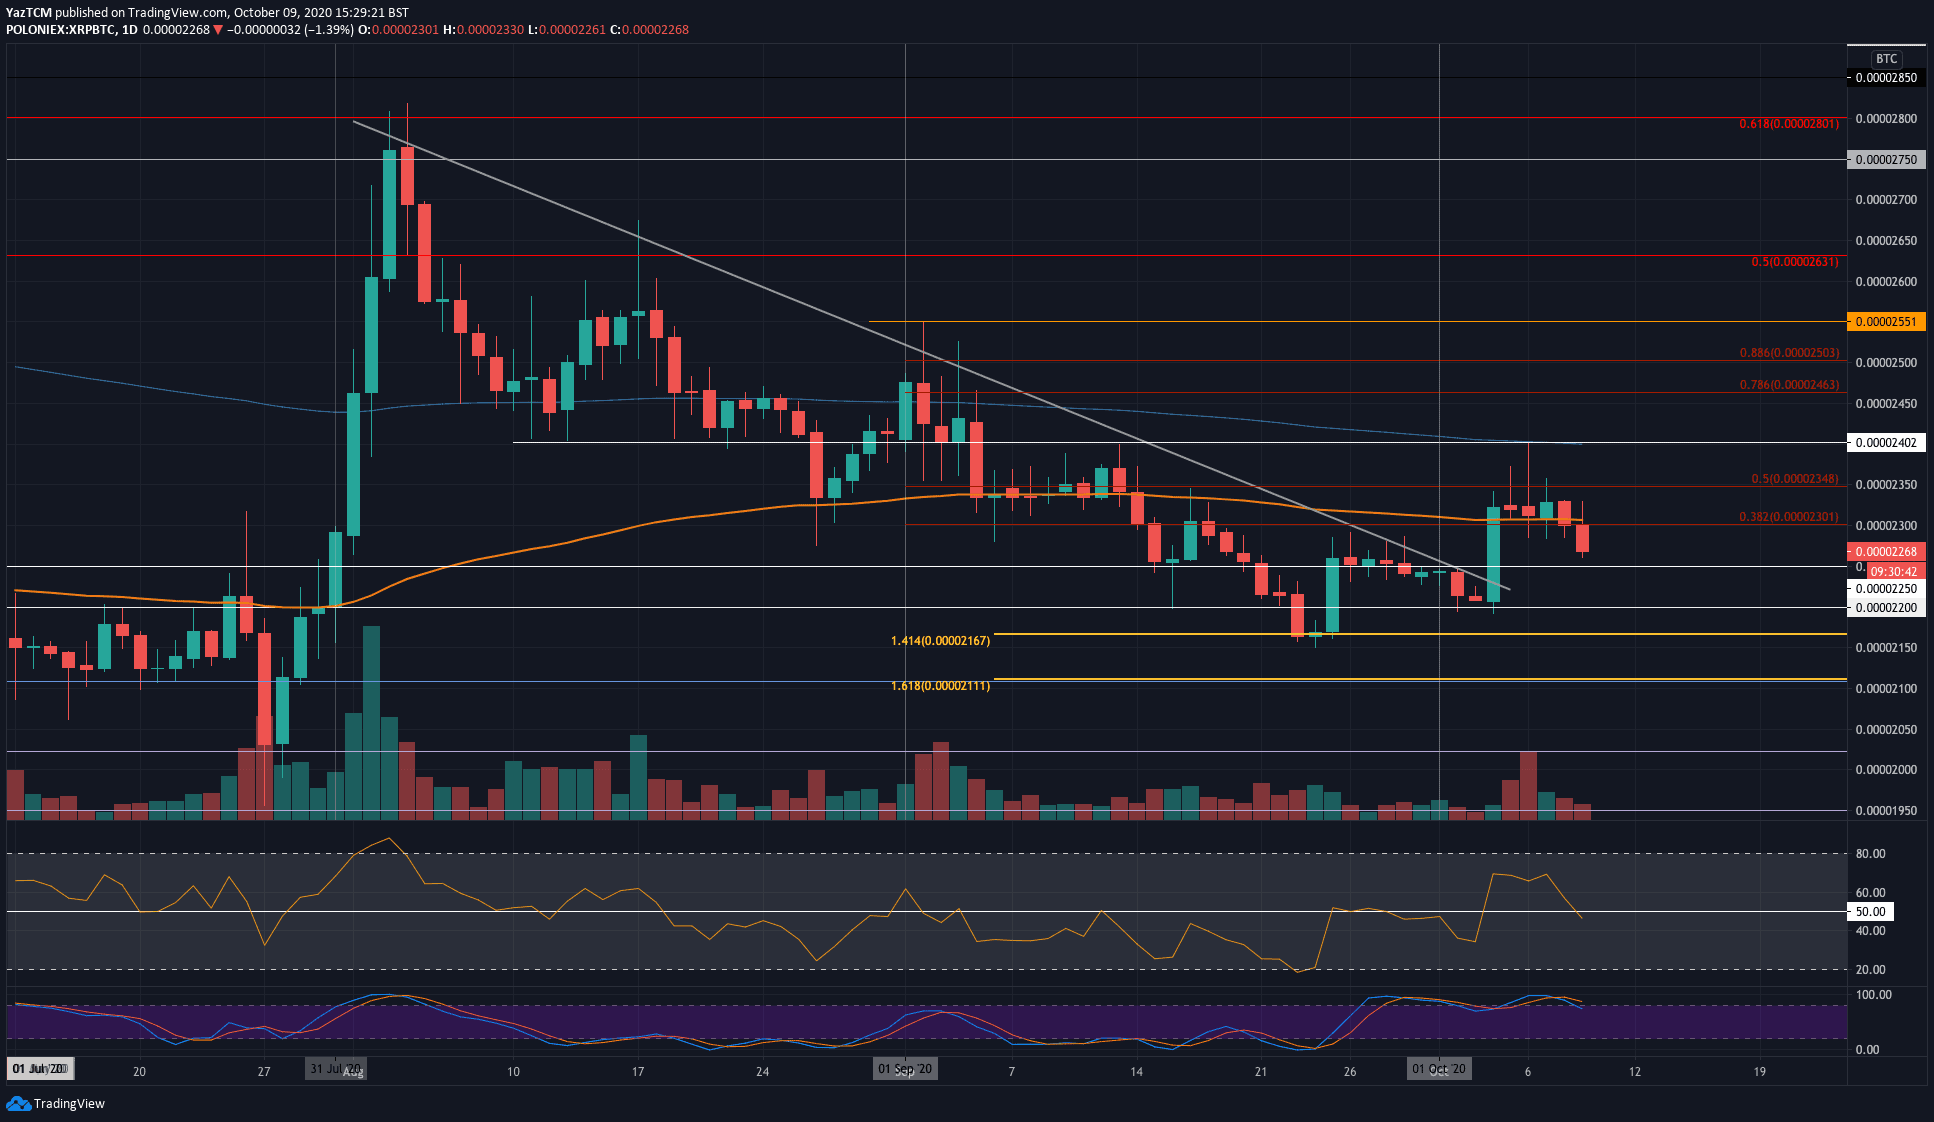
XRP saw as ambler 2.7% price increase this week against BTC. The coin bounced from the 2200 SAT level earlier in the week, which allowed it to push higher above the 100-days EMA level. On Tuesday, XRP had spiked into the 200-days EMA at around 2400 SAT but could not overcome this level.
With the latest Bitcoin price increase today, XRP fell beneath the 100-days EMA as it trades at 2270 SAT.
Looking ahead, if the sellers continue to drive XRP lower, the first level of support lies at 2250 SAT. Beneath this, support lies at 2200 SAT, 2170 SAT, and 2111 SAT.
On the other side, the first level of resistance lies at 2300 SAT (100-days EMA). Above this, resistance is located at 2350 SAT (bearish .5 Fib Retracement), 2400 SAT (200-days EMA), and 2460 SAT.
Monero
Monero saw a substantial 12.3% price rise this week as the coin pushed as high as $116 today. The cryptocurrency was trading at the $100 level last Friday as it started to advance. By Sunday, Monero had reached the resistance at around $114 – provided by a 1.618 Fib Extension and resistance provided by the November 2018 Highs.
It struggled to break this level for the rest of the week until the 3.2% price rise today, which saw XMR breaking higher to reach $116.
Looking ahead, if the buying continues, the first level of resistance lies at $118 (2019 High-Day Closing Price). Above this, resistance lies at $121 (1.618 Fib – blue), $126 (1.272 Fib), $128, and $131 (1.414 Fib)
On the other side, The first level of support is expected at $114.50. Beneath this, support lies at $110, $107 (.236 Fib), $100 (.382 Fib), and $96.

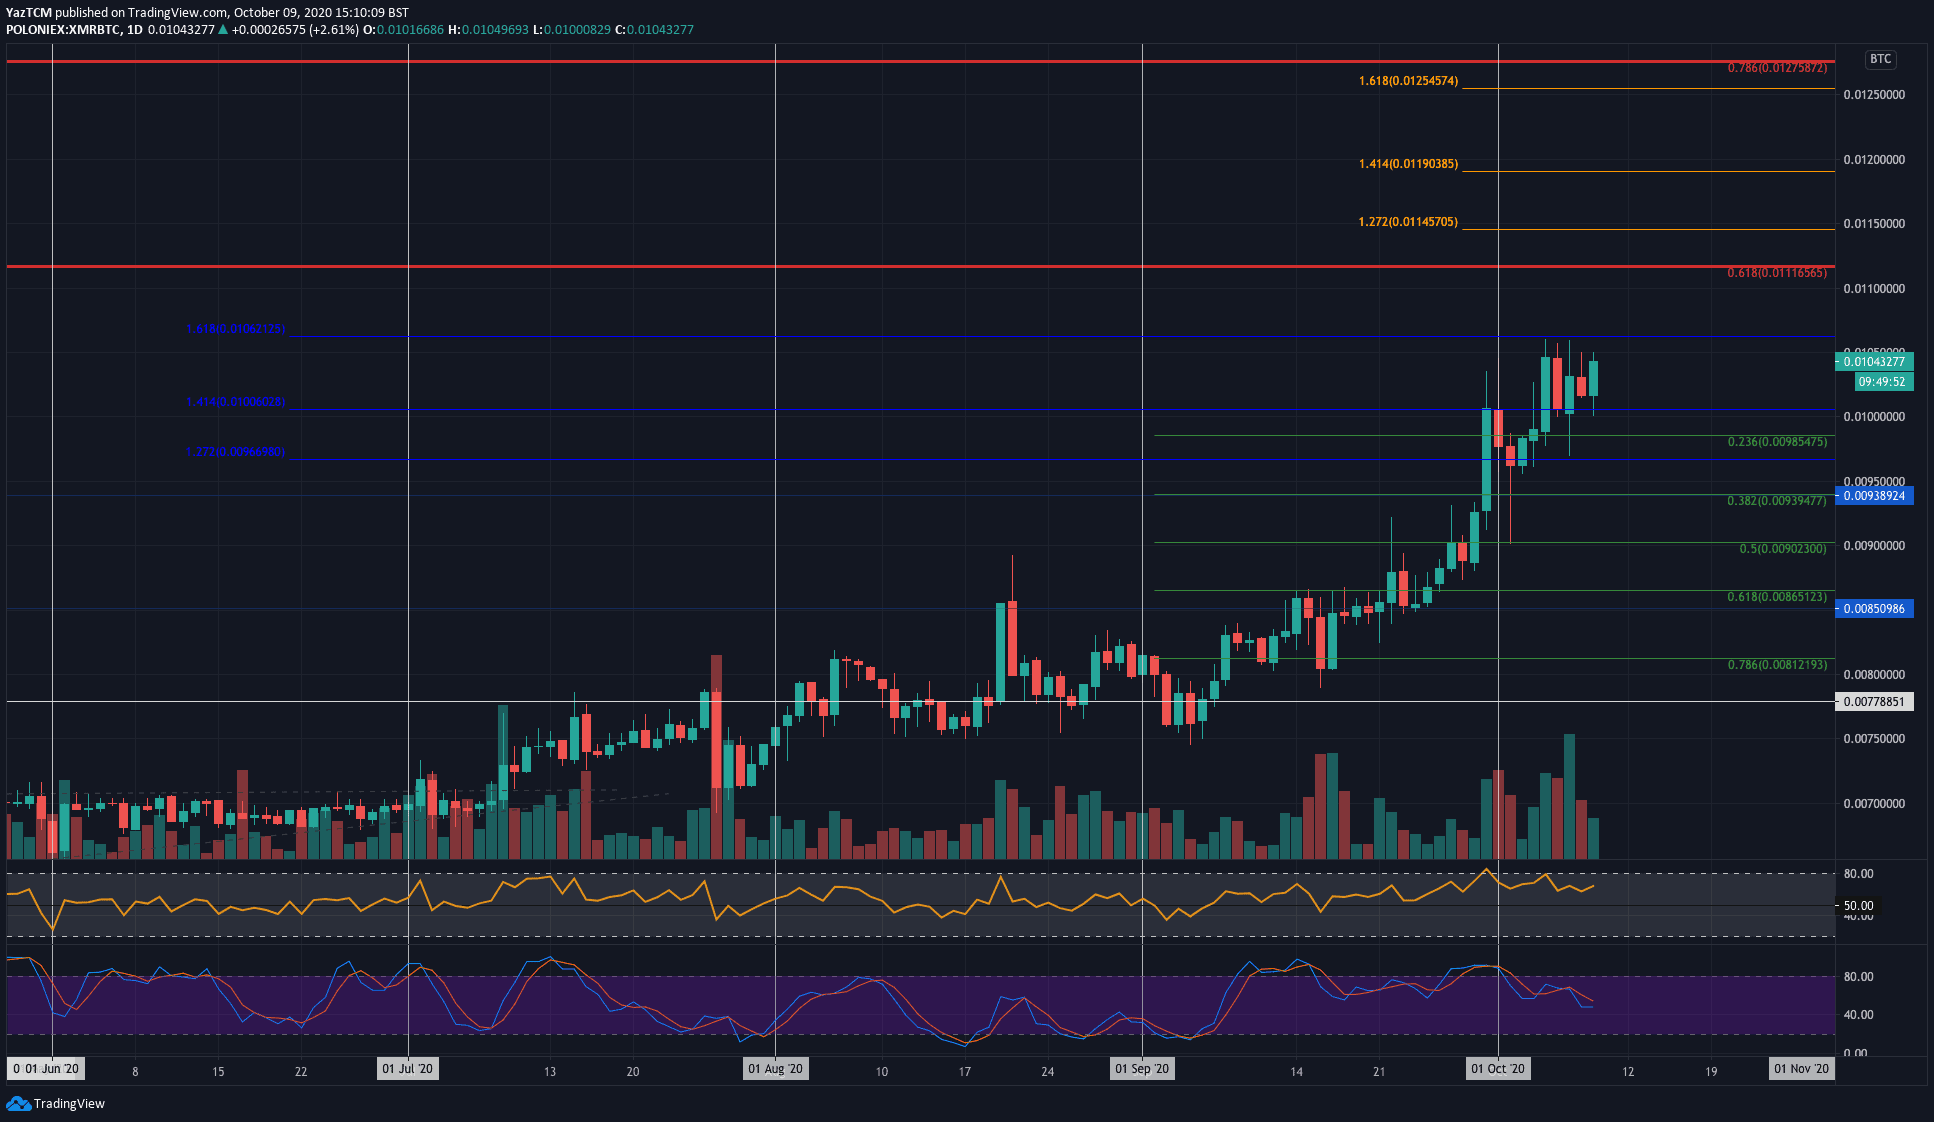
Monero also pushed higher against Bitcoin this week as it increased by almost 8%. Last Friday, it pushed higher from 0.0096 BTC to break above 0.01 BTC and reach the resistance at 0.0106 BTC (1.618 Fib Extension). It has been unable to overcome this resistance throughout the week.
Looking ahead, if the buyers can break 0.0106 BTC, resistance is first expected at 0.011 BTC. Following this, resistance lies at 0.0111 BTC and 0.0115 BTC (1.272 Fib). Additional resistance is expected at 0.0125 BTC.
On the other side, the first level of support lies at 0.01 BTC. Beneath this, support is expected at 0.00985 (.236 Fib), 0.0096, and 0.00939 (.382 Fib).
Bitcoin Cash
Bitcoin Cash saw an 8% price increase of its own this week as the coin hit the $240 level. The cryptocurrency was trading at the $217 level at the start of the week as it rebounded and started to push higher to reach the $240 resistance today.
Looking ahead, if the buyers can break $240, resistance is first expected at $250 (bearish .382 Fib Retracement). Above this, resistance lies at $256, $264 (bearish .5 Fib), and $277.
On the other side, support first lies at $230. Beneath this, support is expected at $217, $210, and $200.

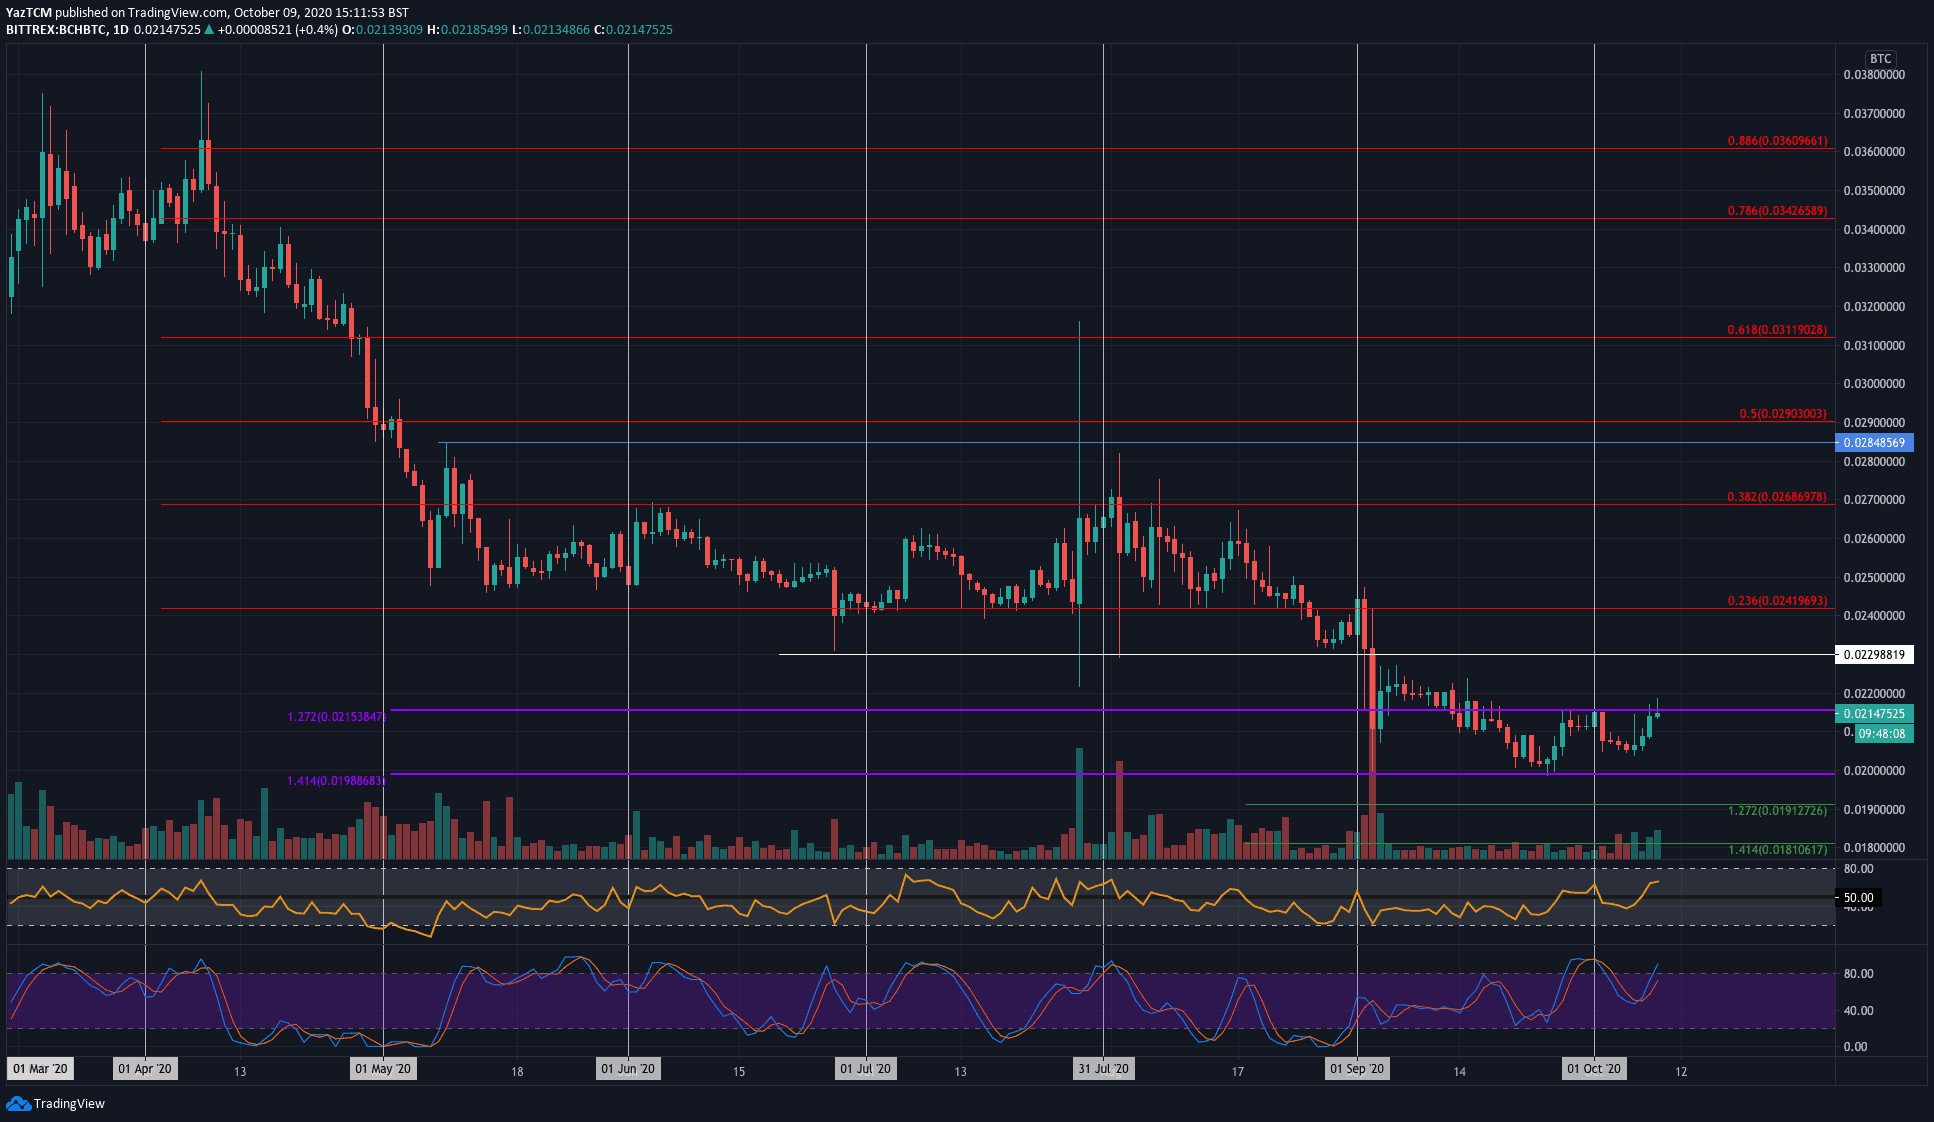
Against Bitcoin, BCH managed to rise by a total of around 3% as it hit the October resistance at 0.0215 BTC. The coin has been trapped between this resistance and the support at 0.02 BTC for the past fortnight.
Moving forward, if the bulls break 0.0215 BTC, resistance first lies at 0.022 BTC. This is followed by resistance at 0.023 BTC, 0.0241 BTC.
On the other side, the first level of support lies at 0.021 BTC. Following this, support is found at 0.0205 BTC and 0.020 BTC. Beneath this, additional support is expected at 0.0191 BTC.