Ethereum started to move sideways after hitting the August 2018 highs at the end of last week.The coin hasn’t been able to overcome this level since the weekend, despite Bitcoin surging above ,000 again.Against BTC, Ethereum dropped from the 0.0371 BTC resistance to reach support at 0.0347 BTC (.236 Fib Retracement).ETH/USD: 8 Challenging But a Matter of Time?Key Support Levels: 0, 0, 3.Key Resistance Levels: 8, 5, 5.Last week, Ethereum surged by around 20%, which allowed it to push above the 0 level and end the two weeks of consolidation seen in early August. After breaking this level, ETH continued to climb until it reached the 8 resistance – provided by the August 2018 high.Since then, ETH has struggled to close a daily candle above 8 and is rejected
Topics:
Yaz Sheikh considers the following as important: ETH Analysis, ETHBTC, Ethereum (ETH) Price, ethusd
This could be interesting, too:
Mandy Williams writes Ethereum Derivatives Metrics Signal Modest Downside Tail Risk Ahead: Nansen
Jordan Lyanchev writes Weekly Bitcoin, Ethereum ETF Recap: Light at the End of the Tunnel for BTC
CryptoVizArt writes Will Weak Momentum Drive ETH to .5K? (Ethereum Price Analysis)
Jordan Lyanchev writes Bybit Hack Fallout: Arthur Hayes, Samson Mow Push for Ethereum Rollback
- Ethereum started to move sideways after hitting the August 2018 highs at the end of last week.
- The coin hasn’t been able to overcome this level since the weekend, despite Bitcoin surging above $12,000 again.
- Against BTC, Ethereum dropped from the 0.0371 BTC resistance to reach support at 0.0347 BTC (.236 Fib Retracement).
ETH/USD: $438 Challenging But a Matter of Time?
Key Support Levels: $410, $400, $393.
Key Resistance Levels: $438, $445, $465.
Last week, Ethereum surged by around 20%, which allowed it to push above the $400 level and end the two weeks of consolidation seen in early August. After breaking this level, ETH continued to climb until it reached the $438 resistance – provided by the August 2018 high.
Since then, ETH has struggled to close a daily candle above $438 and is rejected continuously on each try. It attempted to spike higher to reach $445, however, the sellers immediately stepped in to close the daily candle beneath the $438 level.
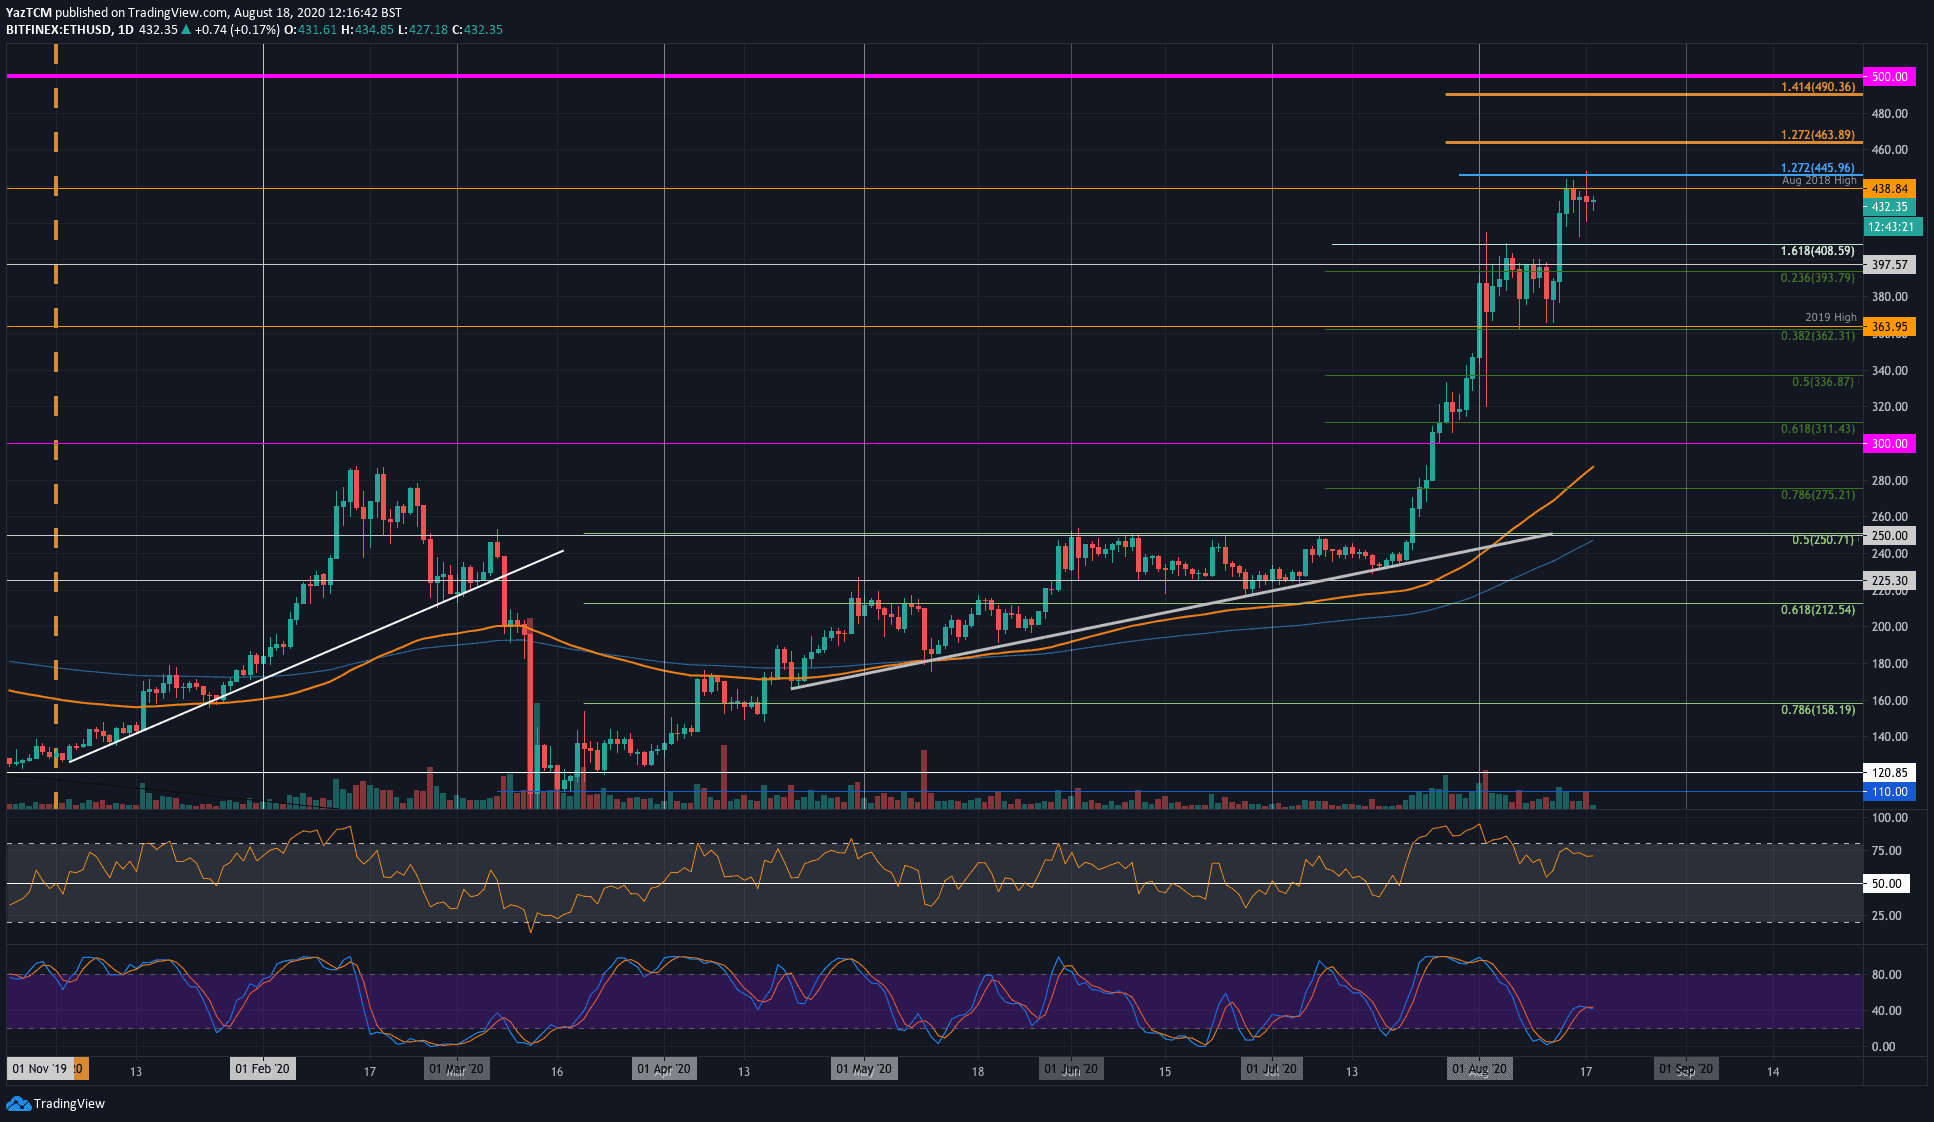
ETH-USD Short Term Price Prediction
If the bullish momentum increases to break above $438, the first level of resistance lies at $445 ($450). Following this, resistance is located at $465 (1.272 Fib Extension), $490 (1.414 Fib Extension), and $500.
On the other side, if the sellers push lower, the first level of support is found at $410. This is followed by support at $400, $393 (.236 Fib Retracement), and $362 (.382 Fib Retracement & 2019 High).
The RSI is pointing lower, which indicates fading bullish momentum. However, it remains well above the mid-line to suggest the bulls are in complete control.
ETH/BTC: Bulls Attempt To Defend 0.034 BTC
Key Support Levels: 0.0347 BTC, 0.0337 BTC, 0.0329 BTC.
Key Resistance Levels: 0.0361 BTC, 0.0371 BTC, 0.038 BTC.
Against Bitcoin, ETH dropped lower over the weekend from the 0.0371 BTC resistance (2020 high). It fell into the support at 0.0347 BTC – provided by an a.236 Fib Retracement and strengthened by a steeply rising trend line.
The coin has been trading above this trend line since mid-July, and a break beneath here could see ETH breaking this bullish trend and heading lower.
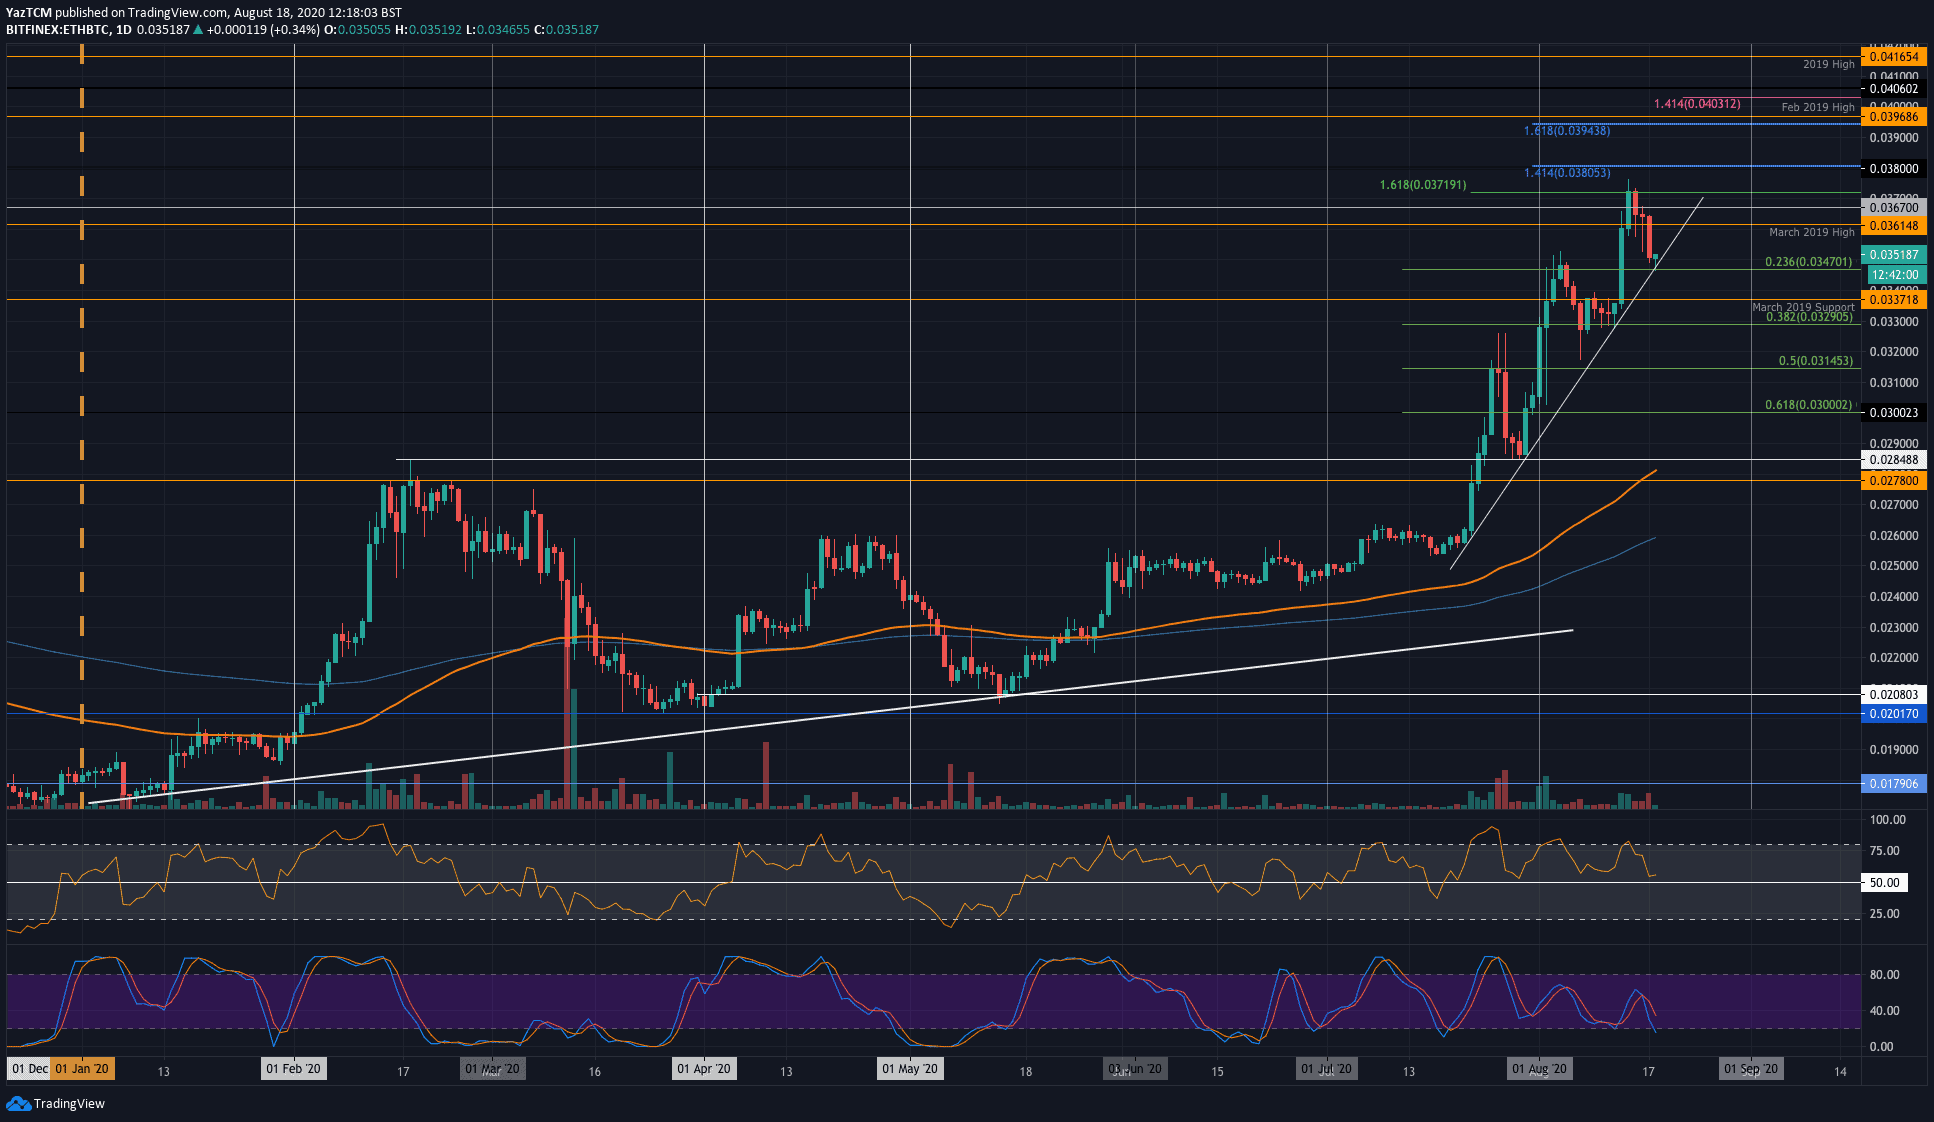
ETH-BTC Short Term Price Prediction
If the bulls can regroup at the current support, the first level of resistance lies at 0.0361 BTC (March 2019 high). Following this, resistance is found at 0.0367 BTC and 0.0371 BTC. Added resistance is located at 0.038 BTC.
On the other side, if the sellers break 0.0347 BTC, support lies at 0.0337 BTC (March 2019 Support), 0.0329 BTC (.382 Fib Retracement), and 0.0315 BTC (.5 Fib Retracement).
The bullish momentum has faded quite significantly, but the bulls remain in control as the RSI stays above the mid-level. Additionally, the Stochastic RSI is heading toward oversold conditions, and a bullish crossover signal could send the market higher.