Ethereum saw a small 1.7% price increase today as the coin reached the 5 level.The cryptocurrency has struggled to break above 8 for the past four days.Against Bitcoin, Ethereum continues to remain supported at the 0.0326 BTC support.ETH/USD: Bulls Halted By 8 ResistanceKey Support Levels: 0, 0, 0.Key Resistance Levels: 0, 8, 0.Ethereum had surged by a total of 65% over the past 30-days of trading, which allowed the coin to reach as high as 8 last week. It had run into resistance at a 1.618 Fib Extension level, which caused it to fall and head lower.Over the weekend, ETH found solid support at 0 as it rebounded back into the 8 level. It has struggled to overcome this resistance over the past 4-days and must break above it for the bullish run to continue
Topics:
Yaz Sheikh considers the following as important: ETH Analysis, ETHBTC, Ethereum (ETH) Price, ethusd
This could be interesting, too:
Mandy Williams writes Ethereum Derivatives Metrics Signal Modest Downside Tail Risk Ahead: Nansen
Jordan Lyanchev writes Weekly Bitcoin, Ethereum ETF Recap: Light at the End of the Tunnel for BTC
CryptoVizArt writes Will Weak Momentum Drive ETH to .5K? (Ethereum Price Analysis)
Jordan Lyanchev writes Bybit Hack Fallout: Arthur Hayes, Samson Mow Push for Ethereum Rollback
- Ethereum saw a small 1.7% price increase today as the coin reached the $395 level.
- The cryptocurrency has struggled to break above $398 for the past four days.
- Against Bitcoin, Ethereum continues to remain supported at the 0.0326 BTC support.
ETH/USD: Bulls Halted By $398 Resistance
Key Support Levels: $380, $370, $350.
Key Resistance Levels: $400, $408, $430.
Ethereum had surged by a total of 65% over the past 30-days of trading, which allowed the coin to reach as high as $408 last week. It had run into resistance at a 1.618 Fib Extension level, which caused it to fall and head lower.
Over the weekend, ETH found solid support at $380 as it rebounded back into the $398 level. It has struggled to overcome this resistance over the past 4-days and must break above it for the bullish run to continue further.

ETH-USD Short Term Price Prediction
Looking ahead, once the buyers tackle $398 and $400, resistance is firstly expected at $409 (1.618 Fib Extension). This is followed by resistance at $430, $445 (1.272 Fib Extension), and $463.
On the other side, support lies at $380. Beneath this, additional support is found at $370 (.236 Fib Retracement), $343 (.382 Fib Retracement), and $321 (.5 FIb Retracement).
The RSI is heading lower but remains above 50 to indicate the buyers still control the market momentum. The Stochastic RSI is primed for a bullish crossover signal that should send the market higher.
ETH/BTC – Ethereum Bulls Hold 0.032 BTC Support
Key Support Levels: 0.0326 BTC, 0.0317 BTC, 0.031 BTC.
Key Resistance Levels: 0.0337 BTC, 0.035 BTC, 0.0356 BTC.
Against Bitcoin, ETH struggled to break the resistance at 0.035 BTC at the start of the month, which caused it to spike lower into the 0.0317 BTC level on Friday. Over the weekend, it pushed higher from the support at 0.0326 (.236 Fib Retracement) to reach the resistance at 0.0337 BTC (March 2019 support).
ETH failed to break above this level as the sellers pushed the price back down to the 0.0326 BTC support today.
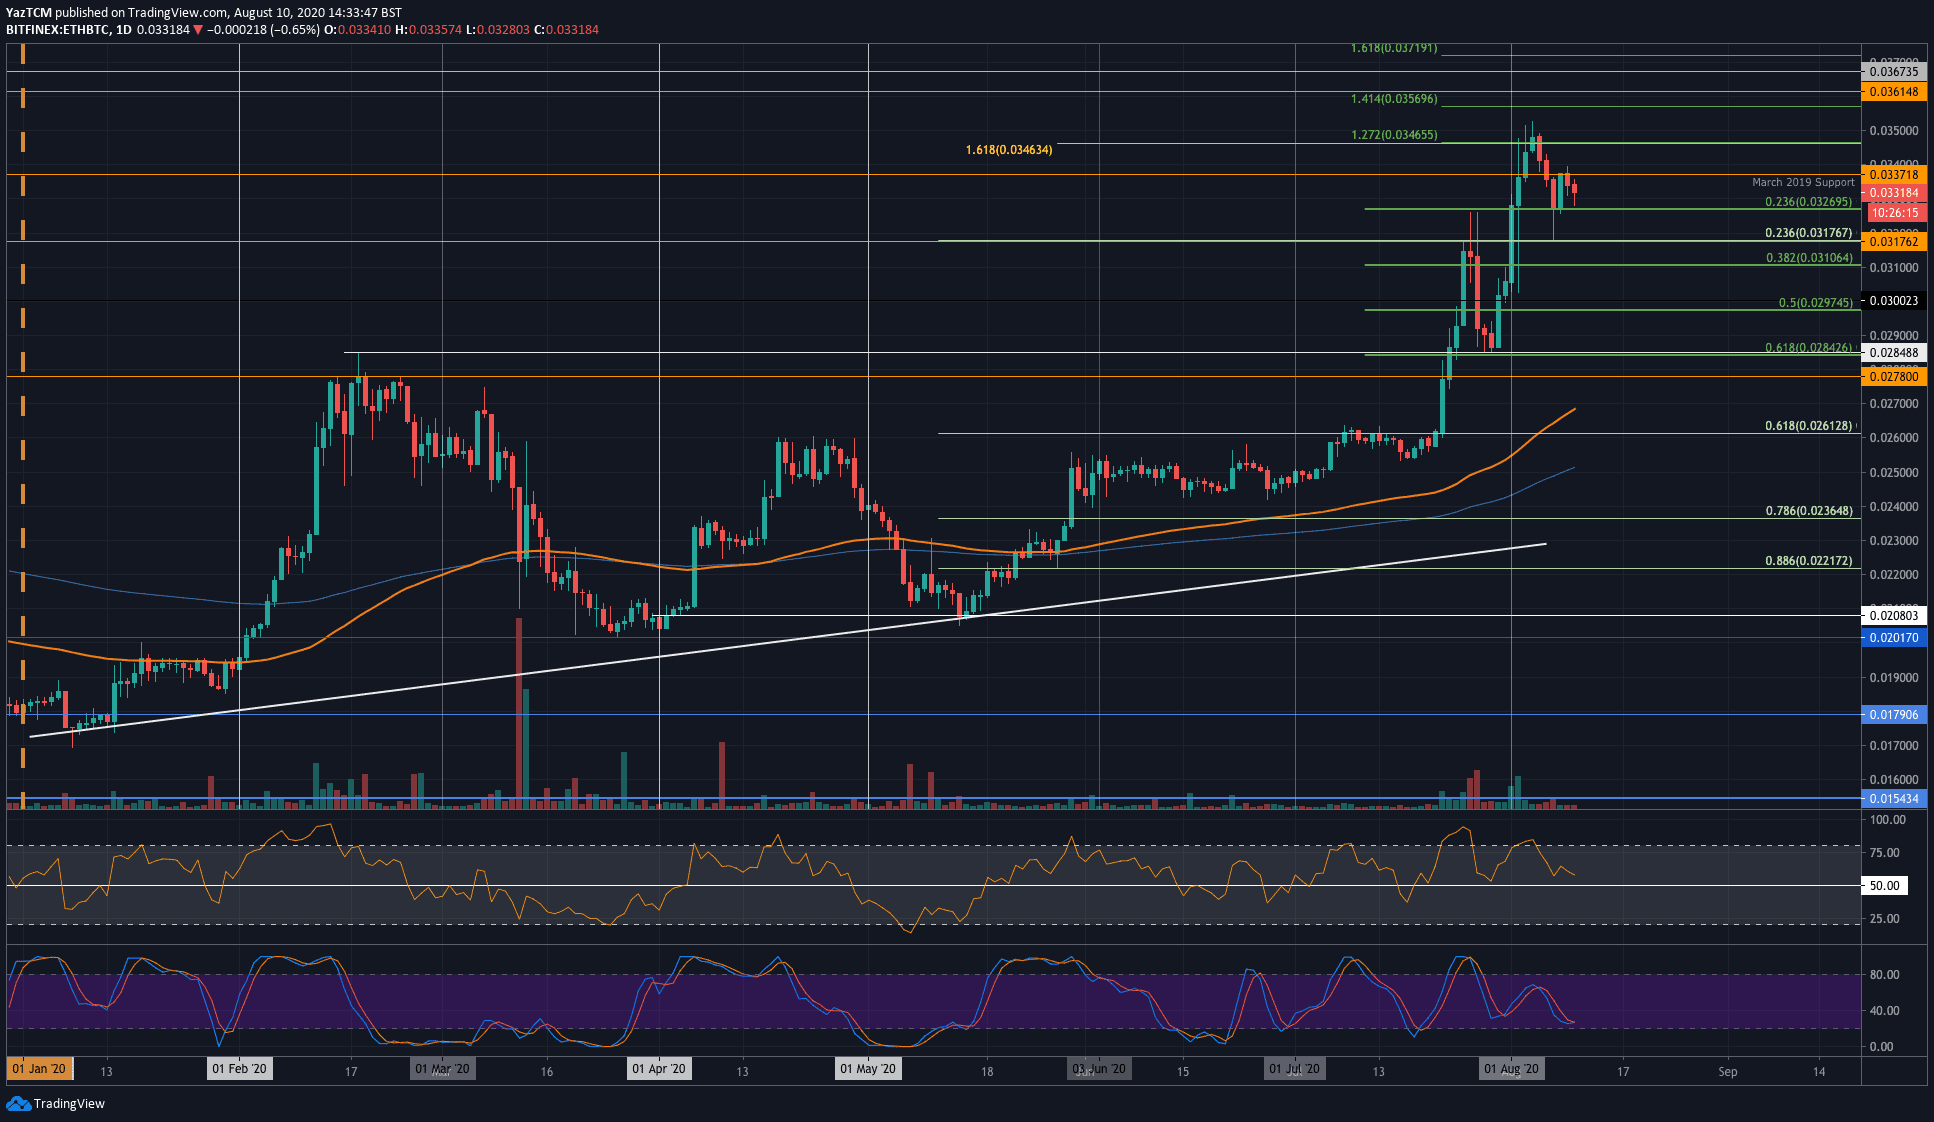
ETH-BTC Short Term Price Prediction
Looking ahead, if the bulls manage to eventually break above 0.0337 BTC, strong resistance lies at 0.035 BTC. Above this, resistance is expected at 0.0356 (1.414 Fib Extension), 0.0361 BTC, and 0.037 BTC.
On the other side, support is first expected at 0.032 BTC (.236 Fib Retracement). Beneath this, added support is found at 0.0317 BTC, 0.031 BTC (.382 Fib Retracement), and 0.030 BTC.
Likewise, the falling RSI indicates fading bullish momentum. However, the Stochastic RSI is primed for a bullish crossover signal, which should put an end to the fading bullish momentum.