Ethereum marked another failed attempt to overcome the 0 resistance. From there, the way to below 0 was quick.The cryptocurrency has been declining since ETH hit a 2-year High at 0 last week.Against Bitcoin, Ethereum attempted to break the 0.035 BTC resistance today but got was rejected and now facing a huge support zone.ETH/USD – Failure To Break Above 0Key Support Levels: 5, 0, 5Key Resistance Levels: 8, 0, 8Since hitting a 2-year high at 0 last week, Ethereum has been in a steady decline as it dropped by over 10% to current levels, below the 0 mark. Over the weekend, ETH found support at the 0 – 2 support area and rebounded. This bounce allowed Ethereum to push back above 0 on Monday as it hit the resistance at 8.Unfortunately, Ethereum
Topics:
Yaz Sheikh considers the following as important: ETH Analysis, ETHBTC, Ethereum (ETH) Price, ethusd
This could be interesting, too:
Mandy Williams writes Ethereum Derivatives Metrics Signal Modest Downside Tail Risk Ahead: Nansen
Jordan Lyanchev writes Weekly Bitcoin, Ethereum ETF Recap: Light at the End of the Tunnel for BTC
CryptoVizArt writes Will Weak Momentum Drive ETH to .5K? (Ethereum Price Analysis)
Jordan Lyanchev writes Bybit Hack Fallout: Arthur Hayes, Samson Mow Push for Ethereum Rollback
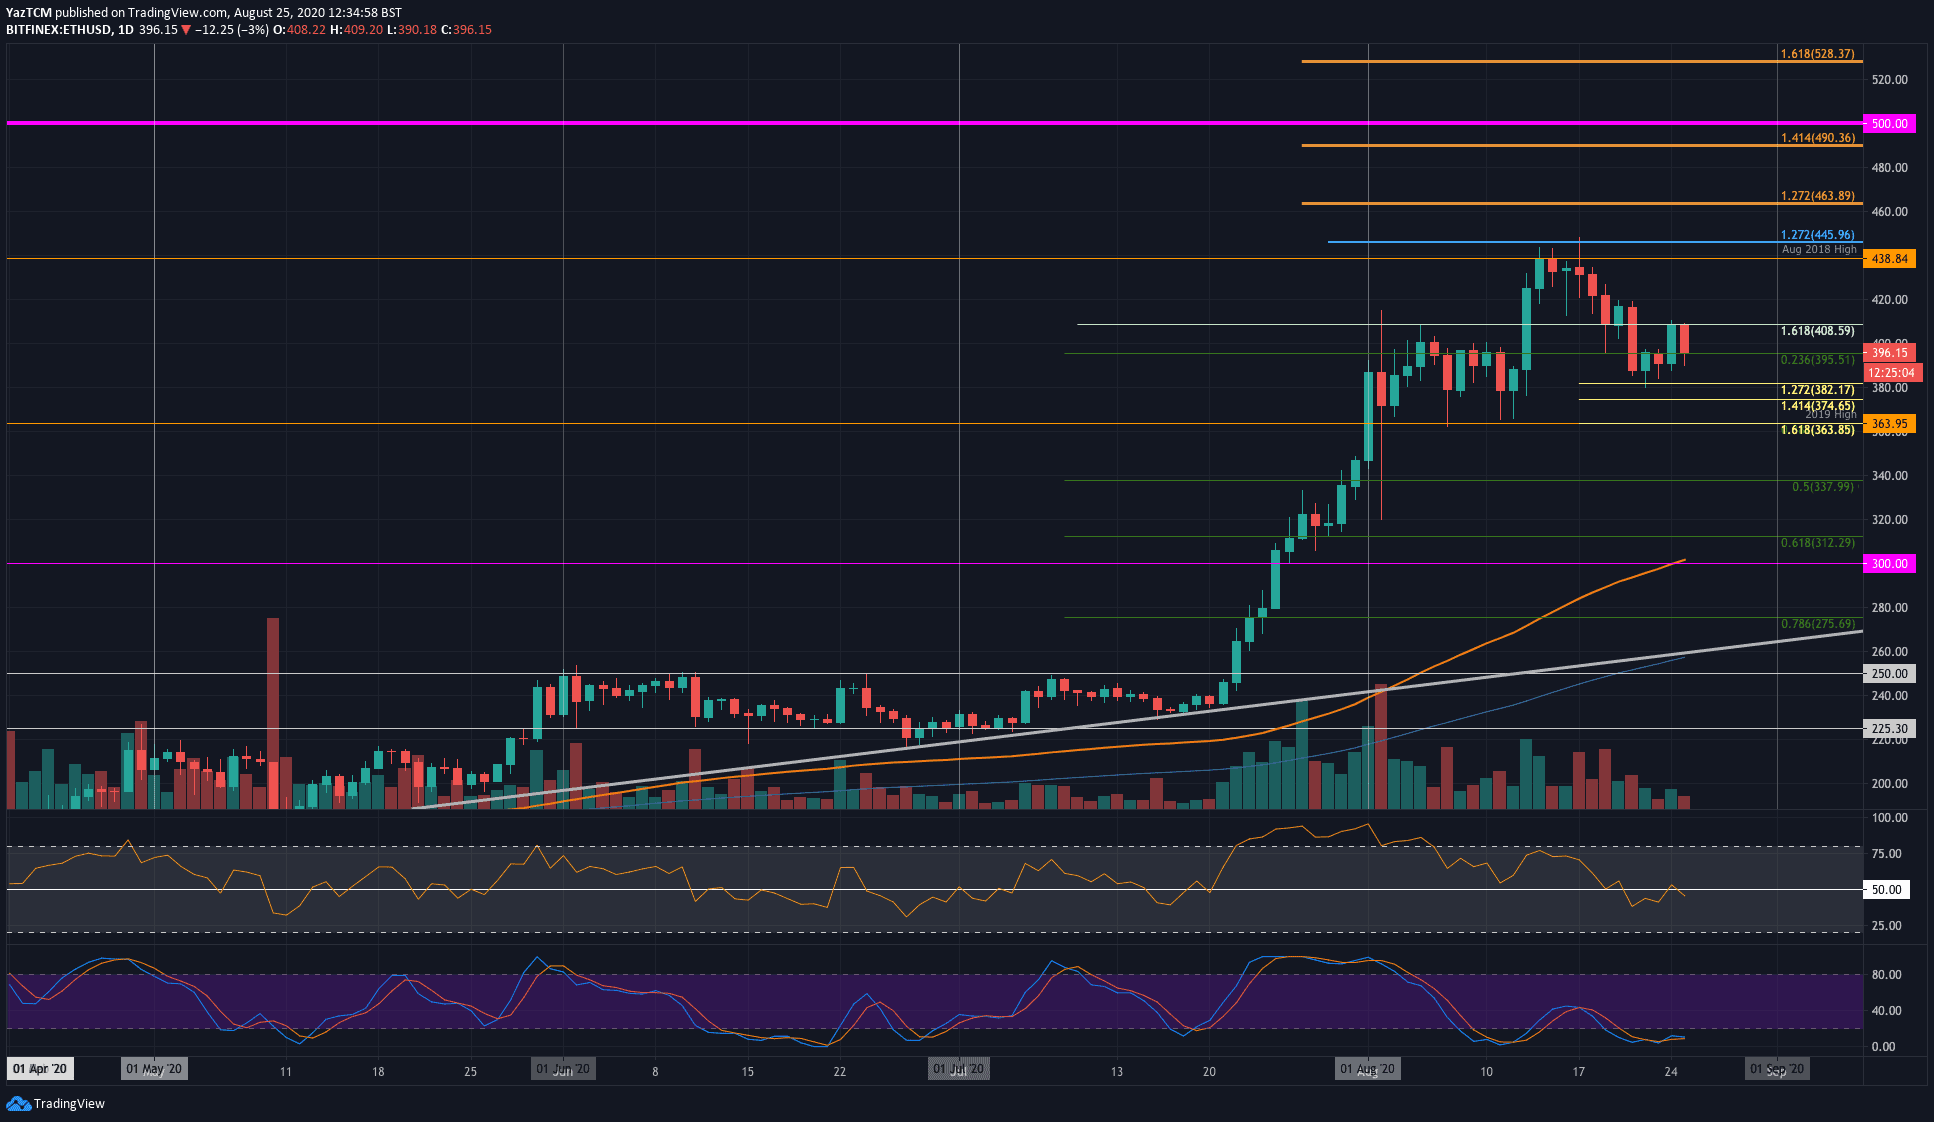
- Ethereum marked another failed attempt to overcome the $400 resistance. From there, the way to below $390 was quick.
- The cryptocurrency has been declining since ETH hit a 2-year High at $450 last week.
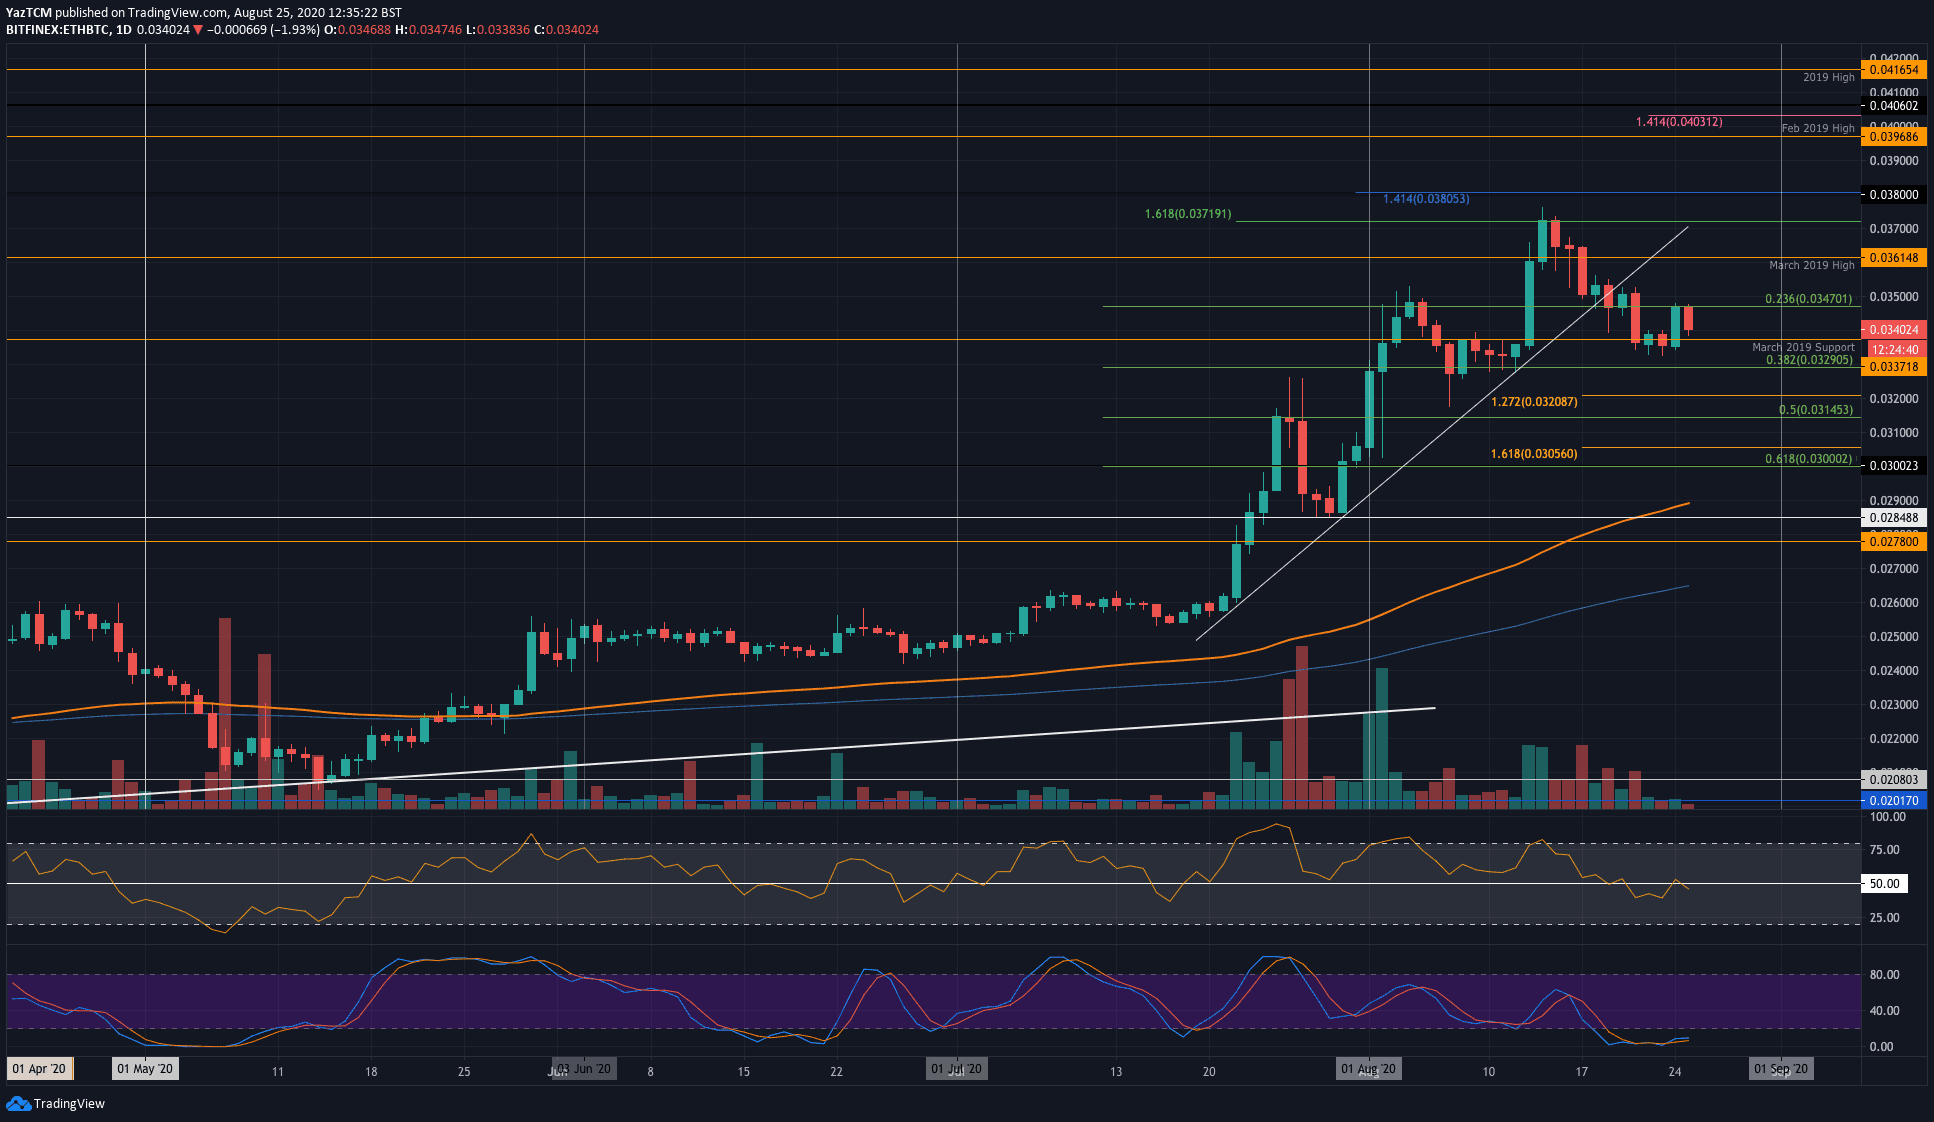
- Against Bitcoin, Ethereum attempted to break the 0.035 BTC resistance today but got was rejected and now facing a huge support zone.
ETH/USD – Failure To Break Above $400
Key Support Levels: $395, $380, $375
Key Resistance Levels: $408, $420, $438
Since hitting a 2-year high at $450 last week, Ethereum has been in a steady decline as it dropped by over 10% to current levels, below the $400 mark. Over the weekend, ETH found support at the $380 – $382 support area and rebounded. This bounce allowed Ethereum to push back above $400 on Monday as it hit the resistance at $408.
Unfortunately, Ethereum did not overcome the $408 level as the bears pushed it back beneath $400 today, and struggling to maintain the $395 support (.236 Fib Retracement level).
ETH-USD Short Term Price Prediction
The first significant resistance lies at $400, which is today’s high, followed by $408. Further resistance is expected at $420 and $438 (august 2018 highs). Beyond $438, resistance lies at $445 ($450), which is 2020 high.
On the other side, the first major area of support now lies at $380 – $382. This is closely followed by support at $375 (downside 1.414 Fib Extension), $370, and $363 (2019 High, .382 Fib Retracement, and downside 1.618 Fib Extension).
The volume is decreasing, so we can expect the next huge move to take place soon.
ETH/BTC – Bullish Rebound Stalls At 0.0347 BTC.
Key Support Levels: 0.0333 BTC, 0.0329 BTC, 0.032 BTC.
Key Resistance Levels: 0.0347 BTC, 0.0361 BTC, 0.0371 BTC.
Ethereum is also in a bearish decline against Bitcoin since it reached the 2020 high at the 0.037 – 0.038 BTC range. Over the past week, Ethereum dropped beneath 0.035 BTC and continued further to the current area of 0.0337 BTC, which is the March 2019 support.
Yesterday, Ethereum saw another failed attempt to rebound higher as it stalled by the resistance at 0.0347 BTC.
ETH-BTC Short Term Price Prediction
From below, the first level of support is expected at 0.0333 BTC (around the current levels). Following this added support lies at 0.0329 BTC (.382 Fib Retracement), 0.032 BTC (downside 1.272 Fib Extension), and 0.0314 BTC (.5 Fib Retracement).
Alternatively, if the buyers can hold the 0.333 – 0.0337 BTC support area, the first resistance lies at 0.0347 BTC, 0.0361 BTC (March 2019 highs), and 0.0371 BTC. Further resistance is located at 0.038 BTC – the 2020 high.
Looking at the RSI, the Stochastic RSI oscillator is primed for a bullish crossover signal that could prevent the market from further declines.