Ethereum increased by 4% today to reach the 5 level again.The cryptocurrency dropped yesterday to reach 0 but quickly rebounded.Against Bitcoin, Ethereum fell beneath the lower boundary of the previous range as it drops beneath 0.0239 BTC.Key Support & Resistance LevelsETH/USD:Support: 0, 0, 7.Resistance: 5, 0, 5.ETH/BTC:Support: 0.0239 BTC, 0.0236 BTC, 0.023 BTC.Resistance: 0.0247 BTC, 0.025 BTC, 0.026 BTC.ETH/USD: Ethereum Finally Breaks 0.Ethereum was struggling at the 7 resistance at the start of the week. This all changed yesterday when ETH surged by 9% to break above this resistance as it climbed above 0. It continued to push higher to close the day at around 0.In yesterday’s trading session, ETH continued higher and reached as high as 5 before
Topics:
Yaz Sheikh considers the following as important: ETH Analysis, ETHBTC, Ethereum (ETH) Price, ethusd
This could be interesting, too:
CryptoVizArt writes Will Weak Momentum Drive ETH to .5K? (Ethereum Price Analysis)
Jordan Lyanchev writes Bybit Hack Fallout: Arthur Hayes, Samson Mow Push for Ethereum Rollback
Mandy Williams writes Ethereum Key Metrics Point to Persistent Bullish Outlook for ETH: CryptoQuant
CryptoVizArt writes Ethereum Price Analysis: Following a 15% Weekly Crash, What’s Next for ETH?
- Ethereum increased by 4% today to reach the $215 level again.
- The cryptocurrency dropped yesterday to reach $200 but quickly rebounded.
- Against Bitcoin, Ethereum fell beneath the lower boundary of the previous range as it drops beneath 0.0239 BTC.
Key Support & Resistance Levels
ETH/USD:
Support: $210, $200, $187.
Resistance: $225, $230, $245.
ETH/BTC:
Support: 0.0239 BTC, 0.0236 BTC, 0.023 BTC.
Resistance: 0.0247 BTC, 0.025 BTC, 0.026 BTC.
ETH/USD: Ethereum Finally Breaks $200.
Ethereum was struggling at the $197 resistance at the start of the week. This all changed yesterday when ETH surged by 9% to break above this resistance as it climbed above $200. It continued to push higher to close the day at around $220.
In yesterday’s trading session, ETH continued higher and reached as high as $225 before the sellers stepped in and started to push the market lower toward $202 (.236 Fib Retracement). Today, it rebounded back toward $215.
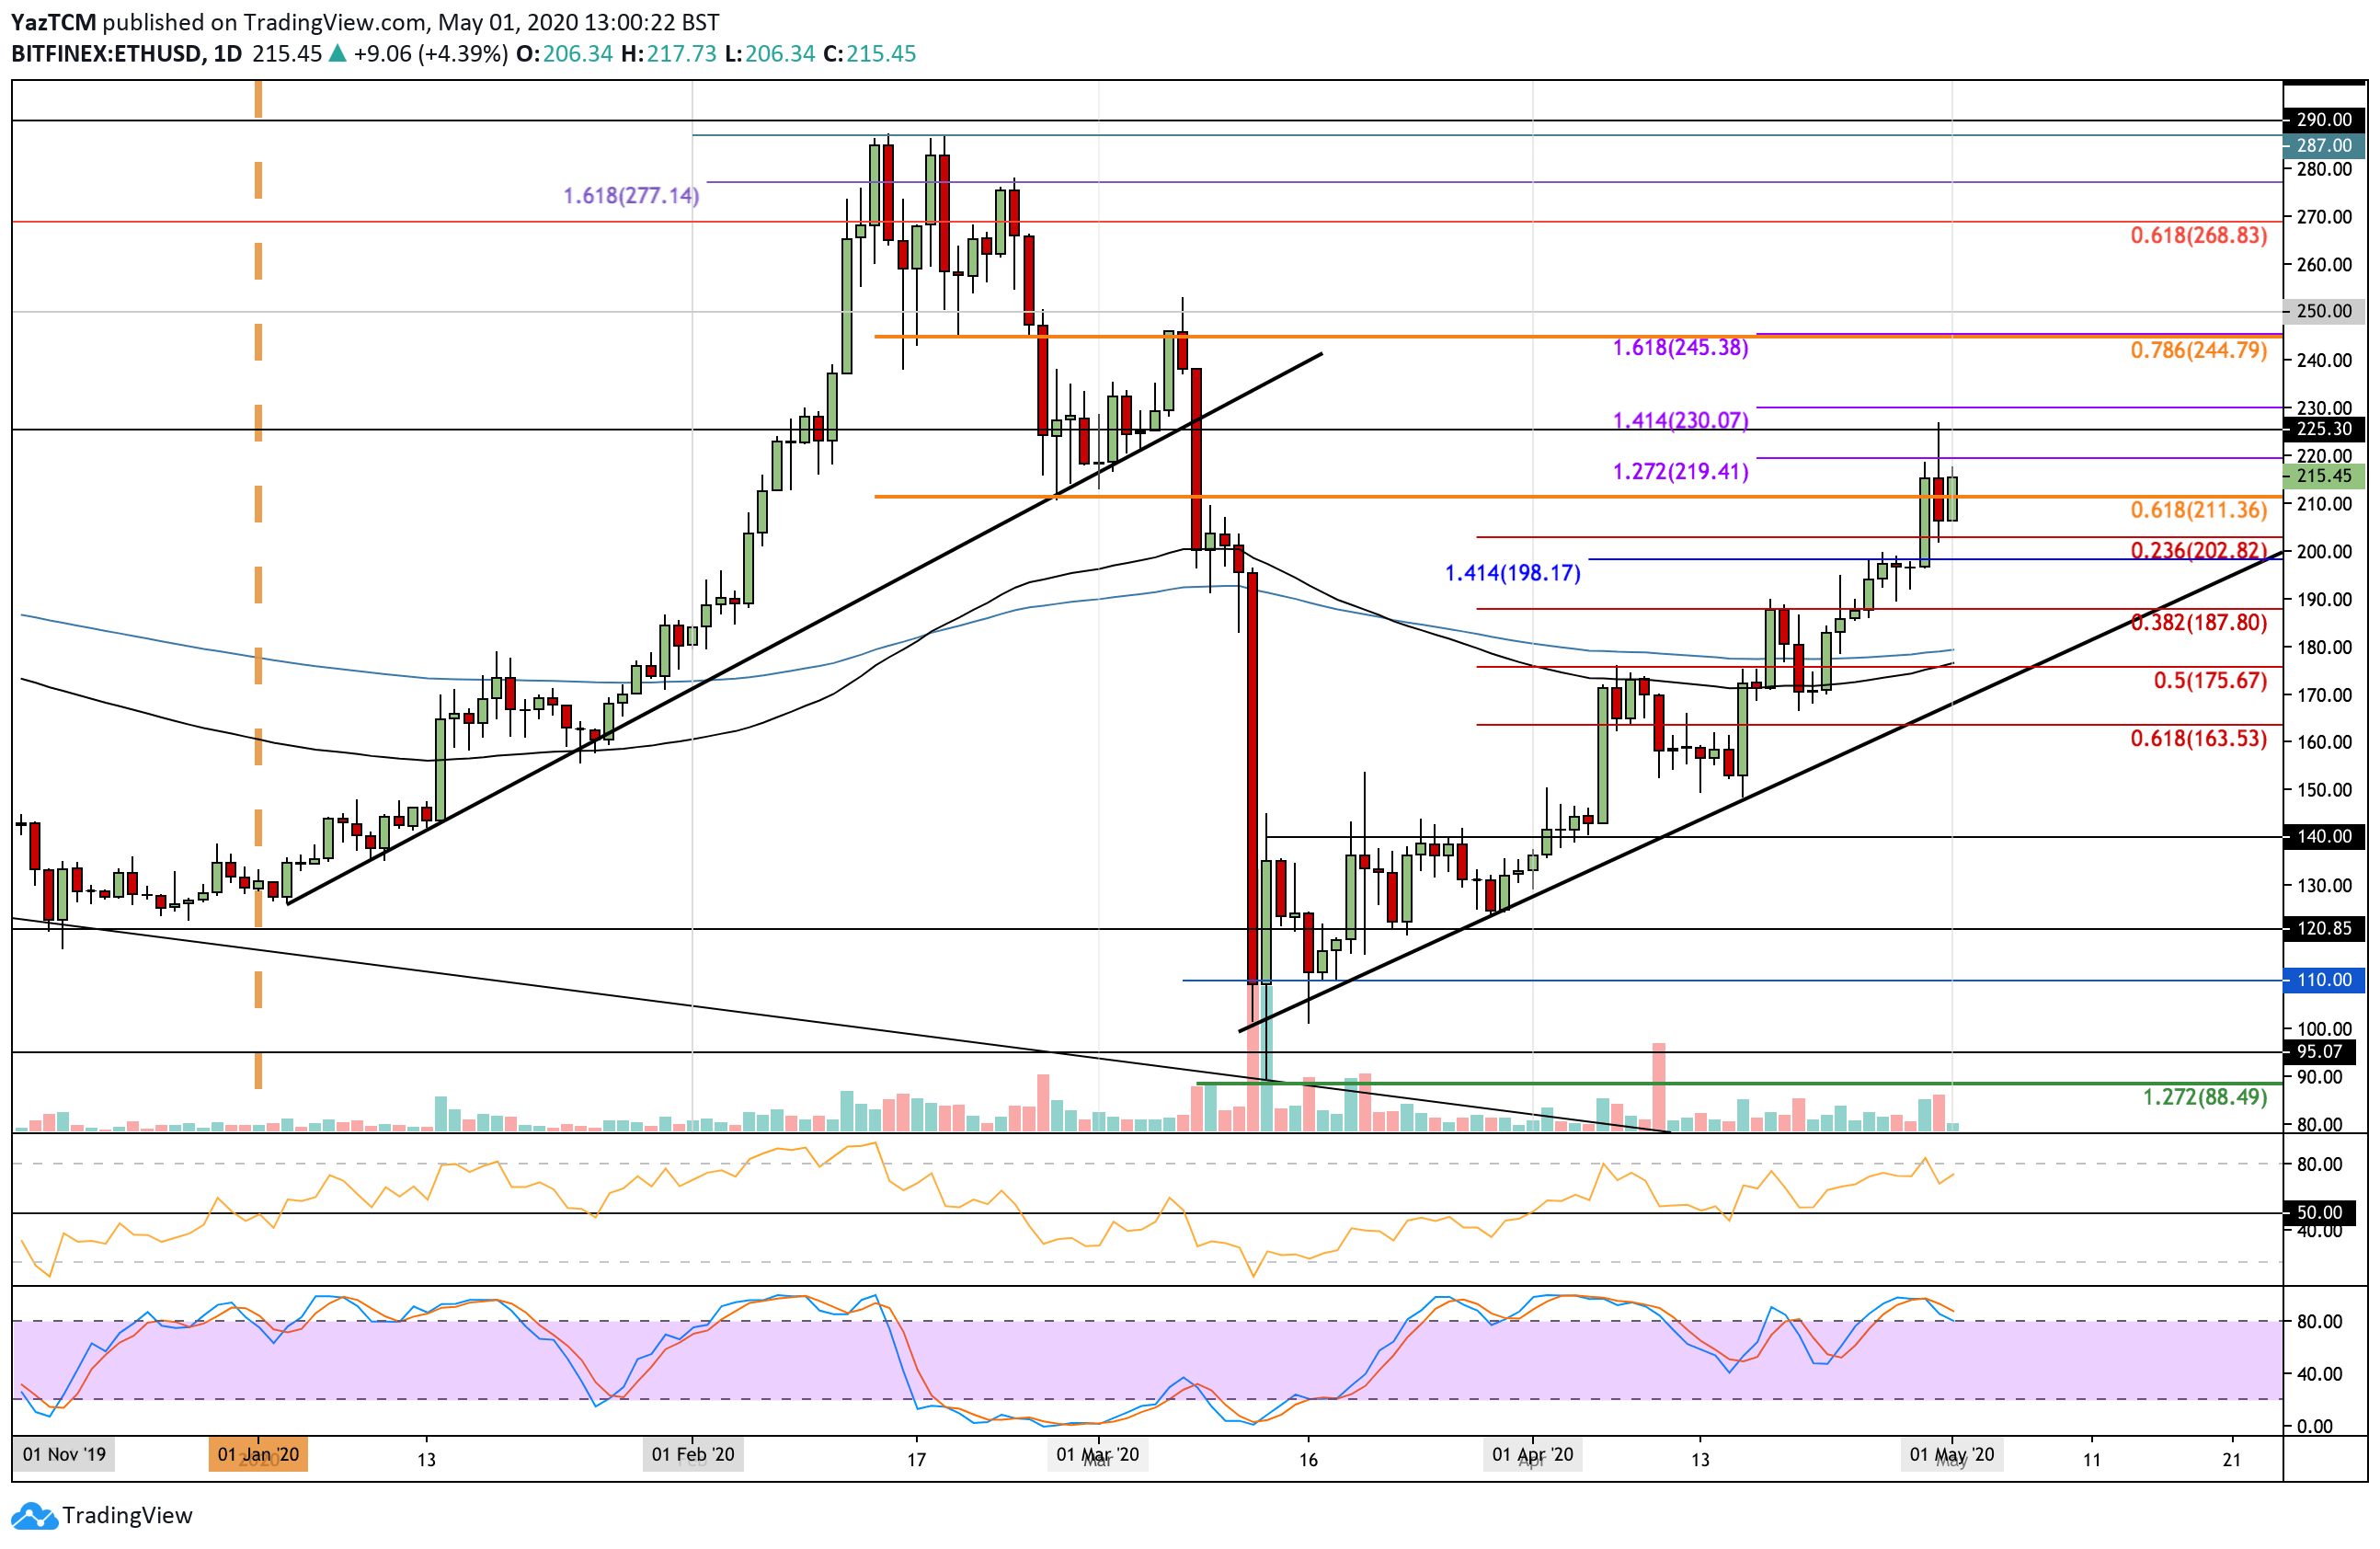
ETH/USD Short Term Price Prediction
If the bulls continue to drive ETH higher, the first level of resistance is located at $225. Above this, resistance can be found at $230 (1.414 Fib Extension) and $245 (bearish .786 Fib Retracement). Above this, added resistance lies at $250 and $260.
If the sellers push ETH beneath $210, the first level of support lies at $200 (.236 Fib Retracement). Beneath this, support lies at $187 (.382 Fib Retracement), and $180 (200-days EMA).
The RSI dropped beneath overbought conditions yesterday and is now pointing higher again as the bullish momentum starts to increase. The Stochastic RSI is also overbought but it can remain overbought for extended periods of time when the market goes parabolic.
ETH/BTC: ETH Breaks Beneath Previous Range
Against Bitcoin, Ethereum was trading within a range between 0.026 BTC and 0.0247 BTC over the past 10-days of trading. It broke beneath the lower boundary of this range yesterday when Bitcoin itself exploded above $8,000.
After breaking beneath, ETH continued to fall to reach as low as 0.0236 BTC. It since bounced higher to trade at the 0.0239 BTC support.

ETH/BTC Short Term Price Prediction
If the sellers continue beneath 0.0239 BTC, support can be expected at 0.0236 BTC again. Beneath this, added support lies at 0.023 BTC (.5 Fib Retracement & 100-days EMA), 0.0225 BTC (200-days EMA), and 0.0223 BTC (.618 Fib Retracement).
Alternatively, if the buyers rebound from 0.0239 BTC, resistance lies at 0.0247 BTC, 0.025 BTC, and 0.026 BTC.
The RSI has dipped beneath the 50 line to show that the sellers are in control of the market momentum. For ETH to recover against BTC, the RSI would need to climb back above 50 to show bullish momentum.