XRP dropped by a small 1% today as the bulls defend %excerpt%.28.The coin found resistance at %excerpt%.313 earlier in the month and has been falling ever since.Against Bitcoin, XRP dropped beneath the 200-days EMA today as it falls to 2400 SAT.XRP/USD: XRP Bulls Defending %excerpt%.28 LevelKey Support Levels: %excerpt%.28, %excerpt%.264, %excerpt%.245.Key Resistance Levels: %excerpt%.3, %excerpt%.313, %excerpt%.321.So far, XRP dropped by a total of 14% since hitting a peak of %excerpt%.329 earlier in August. More specifically, the coin was never able to close above resistance at %excerpt%.313 (1.414 Fib Extension), which caused the coin to roll over.Over the past week, XRP dropped beneath the support at %excerpt%.3 and %excerpt%.286 (.236 Fib Retracement) as it reached the %excerpt%.28 level today. The buyers are attempting to defend the %excerpt%.28 level, but it looks like the momentum
Topics:
Yaz Sheikh considers the following as important: Ripple (XRP) Price, XRP Analysis, xrpbtc, xrpusd
This could be interesting, too:
Jordan Lyanchev writes How High Can Ripple (XRP) Go With Gary Gensler Out of the Picture? (AI Bots Analyze)
George Georgiev writes Ripple (XRP) Price Pumps 5% Following News that Gary Gensler Will Quit
Dimitar Dzhondzhorov writes Top Ripple (XRP) Price Predictions as of Late
Dimitar Dzhondzhorov writes Important Binance Announcement Affecting Certain XRP, ADA, and DOGE Traders: Details
- XRP dropped by a small 1% today as the bulls defend $0.28.
- The coin found resistance at $0.313 earlier in the month and has been falling ever since.
- Against Bitcoin, XRP dropped beneath the 200-days EMA today as it falls to 2400 SAT.
XRP/USD: XRP Bulls Defending $0.28 Level
Key Support Levels: $0.28, $0.264, $0.245.
Key Resistance Levels: $0.3, $0.313, $0.321.
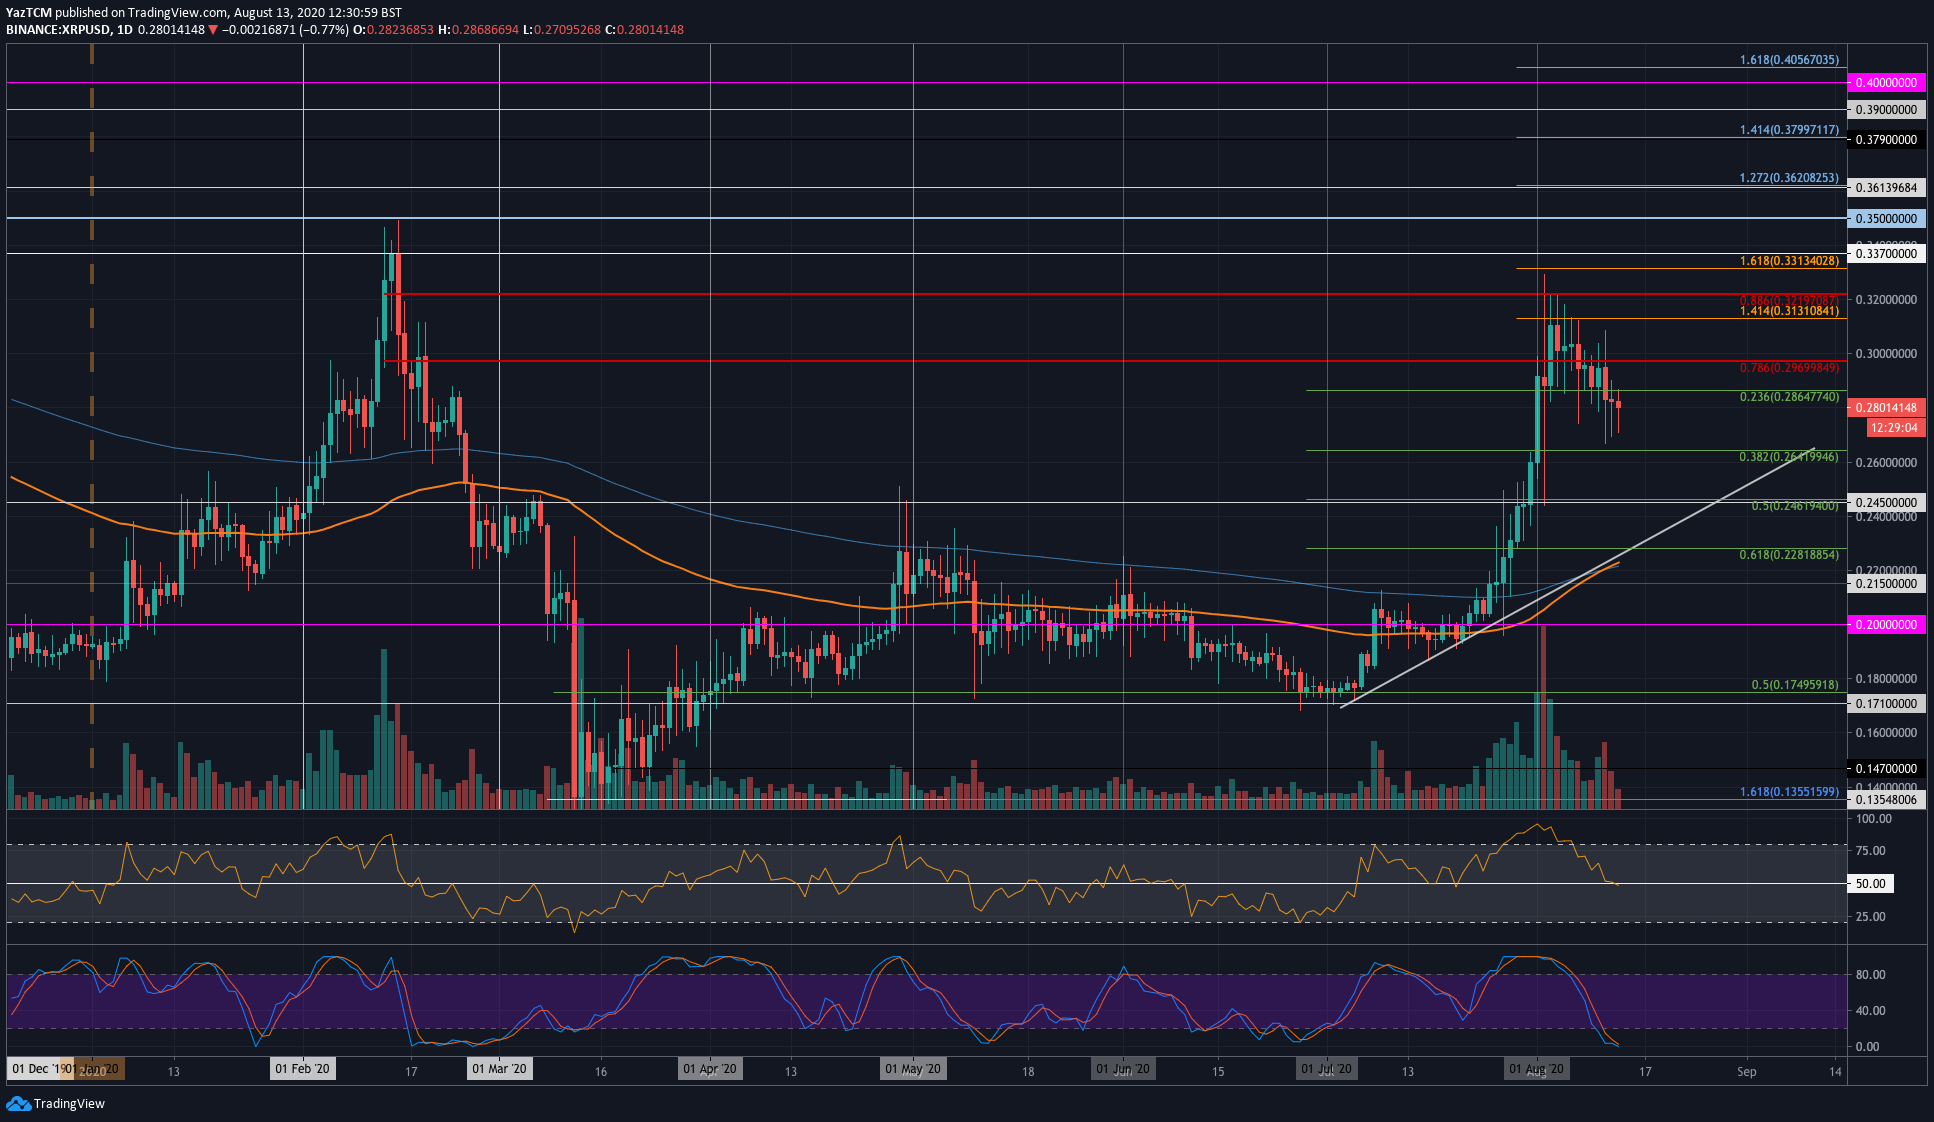
So far, XRP dropped by a total of 14% since hitting a peak of $0.329 earlier in August. More specifically, the coin was never able to close above resistance at $0.313 (1.414 Fib Extension), which caused the coin to roll over.
Over the past week, XRP dropped beneath the support at $0.3 and $0.286 (.236 Fib Retracement) as it reached the $0.28 level today. The buyers are attempting to defend the $0.28 level, but it looks like the momentum might be shifting into the bearish favor.
There has also been a slight increase in volume over the past 3-days as the buyers continue to try to defend the $0.28 support.

XRP-USD Short Term Price Prediction
Looking ahead, if the bulls can rebound from $0.28, the first level of strong resistance lies at $0.3. Above this, additional resistance is located at $0.313 (1.414 Fib Extension), $0.321 (bearish .886 Fib Retracement), and $0.331 (1.618 Fib Extension).
On the other side, if the sellers push beneath $0.28, the first level of support is then expected at $0.264 (.382 Fib Retracement). Beneath this, added support lies at $0.245 (.5 Fib Retracement) and the rising trend line at around $0.24.
The RSI dropped form overbought conditions at the start of August to reach the mid-line as indecision looms within the market. If the RSI does drop beneath 50, the momentum will shift into the bearish favor, and the market should head lower.
The Stochastic RSI is in oversold conditions and is primed for a bullish crossover signal.
XRP/BTC: XRP Drops Beneath 200-days EMA Support
Key Support Levels: 2330 SAT, 23000 SAT, 2285 SAT.
Key Resistance Levels: 2500 SAT, 2630 SAT, 2700 SAT.
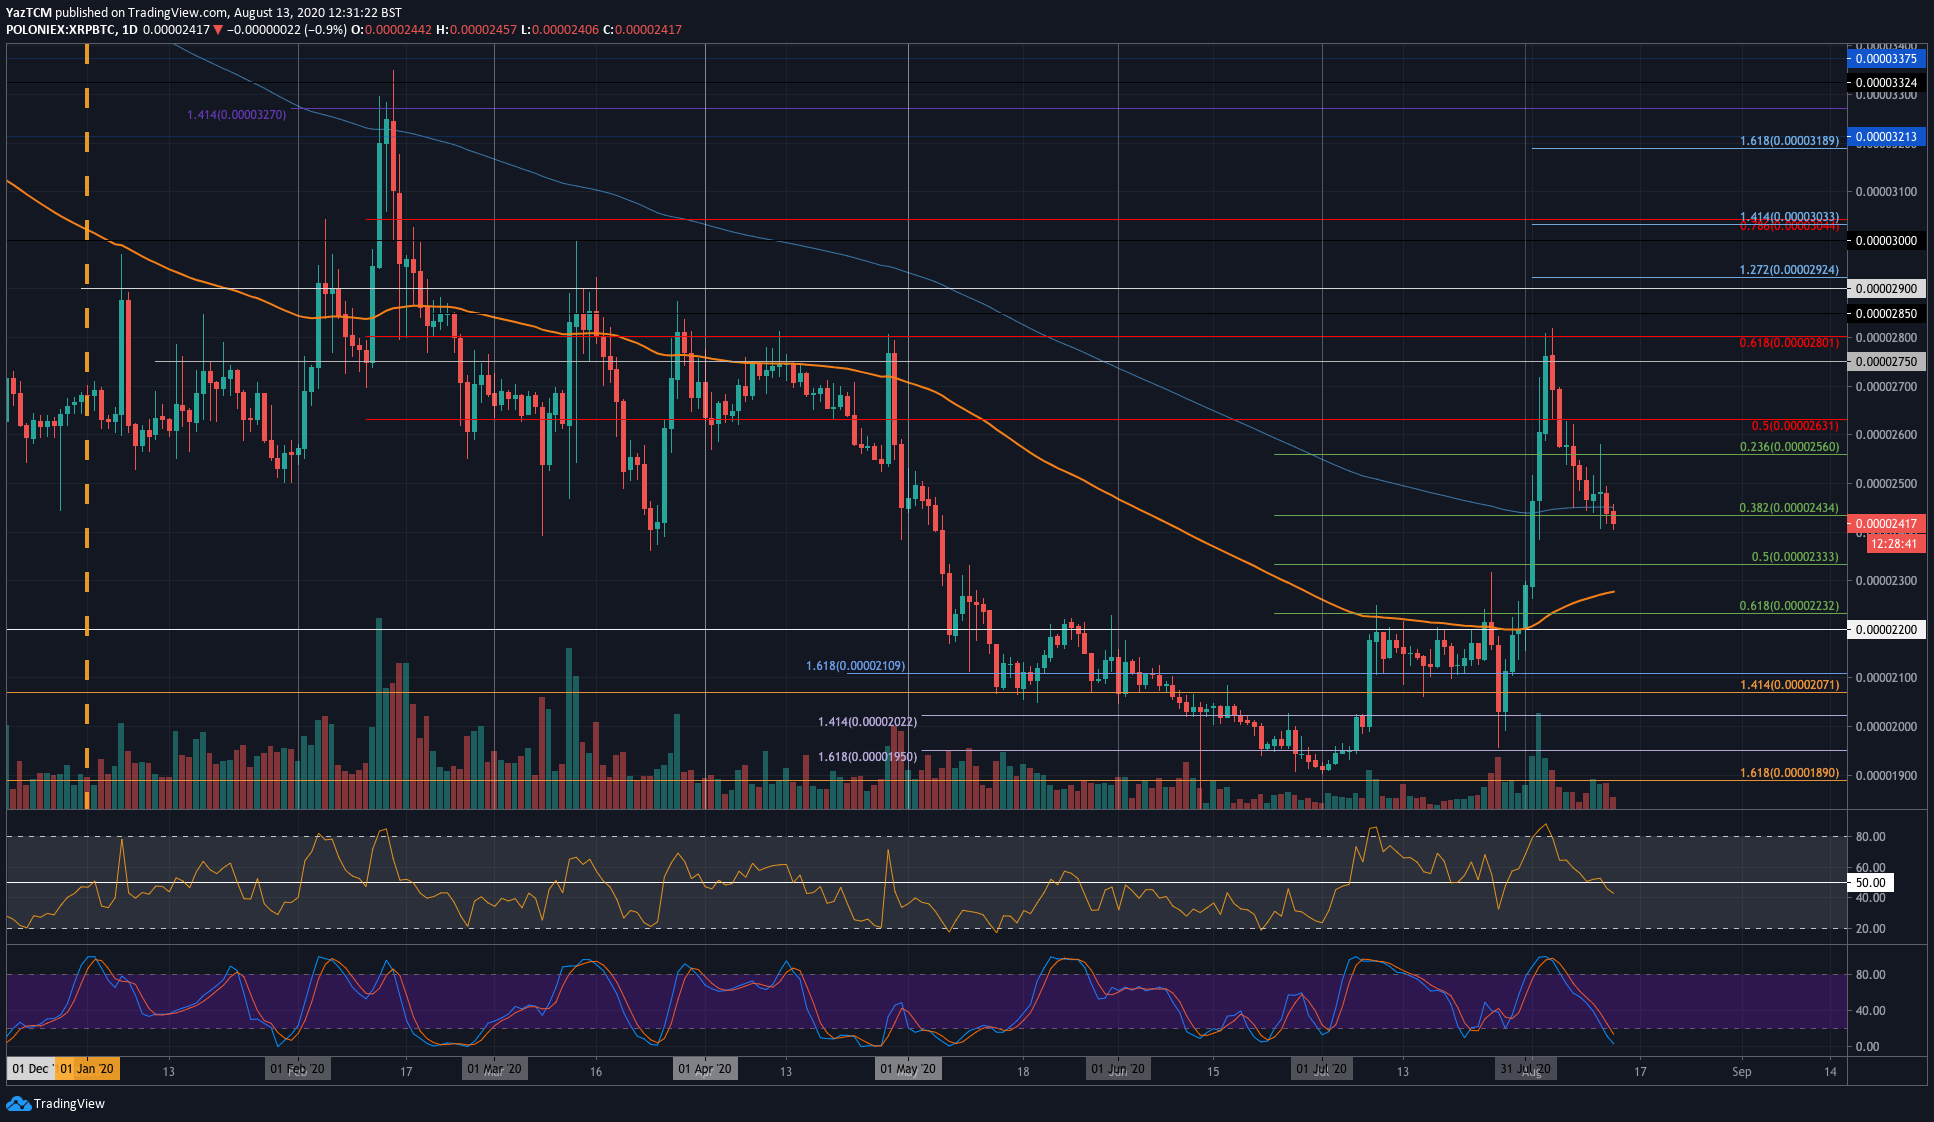
Against Bitcoin, XRP dropped beneath the support at the 200-days EMA yesterday. It continued to fall today as it slipped beneath the .382 Fib Retracement at 2435 SAT to reach the current 2410 SAT level.
XRP had met resistance earlier in the month at 2800 SAT as it ran into the bearish .618 Fib Retracement. It was unable to break above this level, which caused it to drop by a total of 14% so far.

XRP-BTC Short Term Price Prediction
Moving forward, if the sellers continue to drive XRP lower, the first level of support is expected at 2330 SAT (.5 Fib Retracement). Additional support then lies at 2300 SAT (100-days EMA).
On the other side, the 200-days EMA will provide the first level of resistance. This is followed by resistance at 2500 SAT, 2630 SAT (bearish .5 Fib Retracement), and 2700 SAT.
The RSI recently dipped beneath the 50 line to indicate that the sellers have taken charge of the market momentum. The Stochastic RSI is approaching oversold conditions, and a bullish crossover signal will be the first sign for recovery.
