SummaryXRP starts 2020 trapped within a narrow range between %excerpt%.20 and %excerpt%.1815.Against BTC, it is struggling to break above the crucial resistance at 2700 SAT.The cryptocurrency remains ranked in the 3rd place with a market cap of .39 billion.Key Support & Resistance LevelsXRP/USDSupport: %excerpt%.181, %excerpt%.17, %excerpt%.167. Resistance: %excerpt%.19, %excerpt%.20, %excerpt%.212.XRP/BTC:Support: 2600 SAT, 2530 SAT, 2455 SAT.Resistance: 2750 SAT, 2900 SAT, 3000 SAT.XRP/USD – When Will XRP Break This Present Range?The daily chart shows XRP bouncing from the support at %excerpt%.1815, allowing it to rise higher into the upper boundary of the resistance at %excerpt%.20. Ripple must break beyond this trading range before the next direction of the market can be ascertained. For a bullish recovery, XRP must ascend above the %excerpt%.20 resistance
Topics:
Yaz Sheikh considers the following as important: Ripple (XRP) Price, XRP Analysis
This could be interesting, too:
Mandy Williams writes Ripple Releases Institutional DeFi Roadmap for XRP Ledger in 2025
Jordan Lyanchev writes ChatGPT and DeepSeek Analyze Ripple’s (XRP) Price Potential for 2025
CryptoVizArt writes XRP Breakout Imminent? Ripple Price Analysis Suggests a Decisive Move
Dimitar Dzhondzhorov writes 6 Reasons Why This Finance Expert Dumped His Ripple (XRP) Holdings
Summary
- XRP starts 2020 trapped within a narrow range between $0.20 and $0.1815.
- Against BTC, it is struggling to break above the crucial resistance at 2700 SAT.
- The cryptocurrency remains ranked in the 3rd place with a market cap of $8.39 billion.
Key Support & Resistance Levels
XRP/USD
Support: $0.181, $0.17, $0.167.
Resistance: $0.19, $0.20, $0.212.
XRP/BTC:
Support: 2600 SAT, 2530 SAT, 2455 SAT.
Resistance: 2750 SAT, 2900 SAT, 3000 SAT.
XRP/USD – When Will XRP Break This Present Range?
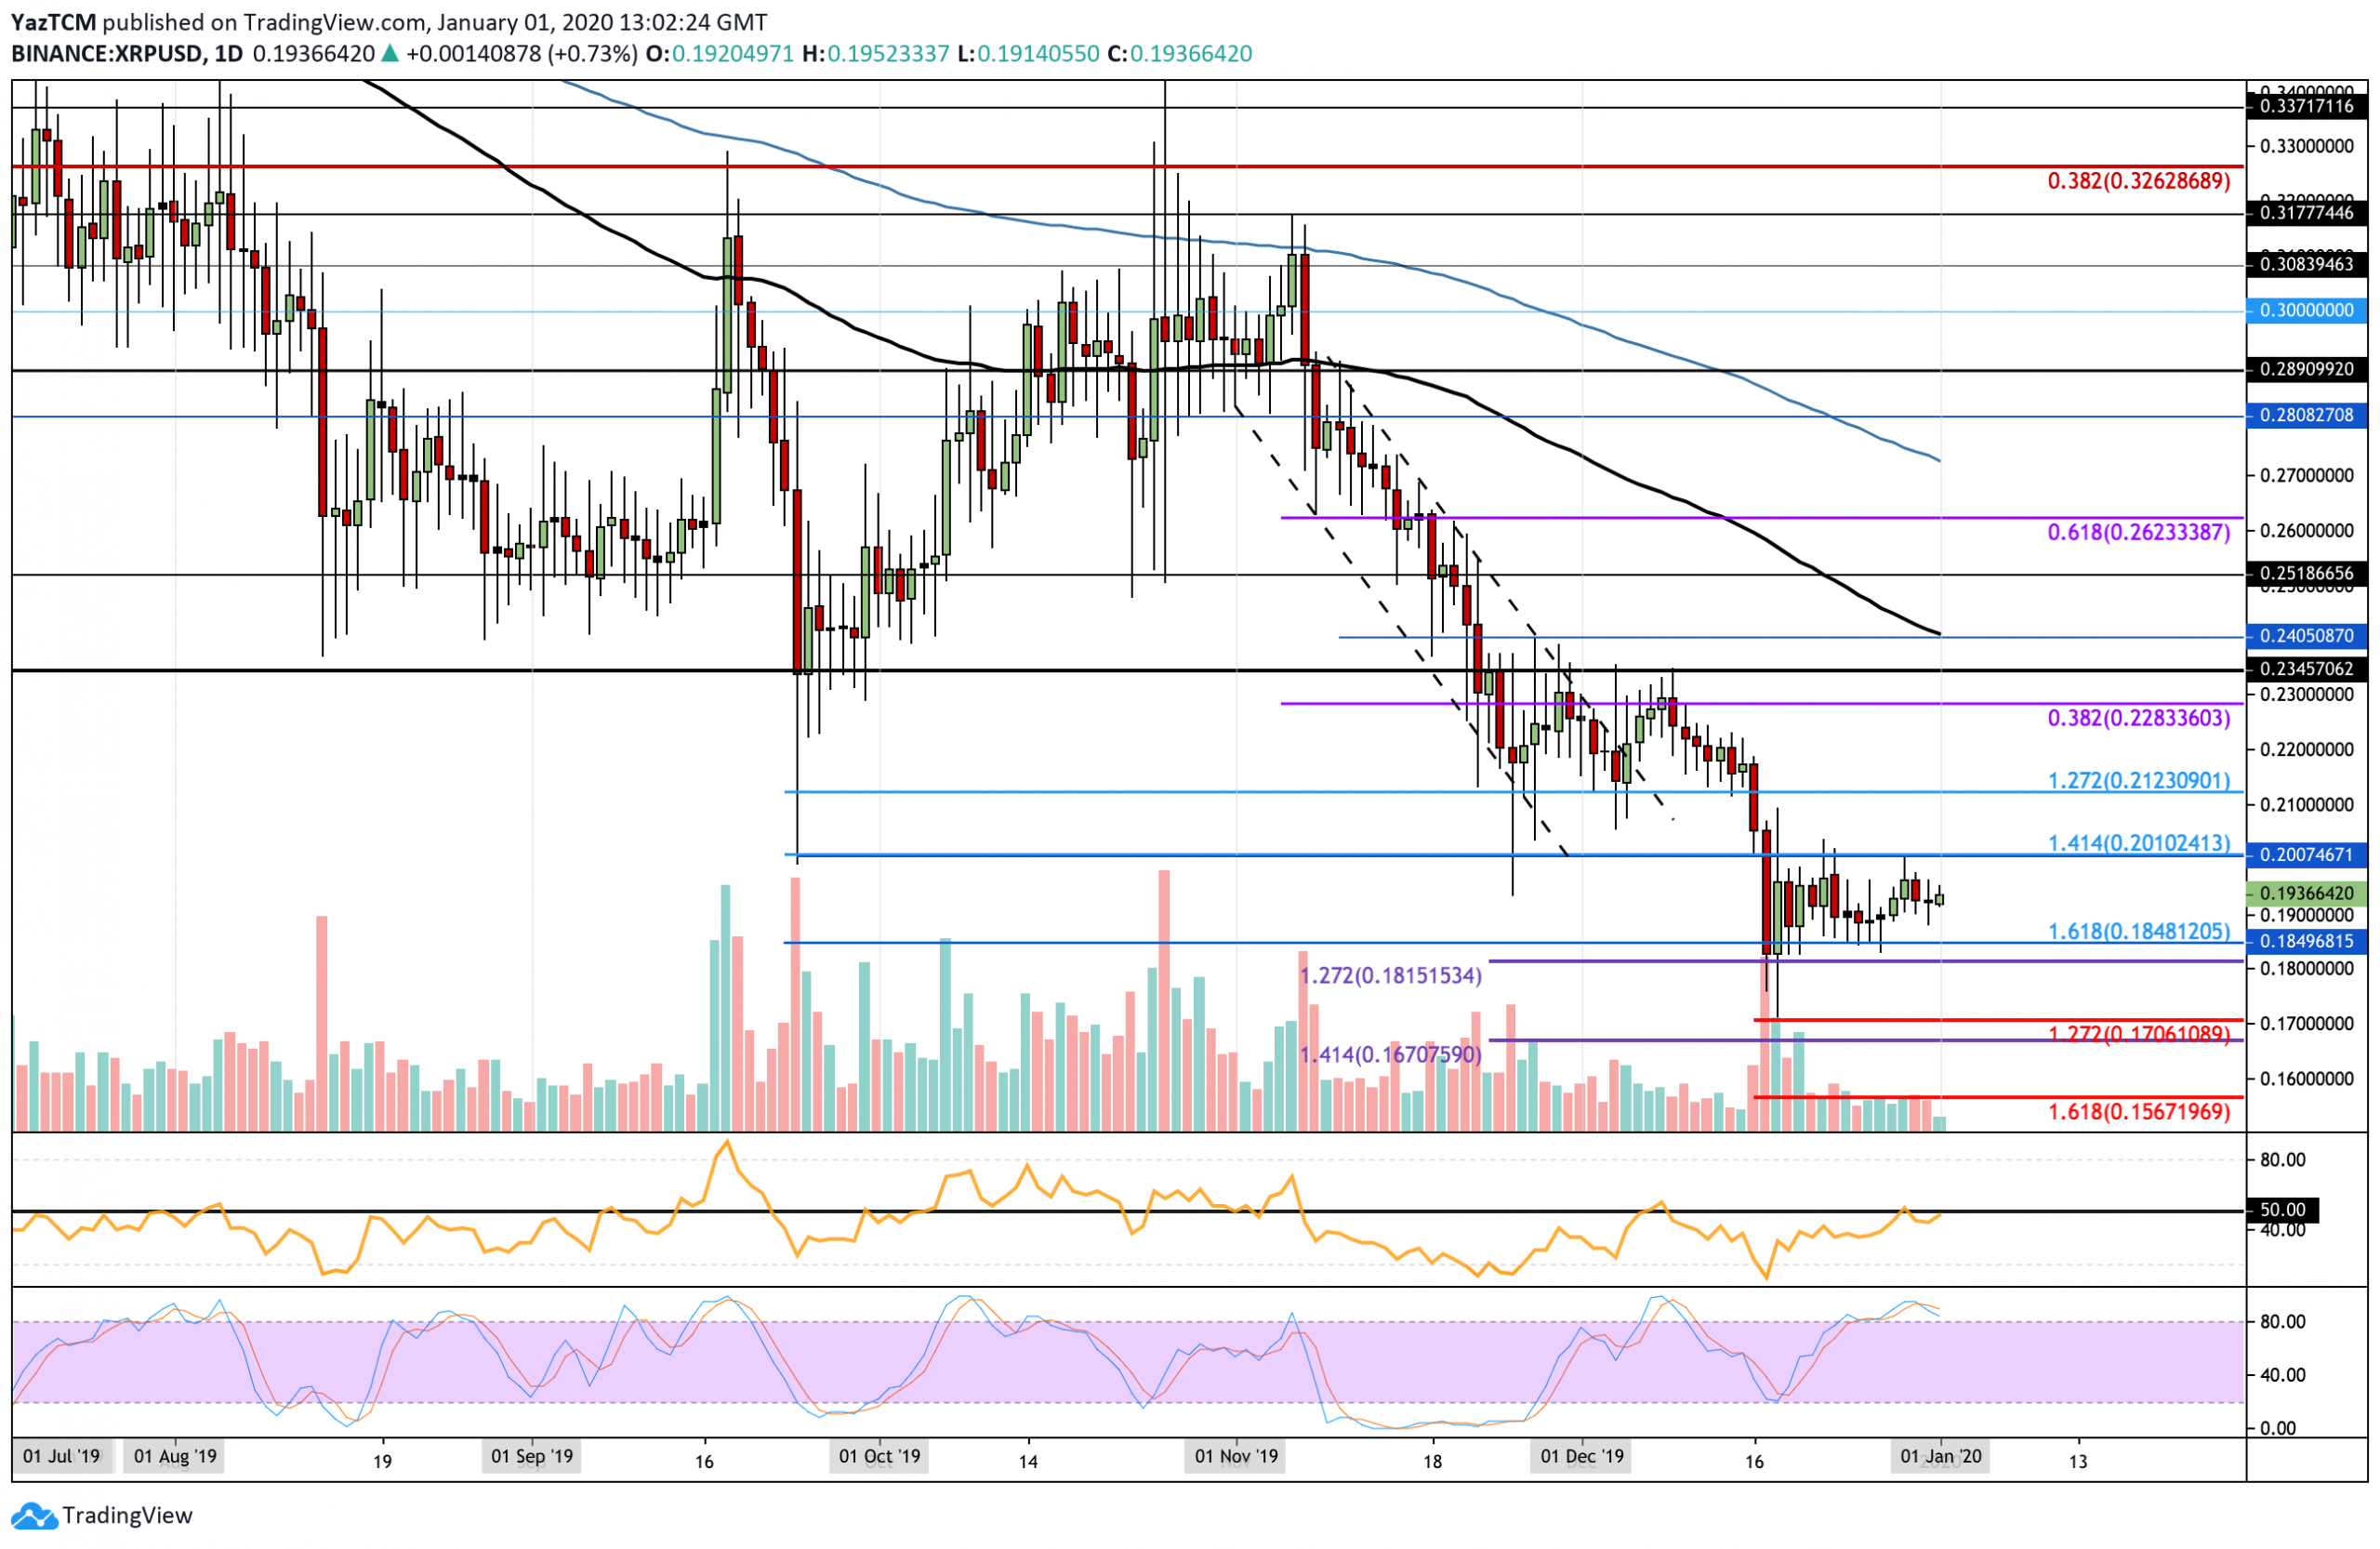
The daily chart shows XRP bouncing from the support at $0.1815, allowing it to rise higher into the upper boundary of the resistance at $0.20. Ripple must break beyond this trading range before the next direction of the market can be ascertained.
For a bullish recovery, XRP must ascend above the $0.20 resistance at the upper boundary. On the other hand, if XRP falls beneath the support at $0.1815, the market would continue its bearish trajectory. It lies within the breakout of the current trading range.
XRP Short Term Price Prediction
If the bulls manage to push higher, XRP will face strong resistance at the upper boundary of the trading range at $0.20. Above this, resistance lies at $0.212 and $0.2280 (bearish .382 Fib Retracement). Further higher lies $0.23, $0.24 which is provided by the 100-days EMA.
The RSI has risen into the 50 resistance level which shows the indecision within the market. For XRP to break above the upper boundary of the current trading range, the RSI must break above 50 to show that the bulls have taken charge of the market momentum. Furthermore, the Stochastic RSI is primed for a bearish crossover signal that will likely send the market to correct downward.
XRP/BTC – XRP Meets Resistance At 2700 SAT
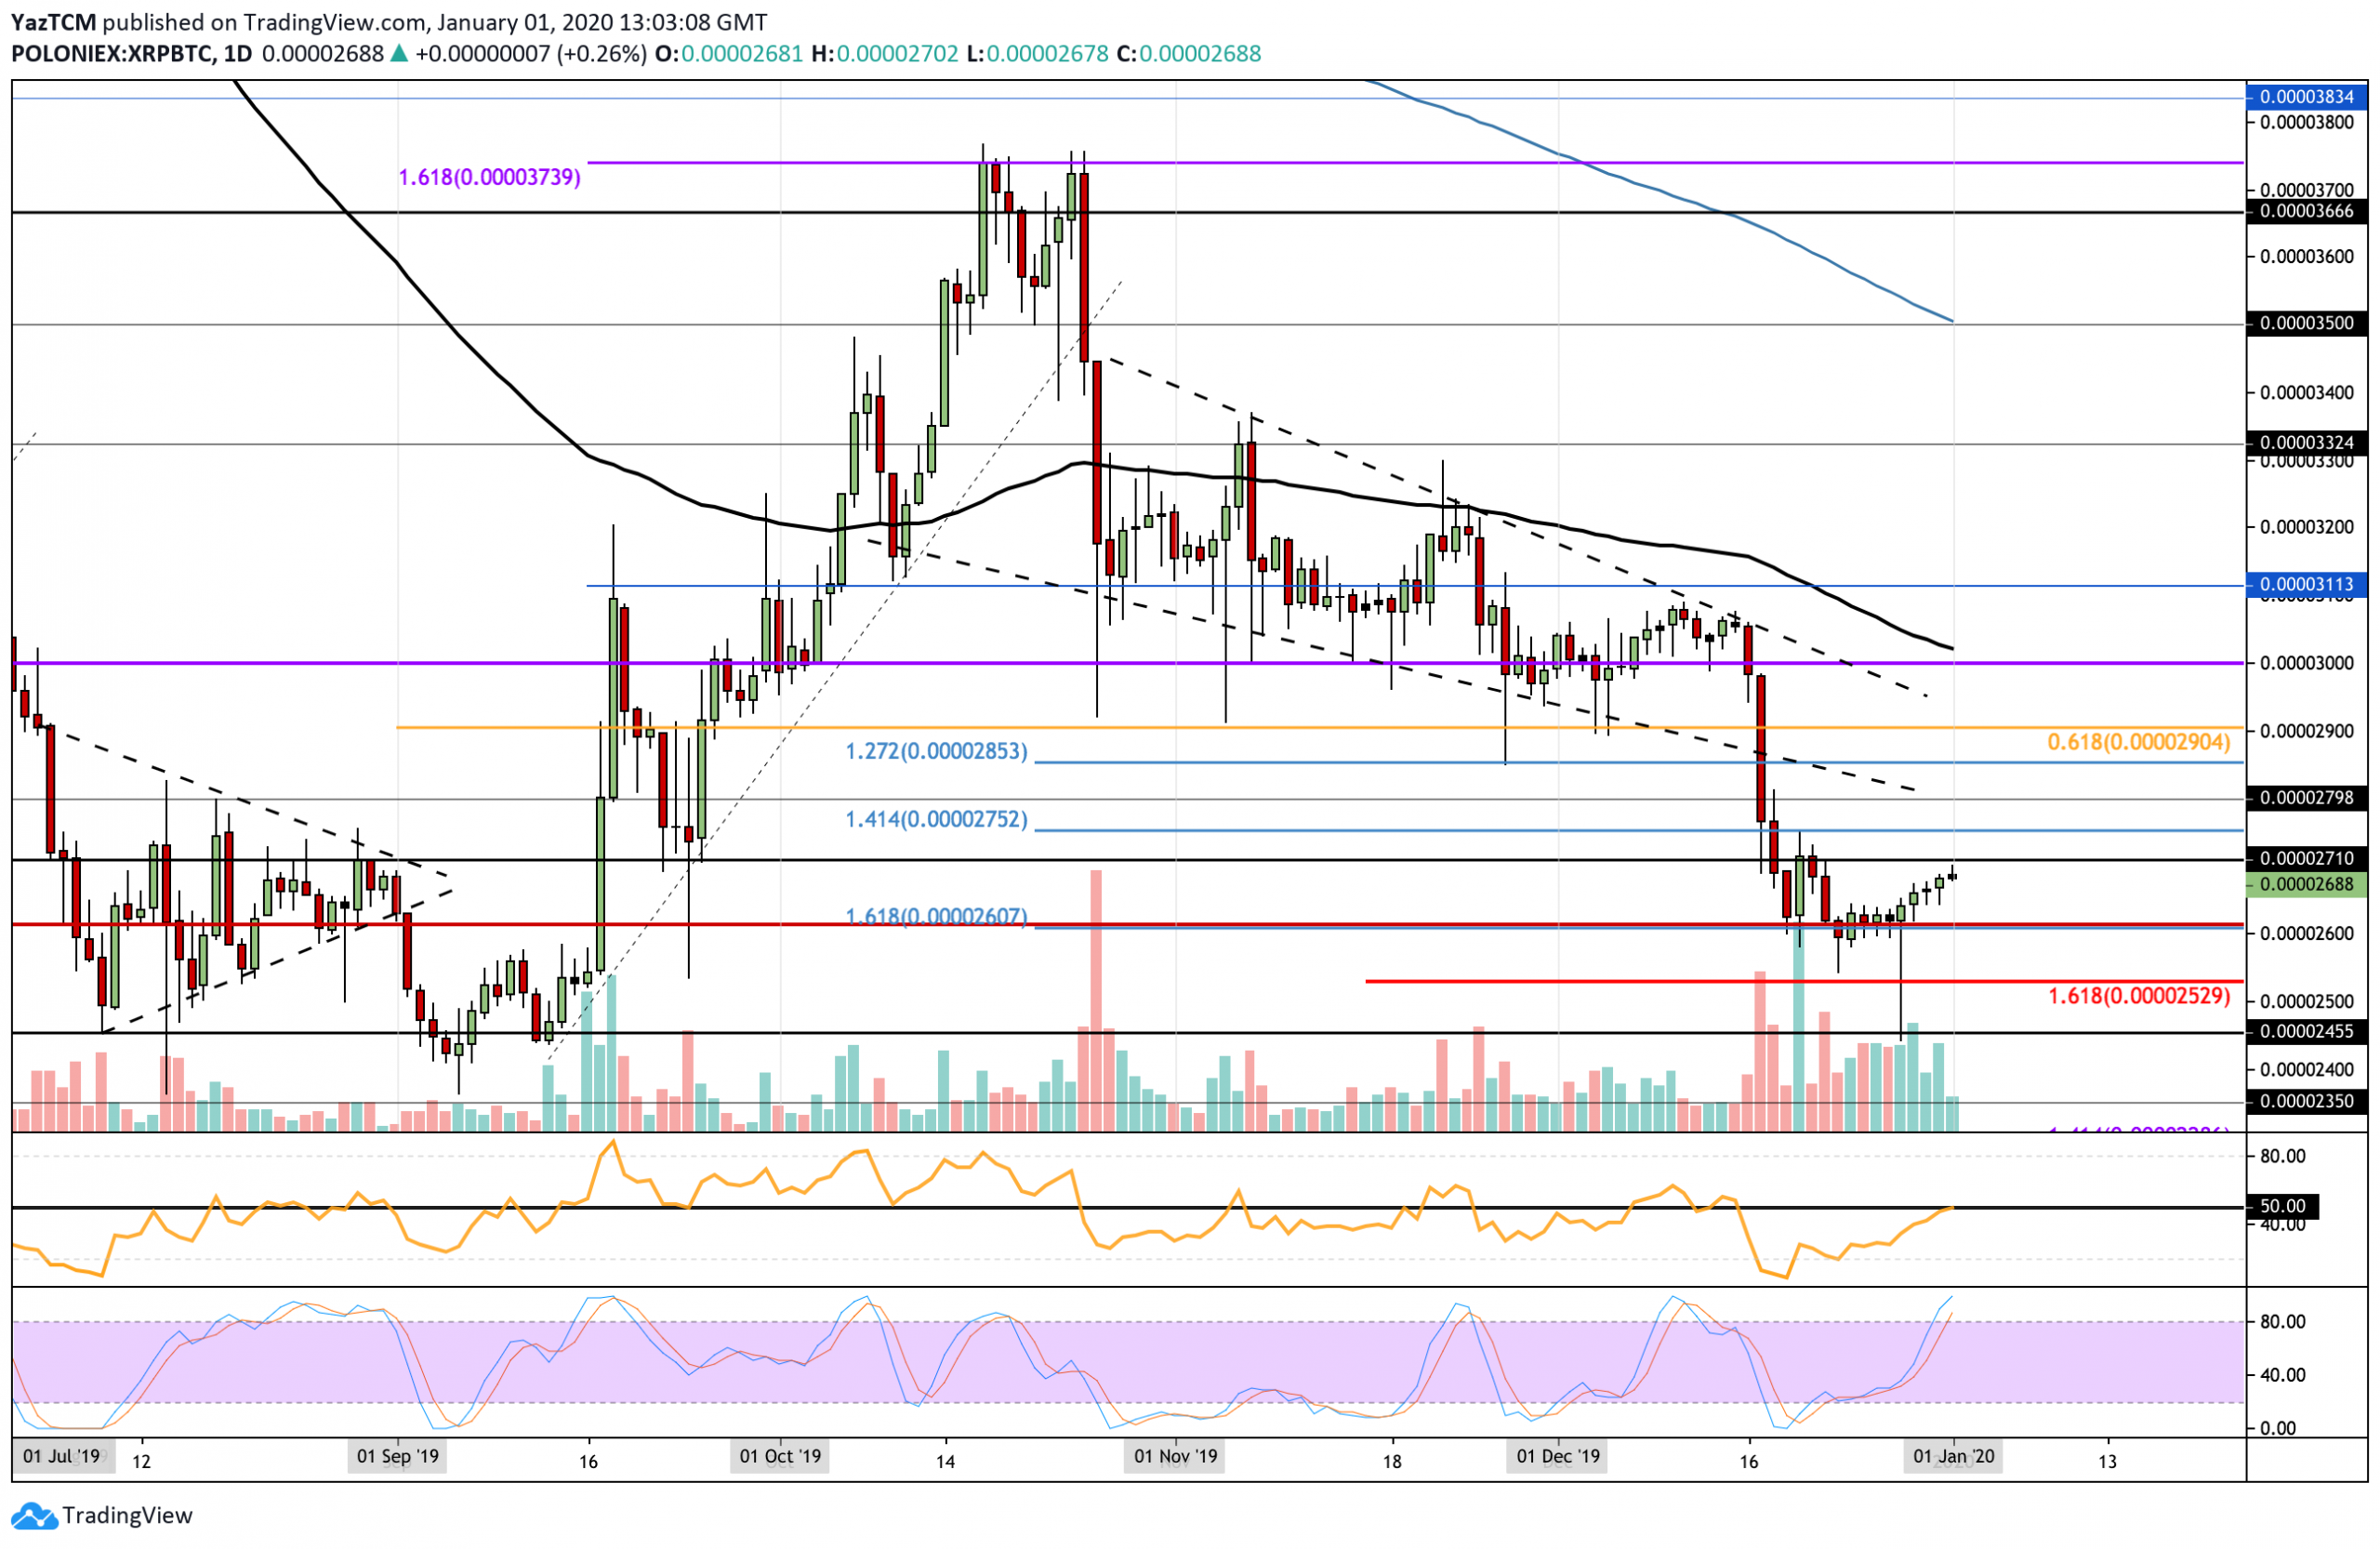
Against BTC, XRP found substantial resistance at 2600 SAT support, allowing it to gain higher toward the 2700 SAT resistance level slowly. It has been a very slow grind toward the 2700 SAT level, and it looks like the bulls may not have the required momentum to continue further higher at this moment in time.
For XRP/BTC to turn bullish, the coin must rise further higher and break above the 3000 SAT resistance level. If XRP were to drop beneath the support at 2600 SAT, the market would continue along its bearish route.
XRP Short Term Price Prediction
If the bulls manage to break above the current resistance at 2700 SAT, immediate higher resistance is expected at 2752 SAT and 2800 SAT. Beyond 2800 SAT, resistance lies at 2900 SAT and 3000 SAT. On the other hand, if the sellers push XRP lower from the 2700 SAT resistance, strong support is located at 2600 SAT. Beneath this, additional support is located at 2530 SAT (downside 1.618 Fib Extension), 2455 SAT, and 2400 SAT.
The RSI has risen toward the 50 level. However, the bulls do not look strong enough to take over the momentum at this moment in time. Furthermore, the Stochastic RSI is lined up for a bearish crossover signal that will send the market lower.


