XRP has found some solid support at %excerpt%.227 which is preventing an extended bearish trend from formingThe cryptocurrency lost a total of 16% over the past 7-days before reaching the aforementioned supportAgainst Bitcoin, XRP is holding strong as it remains above the 2600 SAT levelKey Support & Resistance LevelsXRP/USD:Support: %excerpt%.227, %excerpt%.22, %excerpt%.21.Resistance: %excerpt%.235, %excerpt%.245, %excerpt%.25.XRP/BTC:Support: 2640 SAT, 2600 SAT, 2550 SAT.Resistance: 2710 SAT, 2750 SAT, 2800 SAT.XRP/USD: Ripple Finds Support At .886 Fib – Will It Hold?Since our last analysis, XRP held the support provided by the .886 Fibonacci Retracement level at %excerpt%.227. It briefly dipped lower but found additional support at %excerpt%.22, provided by a downside 1.272 Fib Extension level.The bulls are now doing all they can to hold at this
Topics:
Yaz Sheikh considers the following as important: Ripple (XRP) Price, XRP Analysis
This could be interesting, too:
Mandy Williams writes Ripple Releases Institutional DeFi Roadmap for XRP Ledger in 2025
Jordan Lyanchev writes ChatGPT and DeepSeek Analyze Ripple’s (XRP) Price Potential for 2025
CryptoVizArt writes XRP Breakout Imminent? Ripple Price Analysis Suggests a Decisive Move
Dimitar Dzhondzhorov writes 6 Reasons Why This Finance Expert Dumped His Ripple (XRP) Holdings
- XRP has found some solid support at $0.227 which is preventing an extended bearish trend from forming
- The cryptocurrency lost a total of 16% over the past 7-days before reaching the aforementioned support
- Against Bitcoin, XRP is holding strong as it remains above the 2600 SAT level
Key Support & Resistance Levels
XRP/USD:
Support: $0.227, $0.22, $0.21.
Resistance: $0.235, $0.245, $0.25.
XRP/BTC:
Support: 2640 SAT, 2600 SAT, 2550 SAT.
Resistance: 2710 SAT, 2750 SAT, 2800 SAT.
XRP/USD: Ripple Finds Support At .886 Fib – Will It Hold?
Since our last analysis, XRP held the support provided by the .886 Fibonacci Retracement level at $0.227. It briefly dipped lower but found additional support at $0.22, provided by a downside 1.272 Fib Extension level.
The bulls are now doing all they can to hold at this support to prevent the market from entering into an extended bearish run. A break and close beneath $0.227 would certainly facilitate a further price drop toward the $0.20 level.
Right now, XRP remains neutral after finding support at $0.227 over the past 6-days of trading.
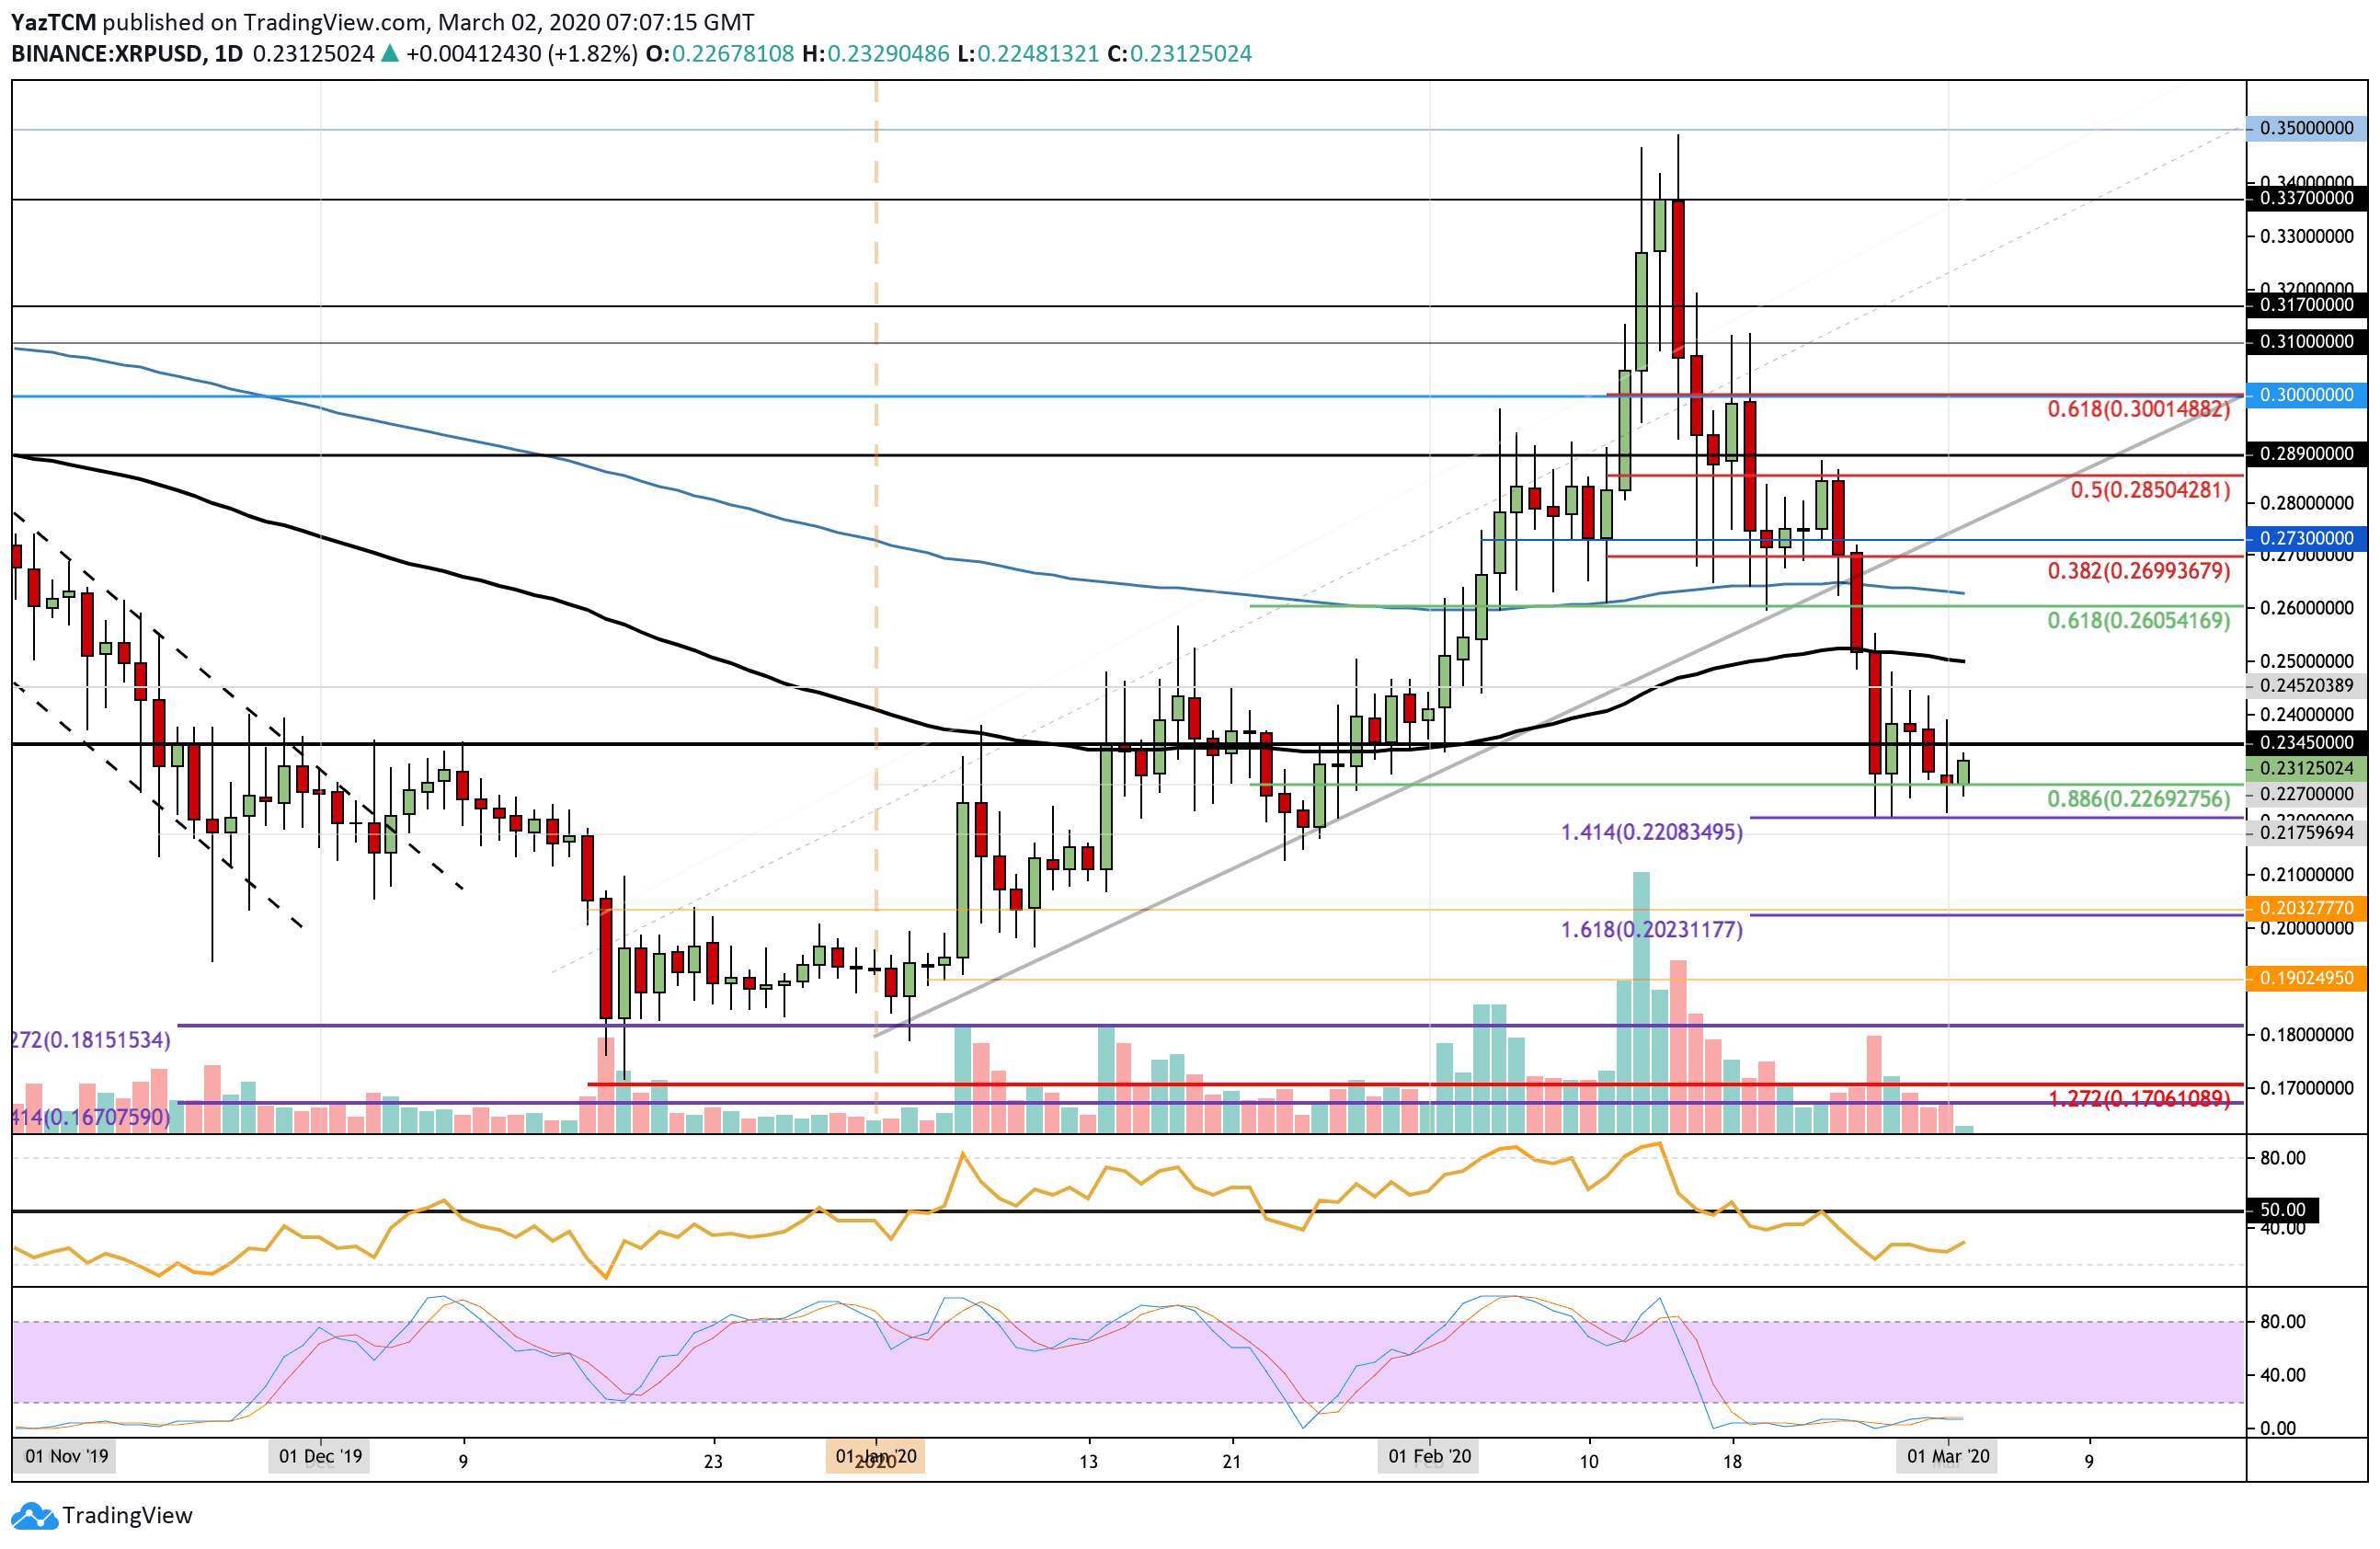
XRP Short Term Price Prediction
If the sellers do break and close beneath $0.227, support is located at $0.22 (downside 1.414 Fib Extension). This is followed by support at $0.217, $0.21, and $0.202 (downside 1.618 Fib Extension).
On the other side, if the buyers break $0.235, higher resistance is located at $0.245, $0.25 (100-days EMA), and $0.261 (200-days EMA). This is followed by resistance at $0.27 and $0.285 (bearish .5 Fib Retracement).
The RSI has bounced from extremely oversold conditions which shows that the selling momentum is no longer increasing. As it increases toward the 50 level, this will show that the selling pressure is fading.
XRP/BTC: Ripple Continues To Remain Above 2600 SAT.
Since our last analysis, XRP managed to rebound from the support at 2595 SAT (.886 Fib Retracement) and push higher. It ran into resistance at 2750 SAT which caused it to roll over back beneath 2700 SAT, however, it found support at 2640 SAT (downside 1.414 Fib Extension).
XRP remains neutral against Bitcoin and would need to push above 2850 SAT before turning bullish. A close beneath 2600 SAT would extend the previous bearish momentum.
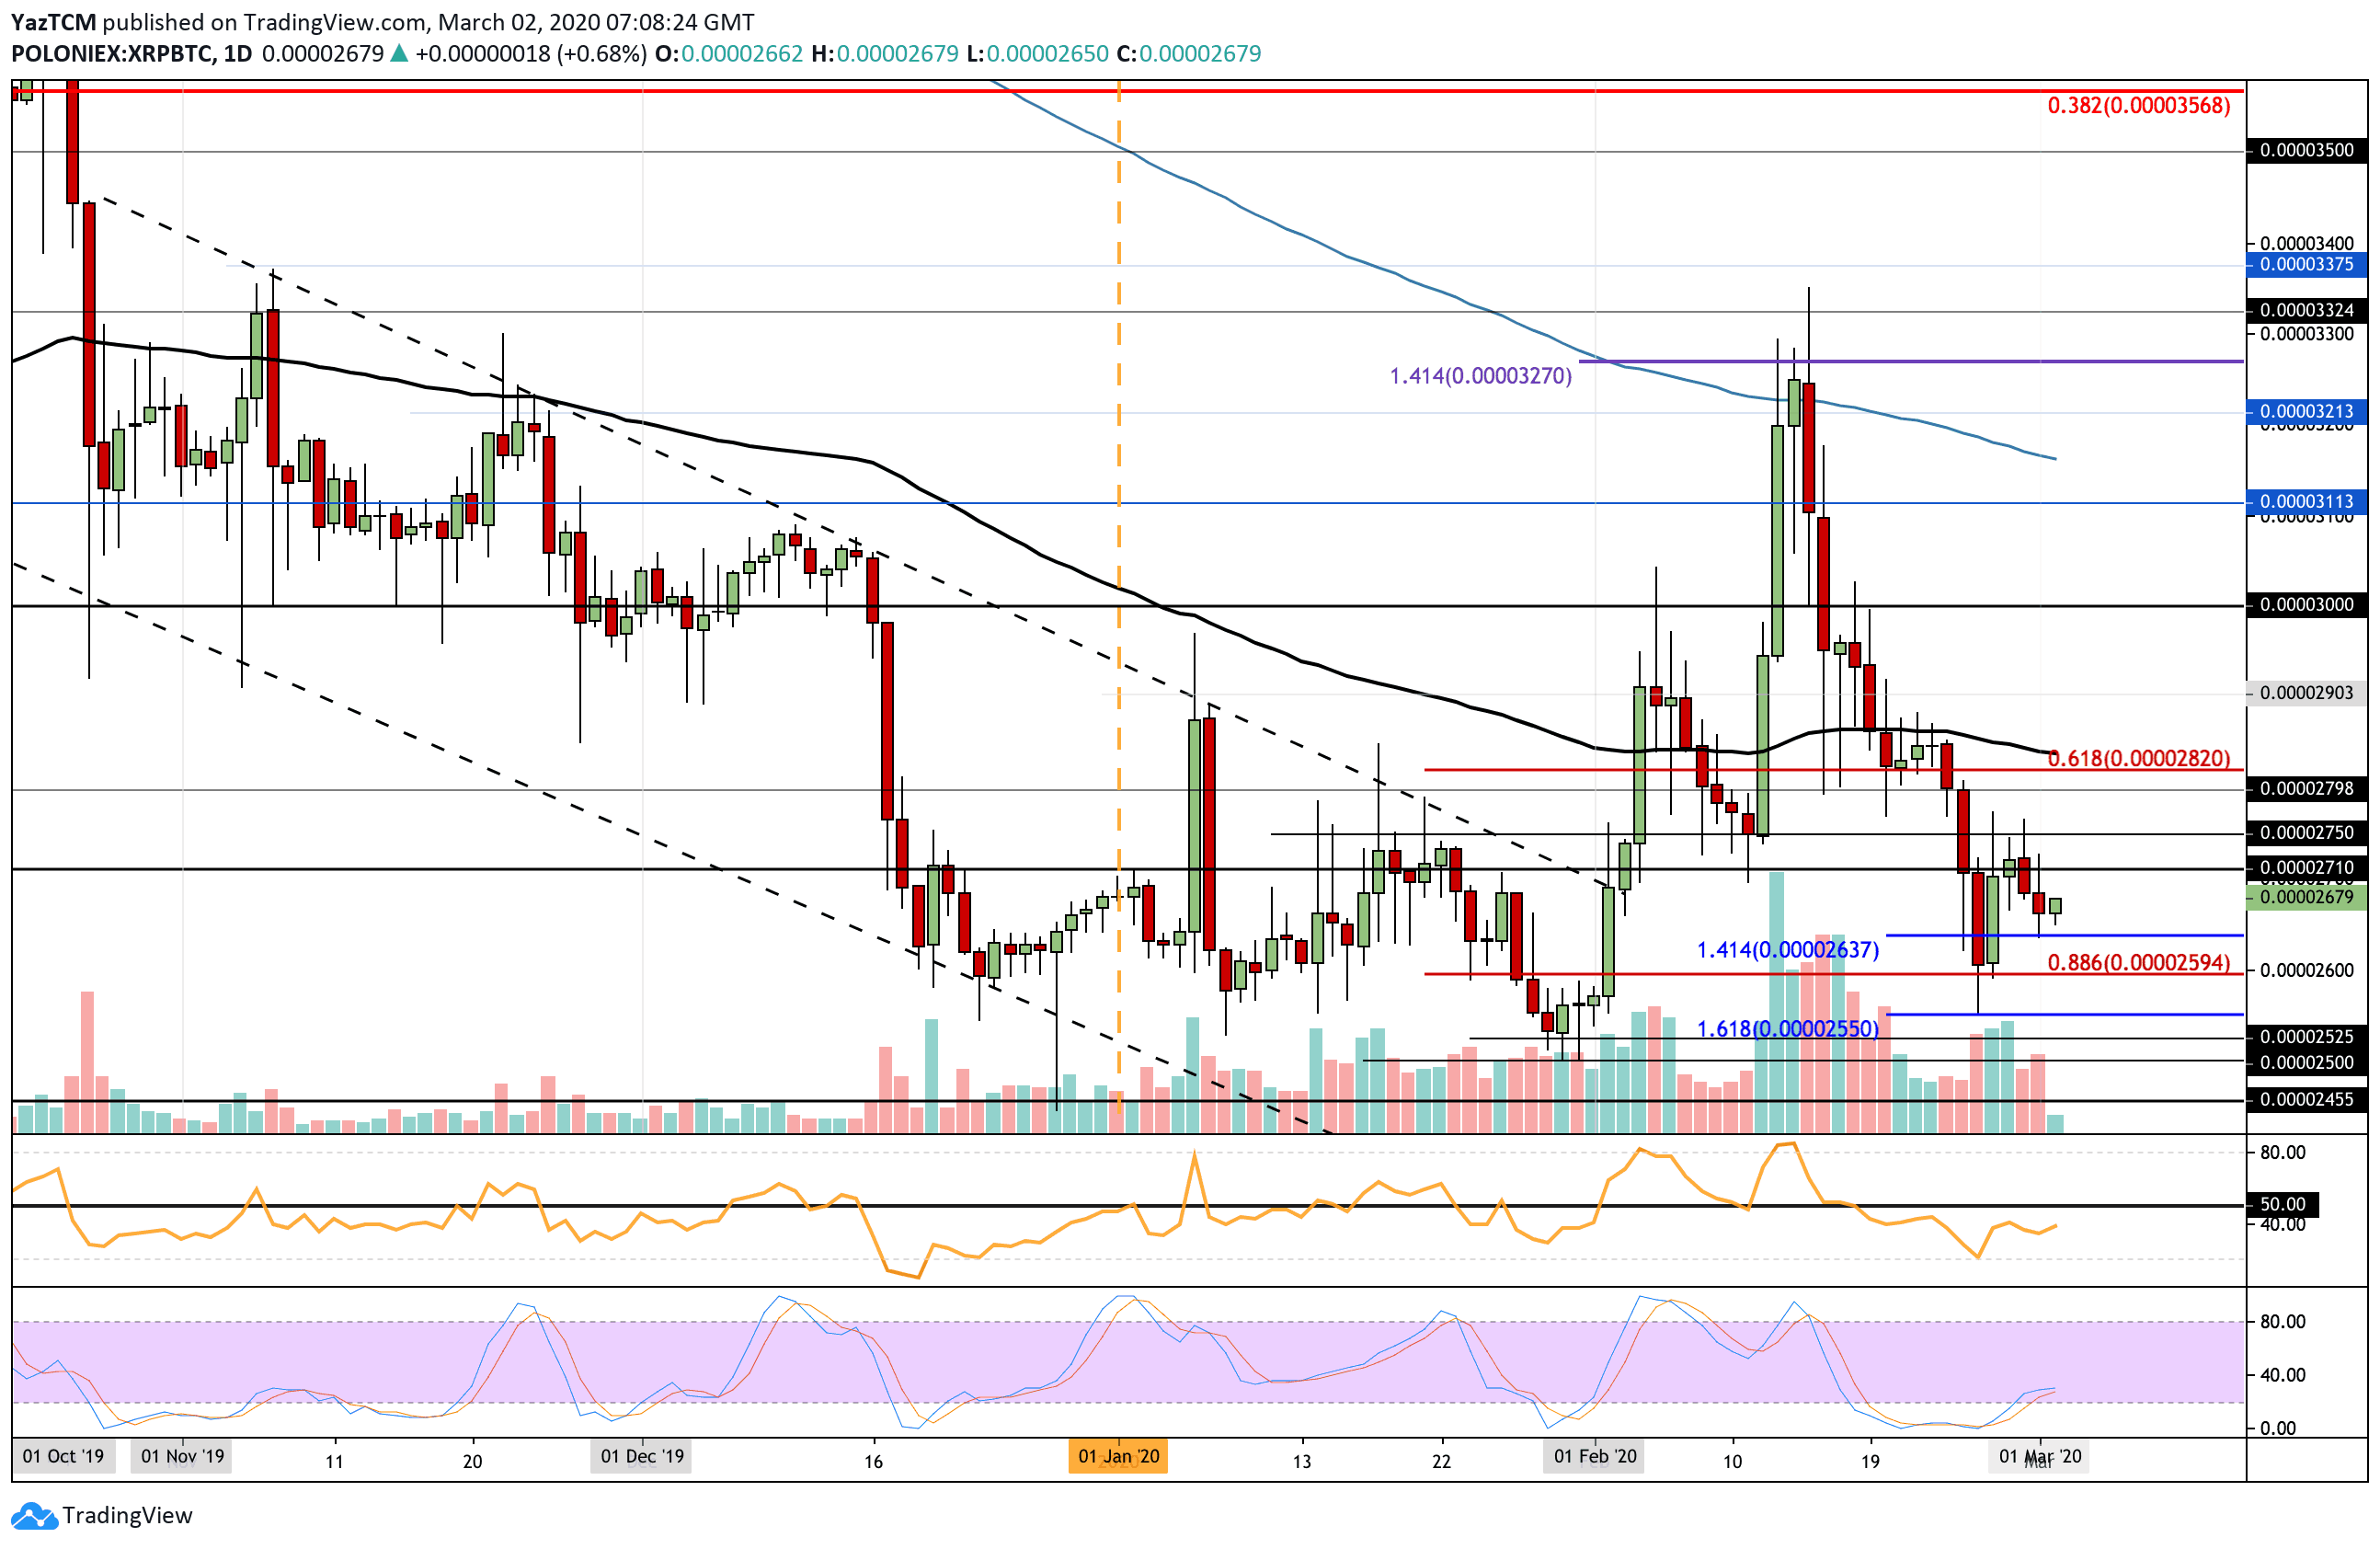
XRP Short Term Price Prediction
If the bulls continue to drive higher, resistance is found at 2710 SAT and 2750 SAT. This is followed by resistance at 2800 SAT, 2830 SAT (100-days EMA), and 2900 SAT.
On the other side, support lies at 2640 SAT (downside 1.414 Fib Extension) and 2595 SAT (.886 Fib Retracement). Beneath this, support lies at 2550 SAT (downside 1.618 Fib Extension) and 2525 SAT.
The RSI is quickly making its way toward the 50 level which shows the bearish momentum is fading. A break above 50 would confirm that the buyers have regained possession over the market momentum. The Stochastic RSI also produced a bullish crossover signal as the bullish pressure starts to revive.