XRP dropped by 2% over the past 24 hours, which caused it to fall beneath %excerpt%.18 as it reached %excerpt%.177.The cryptocurrency collapsed beneath the lower boundary of a descending triangle pattern this week, which sparked a downturn.Against Bitcoin, XRP is in disaster mode as it continues to plummet further beneath the 2000 SAT support.Key Support & Resistance LevelsXRP/USD:Support: %excerpt%.175, %excerpt%.171, %excerpt%.157.Resistance: %excerpt%.185, %excerpt%.192, %excerpt%.20.XRP/BTC:Support: 1950 SAT, 1900 SAT, 1890 SAT.Resistance: 2000 SAT, 2070 SAT, 2100 SAT.XRP/USD: XRP Finds Support At .5 Fib Beneath TriangleThe bulls were battling to keep XRP above a descending triangle throughout the past week. However, it eventually broke beneath the triangle and fell below the %excerpt%.18 level today with the 2% price drop.XRP found support at
Topics:
Yaz Sheikh considers the following as important: Ripple (XRP) Price, XRP Analysis, xrpbtc, xrpusd
This could be interesting, too:
Jordan Lyanchev writes Ripple, Dogecoin Whales Bought the Dip as XRP, DOGE Prices Soar
Jordan Lyanchev writes Why Did Ripple’s (XRP) Price Crash by 18% in 36 Hours?
Dimitar Dzhondzhorov writes Top Ripple (XRP) Price Predictions as of Late
Chayanika Deka writes What Does MDIA Tell Us About XRP, DOGE, and BTC’s Upcoming Trends?
- XRP dropped by 2% over the past 24 hours, which caused it to fall beneath $0.18 as it reached $0.177.
- The cryptocurrency collapsed beneath the lower boundary of a descending triangle pattern this week, which sparked a downturn.
- Against Bitcoin, XRP is in disaster mode as it continues to plummet further beneath the 2000 SAT support.
Key Support & Resistance Levels
XRP/USD:
Support: $0.175, $0.171, $0.157.
Resistance: $0.185, $0.192, $0.20.
XRP/BTC:
Support: 1950 SAT, 1900 SAT, 1890 SAT.
Resistance: 2000 SAT, 2070 SAT, 2100 SAT.
XRP/USD: XRP Finds Support At .5 Fib Beneath Triangle
The bulls were battling to keep XRP above a descending triangle throughout the past week. However, it eventually broke beneath the triangle and fell below the $0.18 level today with the 2% price drop.
XRP found support at $0.175, which is provided by a .5 Fibonacci Retracement level. A close beneath this could see the cryptocurrency headed lower toward $0.16.
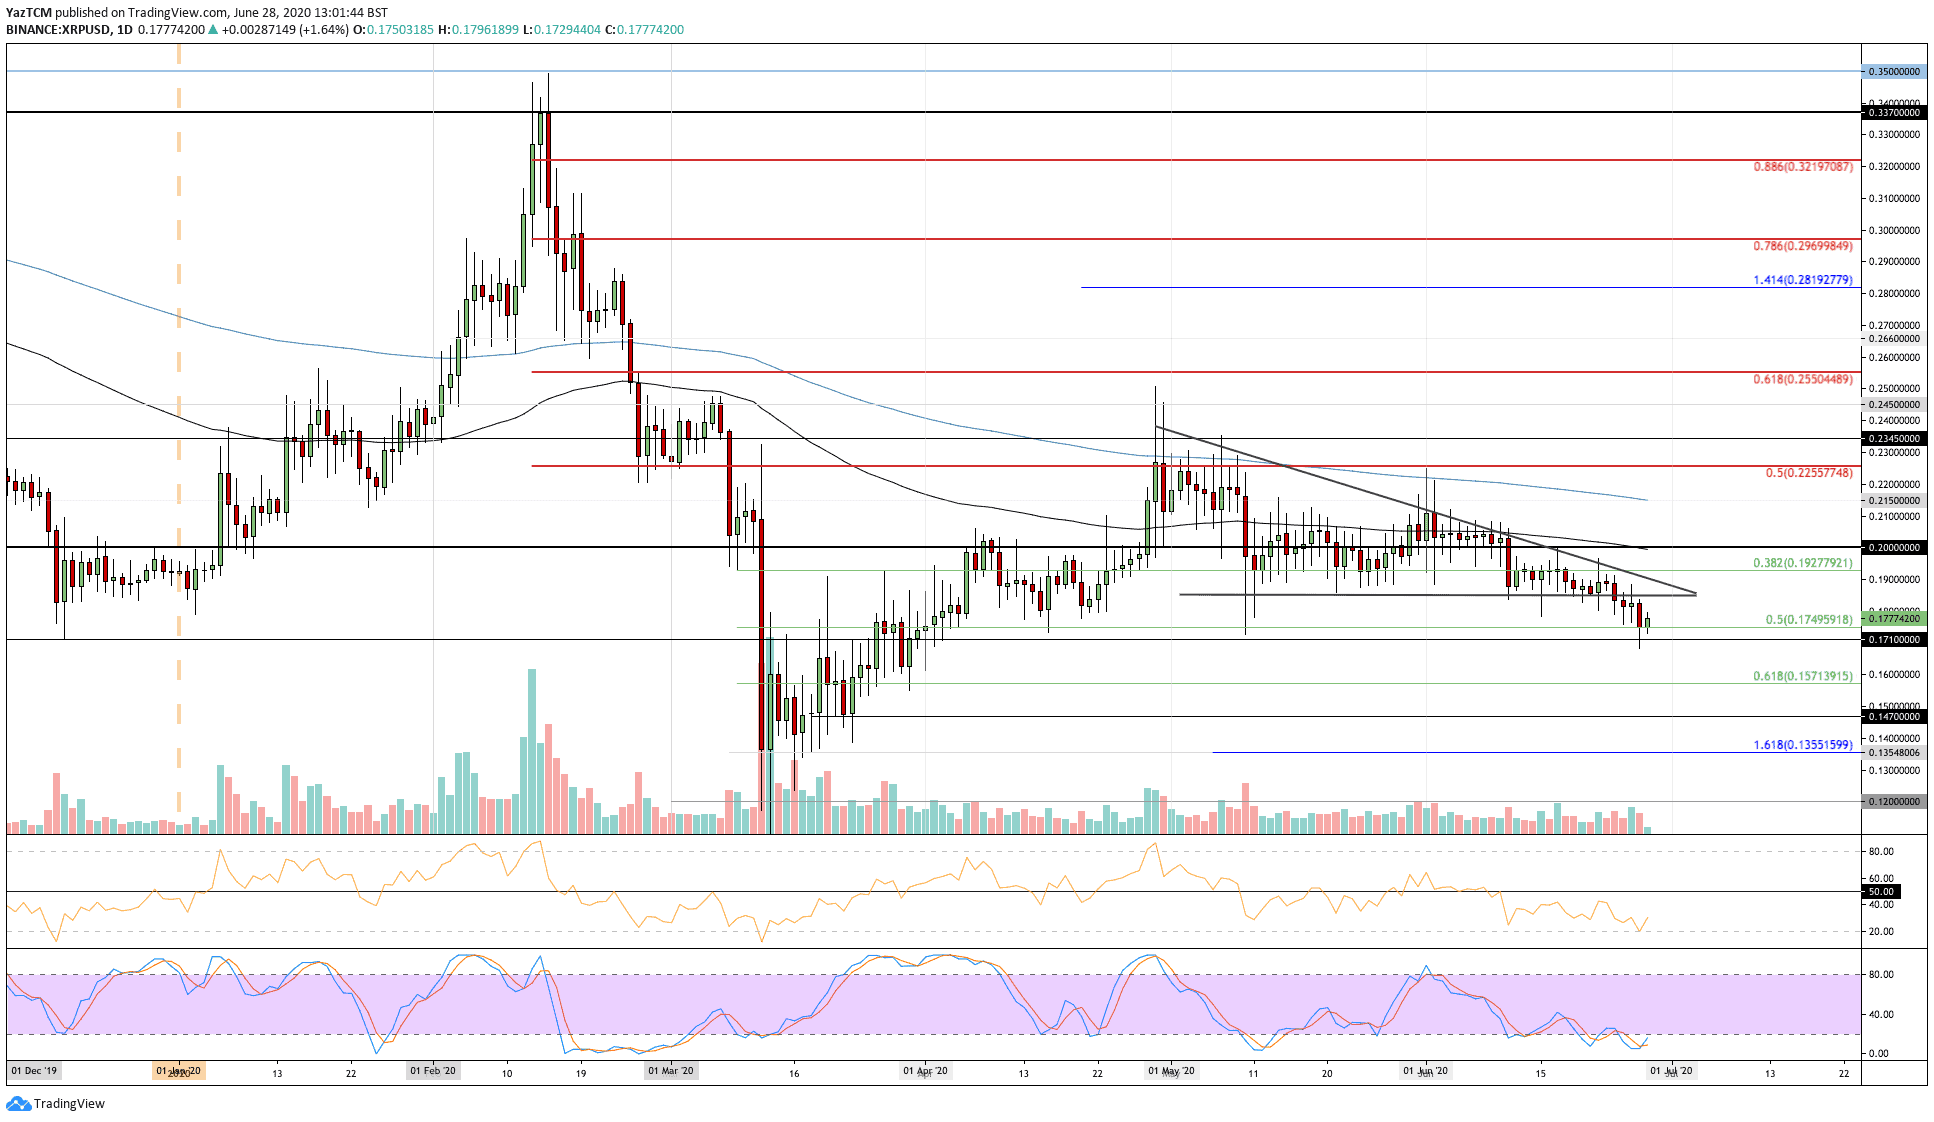
XRP-USD Short Term Price Prediction
Looking ahead, if the sellers push beneath the .5 Fib Retracement at $0.175, the first level of support lies at $0.171. Beneath this, added support is found at $0.157 (.618 Fib Retracement) and $0.15.
On the other side, the first level of resistance is expected at $0.185. Additional resistance above is located at $0.192 and $0.20 (100-days EMA).
The RSI dropped into oversold conditions yesterday but managed to rebound from here today. The sellers are still in control of the market momentum, but if the RSI continues to rise toward the 50 line, this would indicate that the selling momentum is fading.
XRP/BTC: XRP In Disaster Mode Beneath 1950 SAT
The situation has been pretty dire for XRP over the past few months after the coin fell from February high of around 3300 SAT to drop to the current price of 1964 SAT. This equates to a 40% price drop over four months. XRP spiked even lower yesterday as the coin dropped into the 1910 SAT region.
A closing candle beneath 1950 SAT could cause XRP to continue to head lower toward 1800 SAT over the following week.
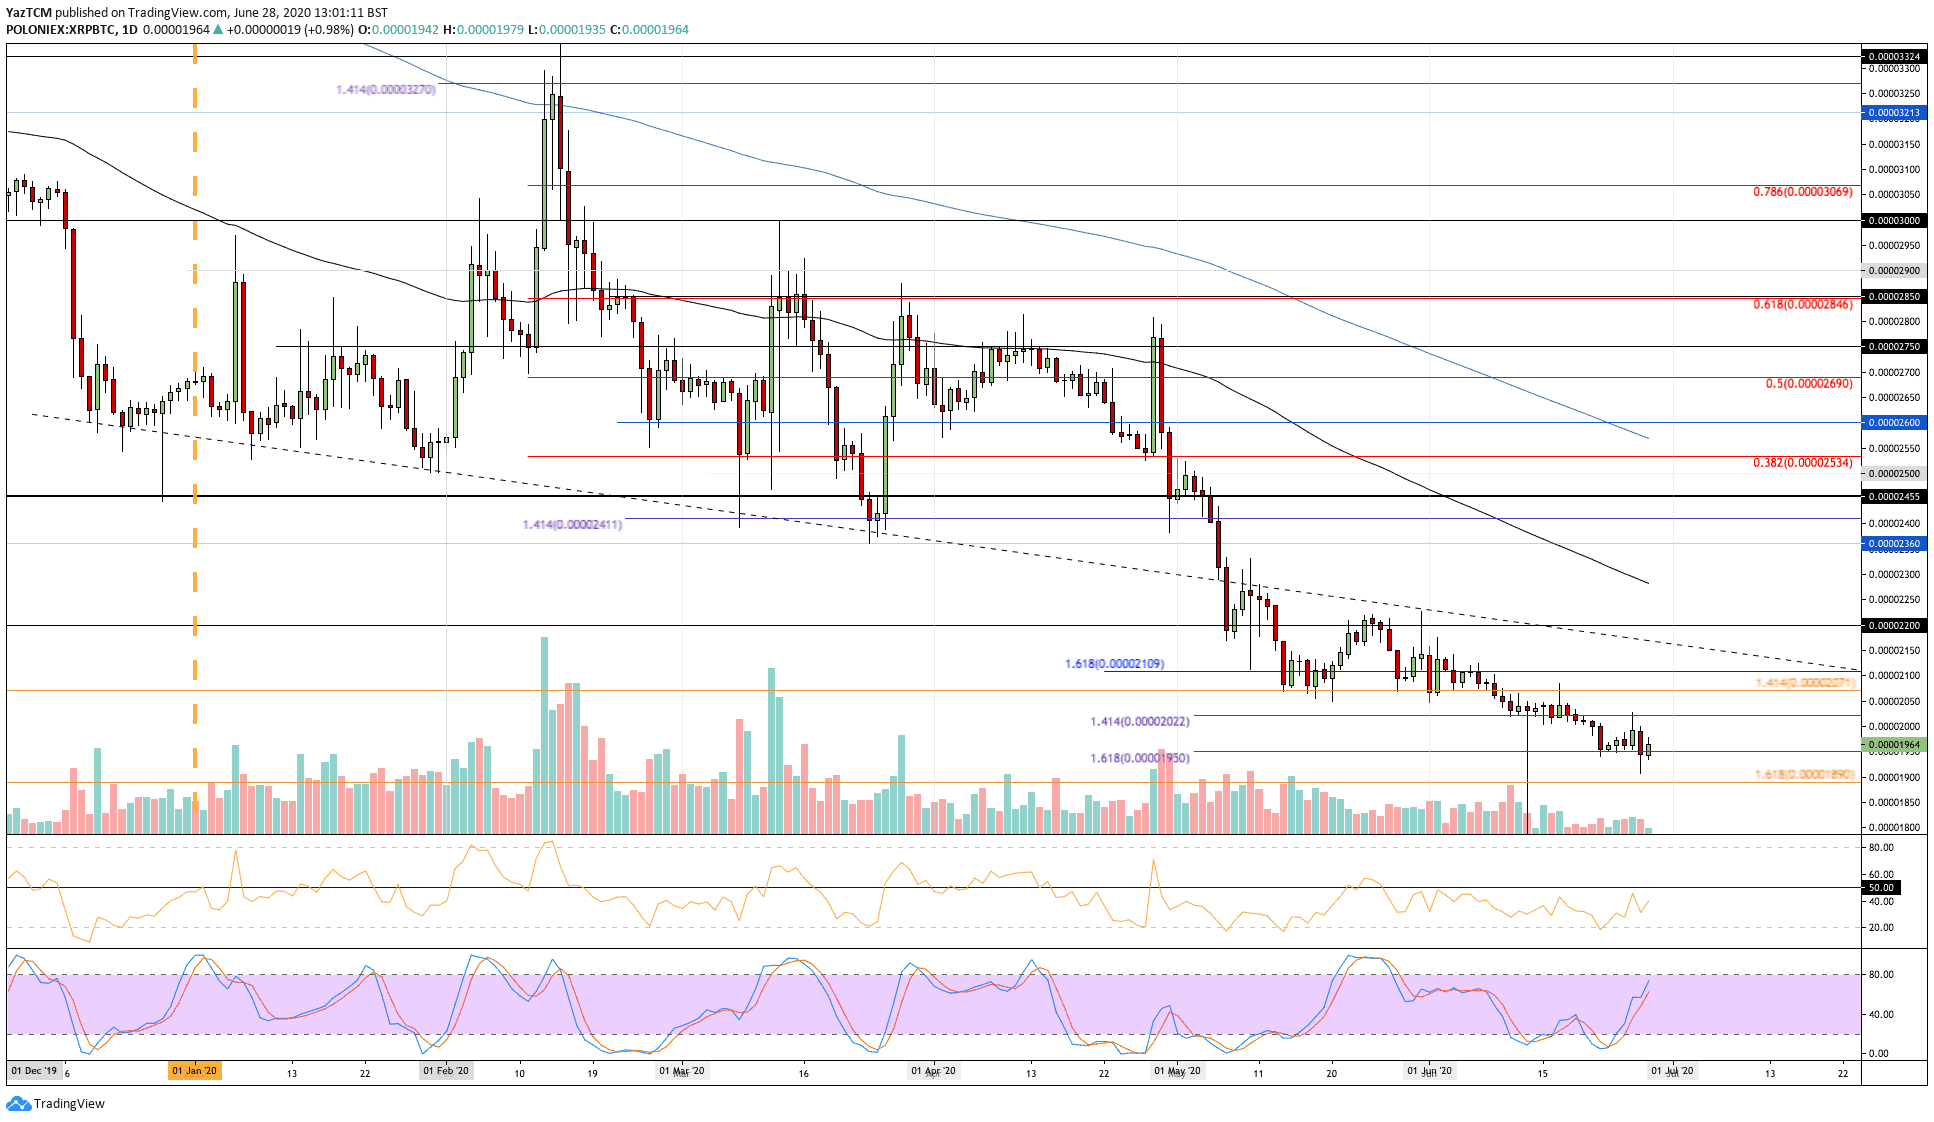
XRP-BTC Short Term Price Prediction
If the sellers do close beneath 1950 SAT, support is found at 1910 SAT, 1900 SAT, and 1890 SAT.
Alternatively, if the buyers push higher, resistance is expected at 2000 SAT, 2070 SAT, and 2100 SAT.
The RSI is rising, which is a promising sign for the buyers as it signals the selling momentum is fading. If the RSI can climb above the 50 line, XRP should be expected to start a recovery toward 3000 SAT.