Bitcoin’s price shows some worrying signs suggesting that a deeper correction is bound to occur, as the price has failed to hold the 0K level. Technical Analysis By Edris Derakhshi (TradingRage) The Daily Chart On the daily chart, the price has been gradually rising over the last few weeks, creating a new record high above the 0K mark. However, in the past few days, the market has failed to continue its bullish momentum, falling below 0K and even dropping to as low as ,000. If the market fails to reclaim this area soon, a deeper correction toward the K level and even the K support zone could be expected in the short term. Source: TradingViewThe 4-Hour Chart Looking at the 4-hour timeframe, the price action looks a bit more tricky to anticipate. The market
Topics:
CryptoVizArt considers the following as important: Bitcoin (BTC) Price, BTC Analysis, BTCEUR, BTCGBP, btcusd, btcusdt
This could be interesting, too:
Chayanika Deka writes XRP, SOL, and ADA Inclusion in US Crypto Reserve Pushes Traders on Edge
Chayanika Deka writes Why Arthur Hayes Is Bullish on Bitcoin Under Trump’s Economic Strategy
Mandy Williams writes Why the Bitcoin Market Is Stuck—and the Key Metric That Could Change It: CryptoQuant CEO
Wayne Jones writes Metaplanet Acquires 156 BTC, Bringing Total Holdings to 2,391
Bitcoin’s price shows some worrying signs suggesting that a deeper correction is bound to occur, as the price has failed to hold the $100K level.
Technical Analysis
By Edris Derakhshi (TradingRage)
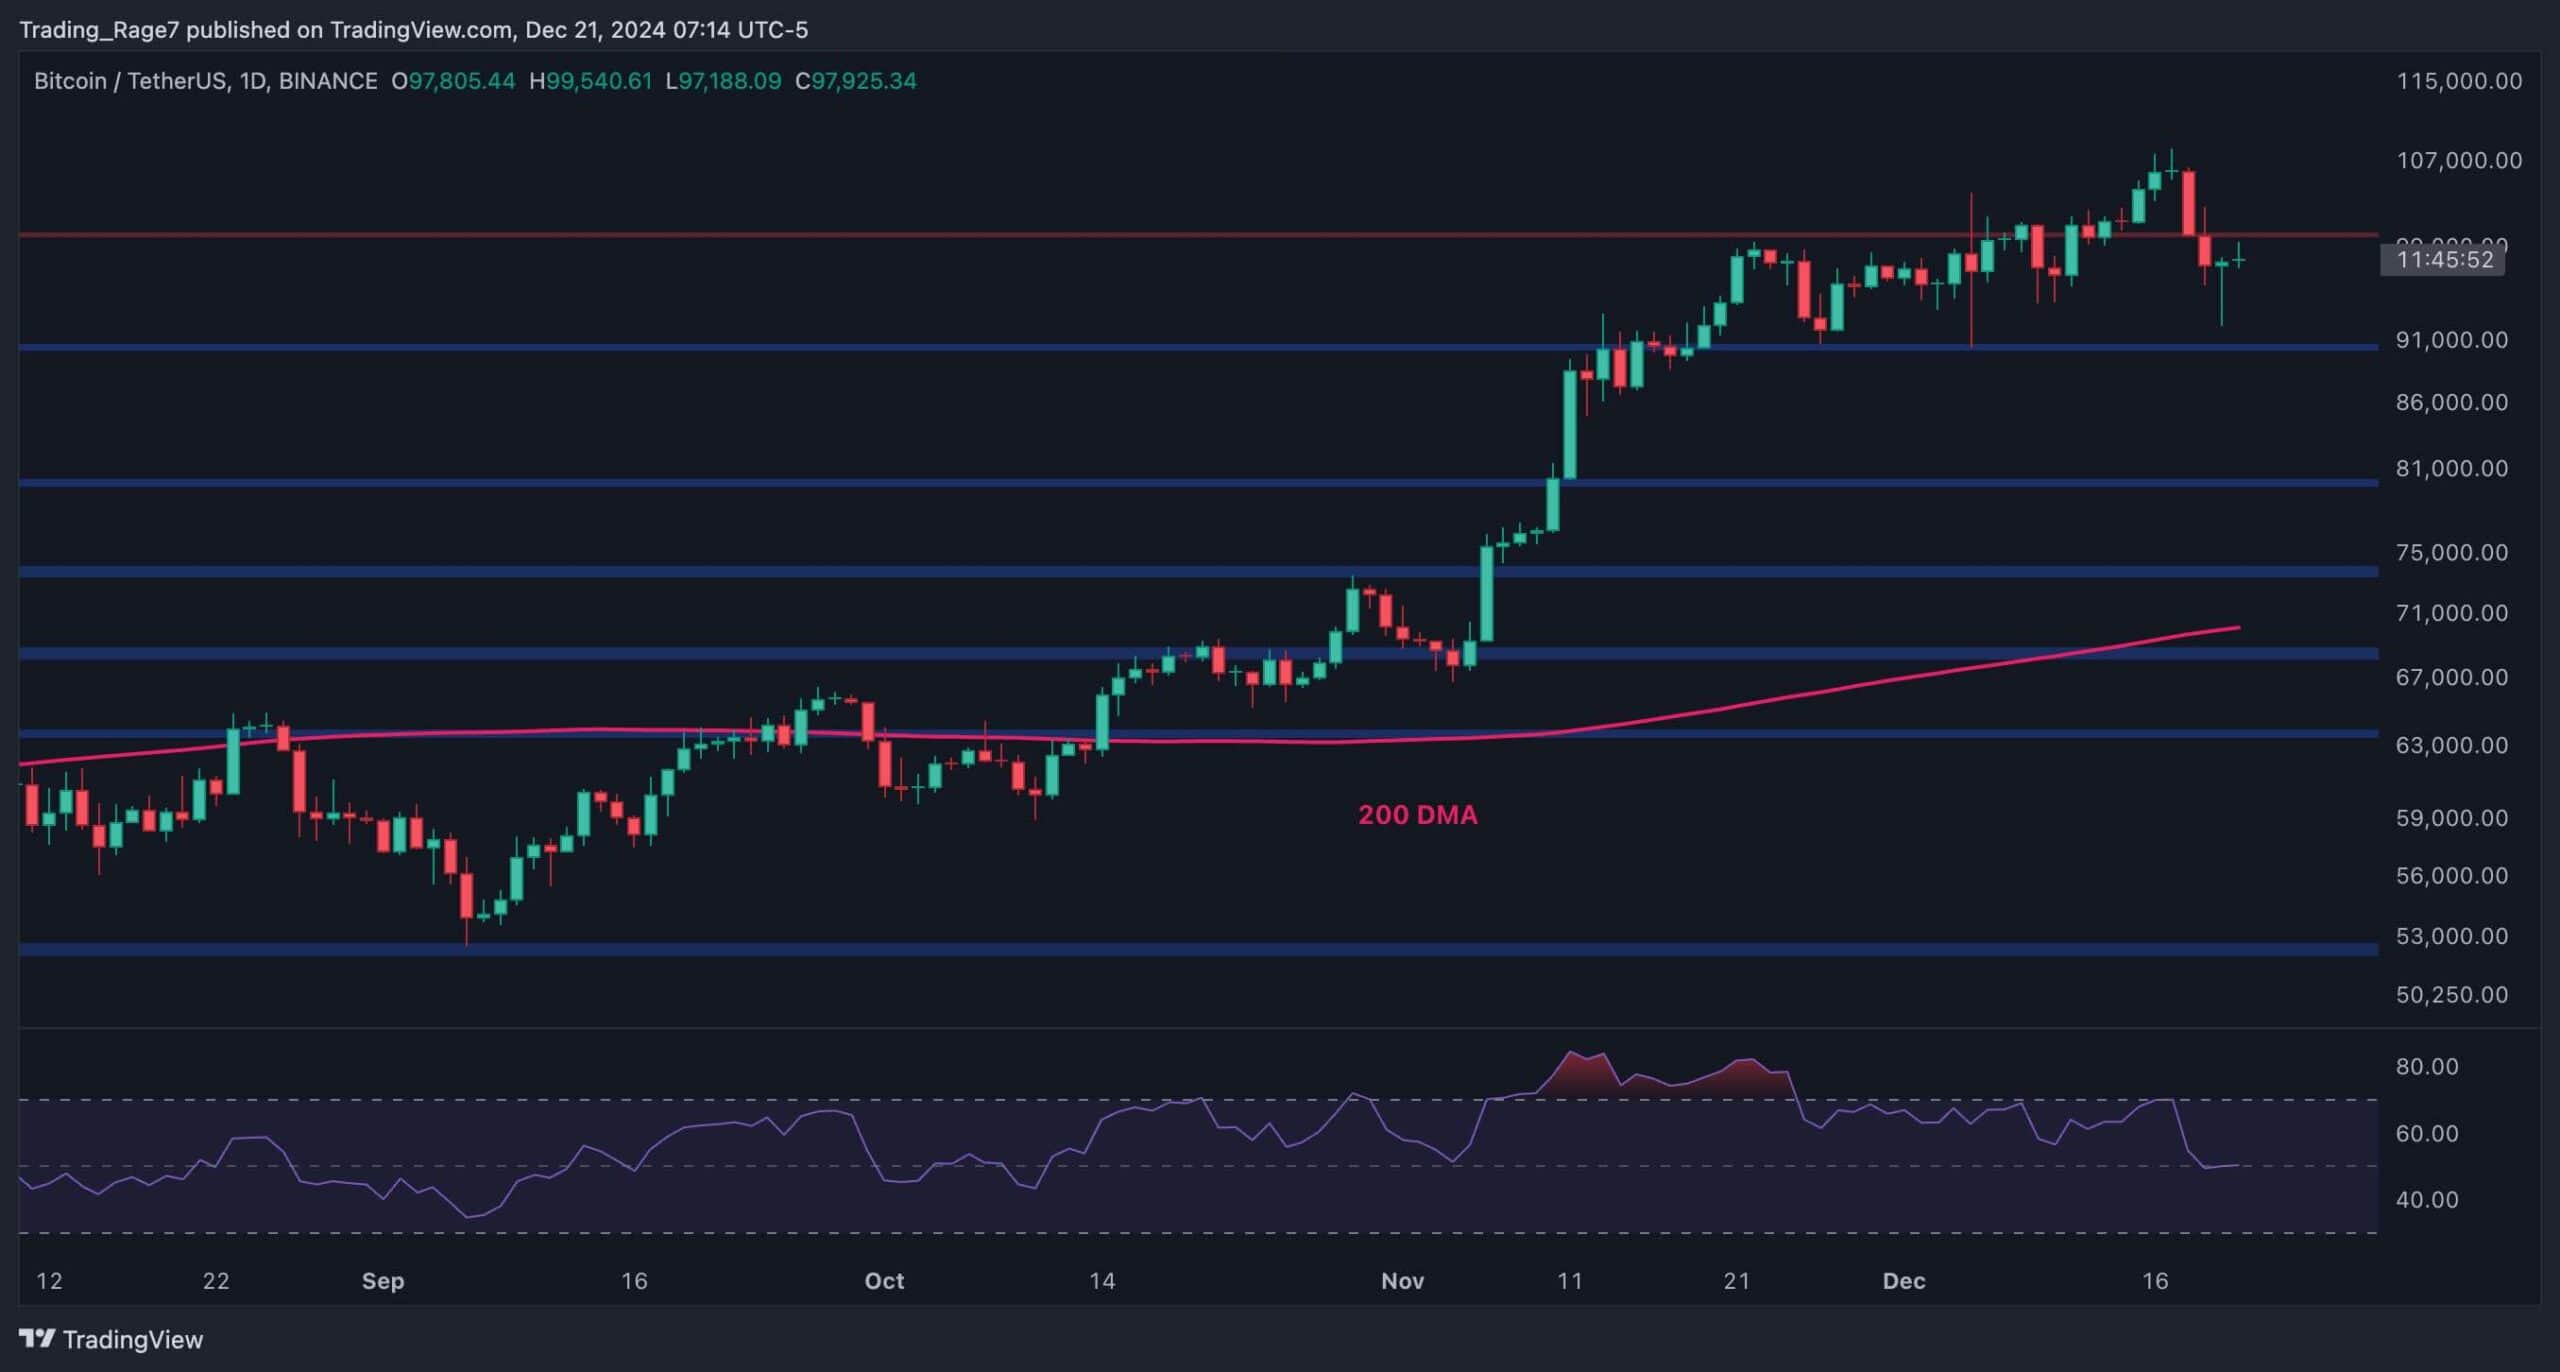
The Daily Chart
On the daily chart, the price has been gradually rising over the last few weeks, creating a new record high above the $100K mark. However, in the past few days, the market has failed to continue its bullish momentum, falling below $100K and even dropping to as low as $92,000.
If the market fails to reclaim this area soon, a deeper correction toward the $90K level and even the $80K support zone could be expected in the short term.
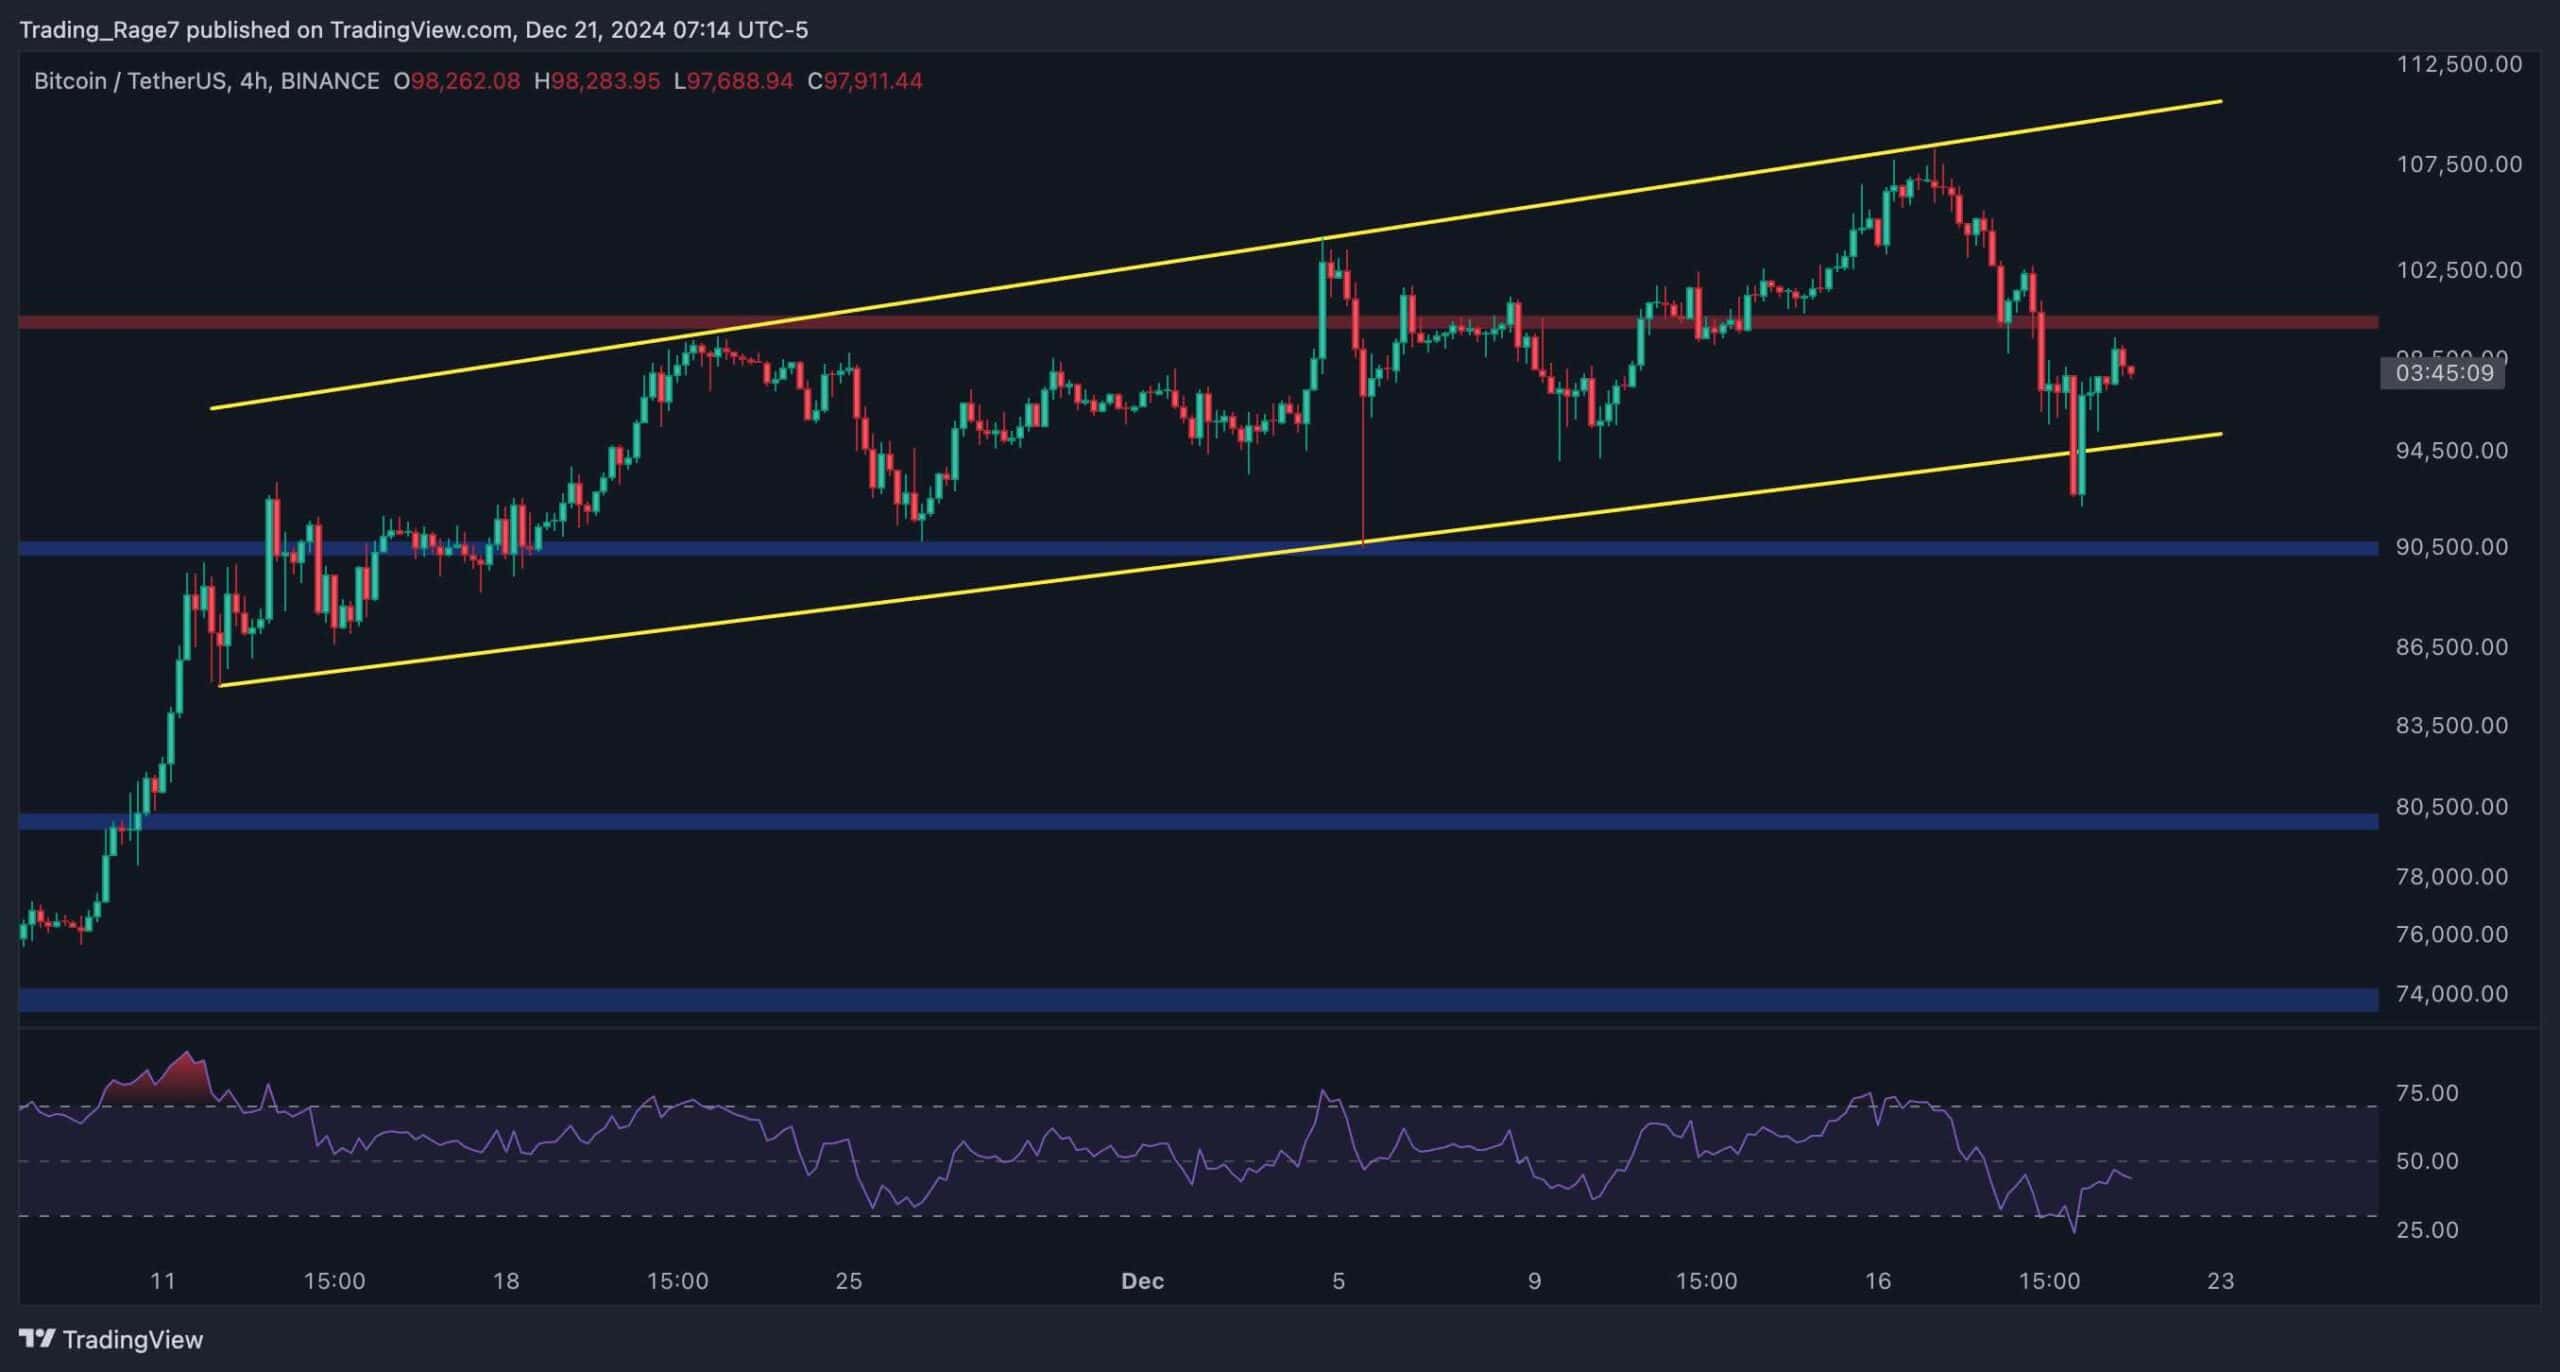
The 4-Hour Chart
Looking at the 4-hour timeframe, the price action looks a bit more tricky to anticipate. The market has been making higher highs and lows inside an ascending channel but has been rejected from the higher boundary of the channel around the $108K mark.
The $100K level has consequently been broken to the downside, and the RSI is also showing values below 50%, which indicates that market momentum has shifted to bearish.
Yet, the lower trendline still holds, which could lead to a quick recovery above the $100K level and a bullish continuation. However, if the pattern is broken to the downside, a drop below the $90K level could be expected.
On-Chain Analysis
By Edris Derakhshi (TradingRage)
Active Addresses (100-Day MA)
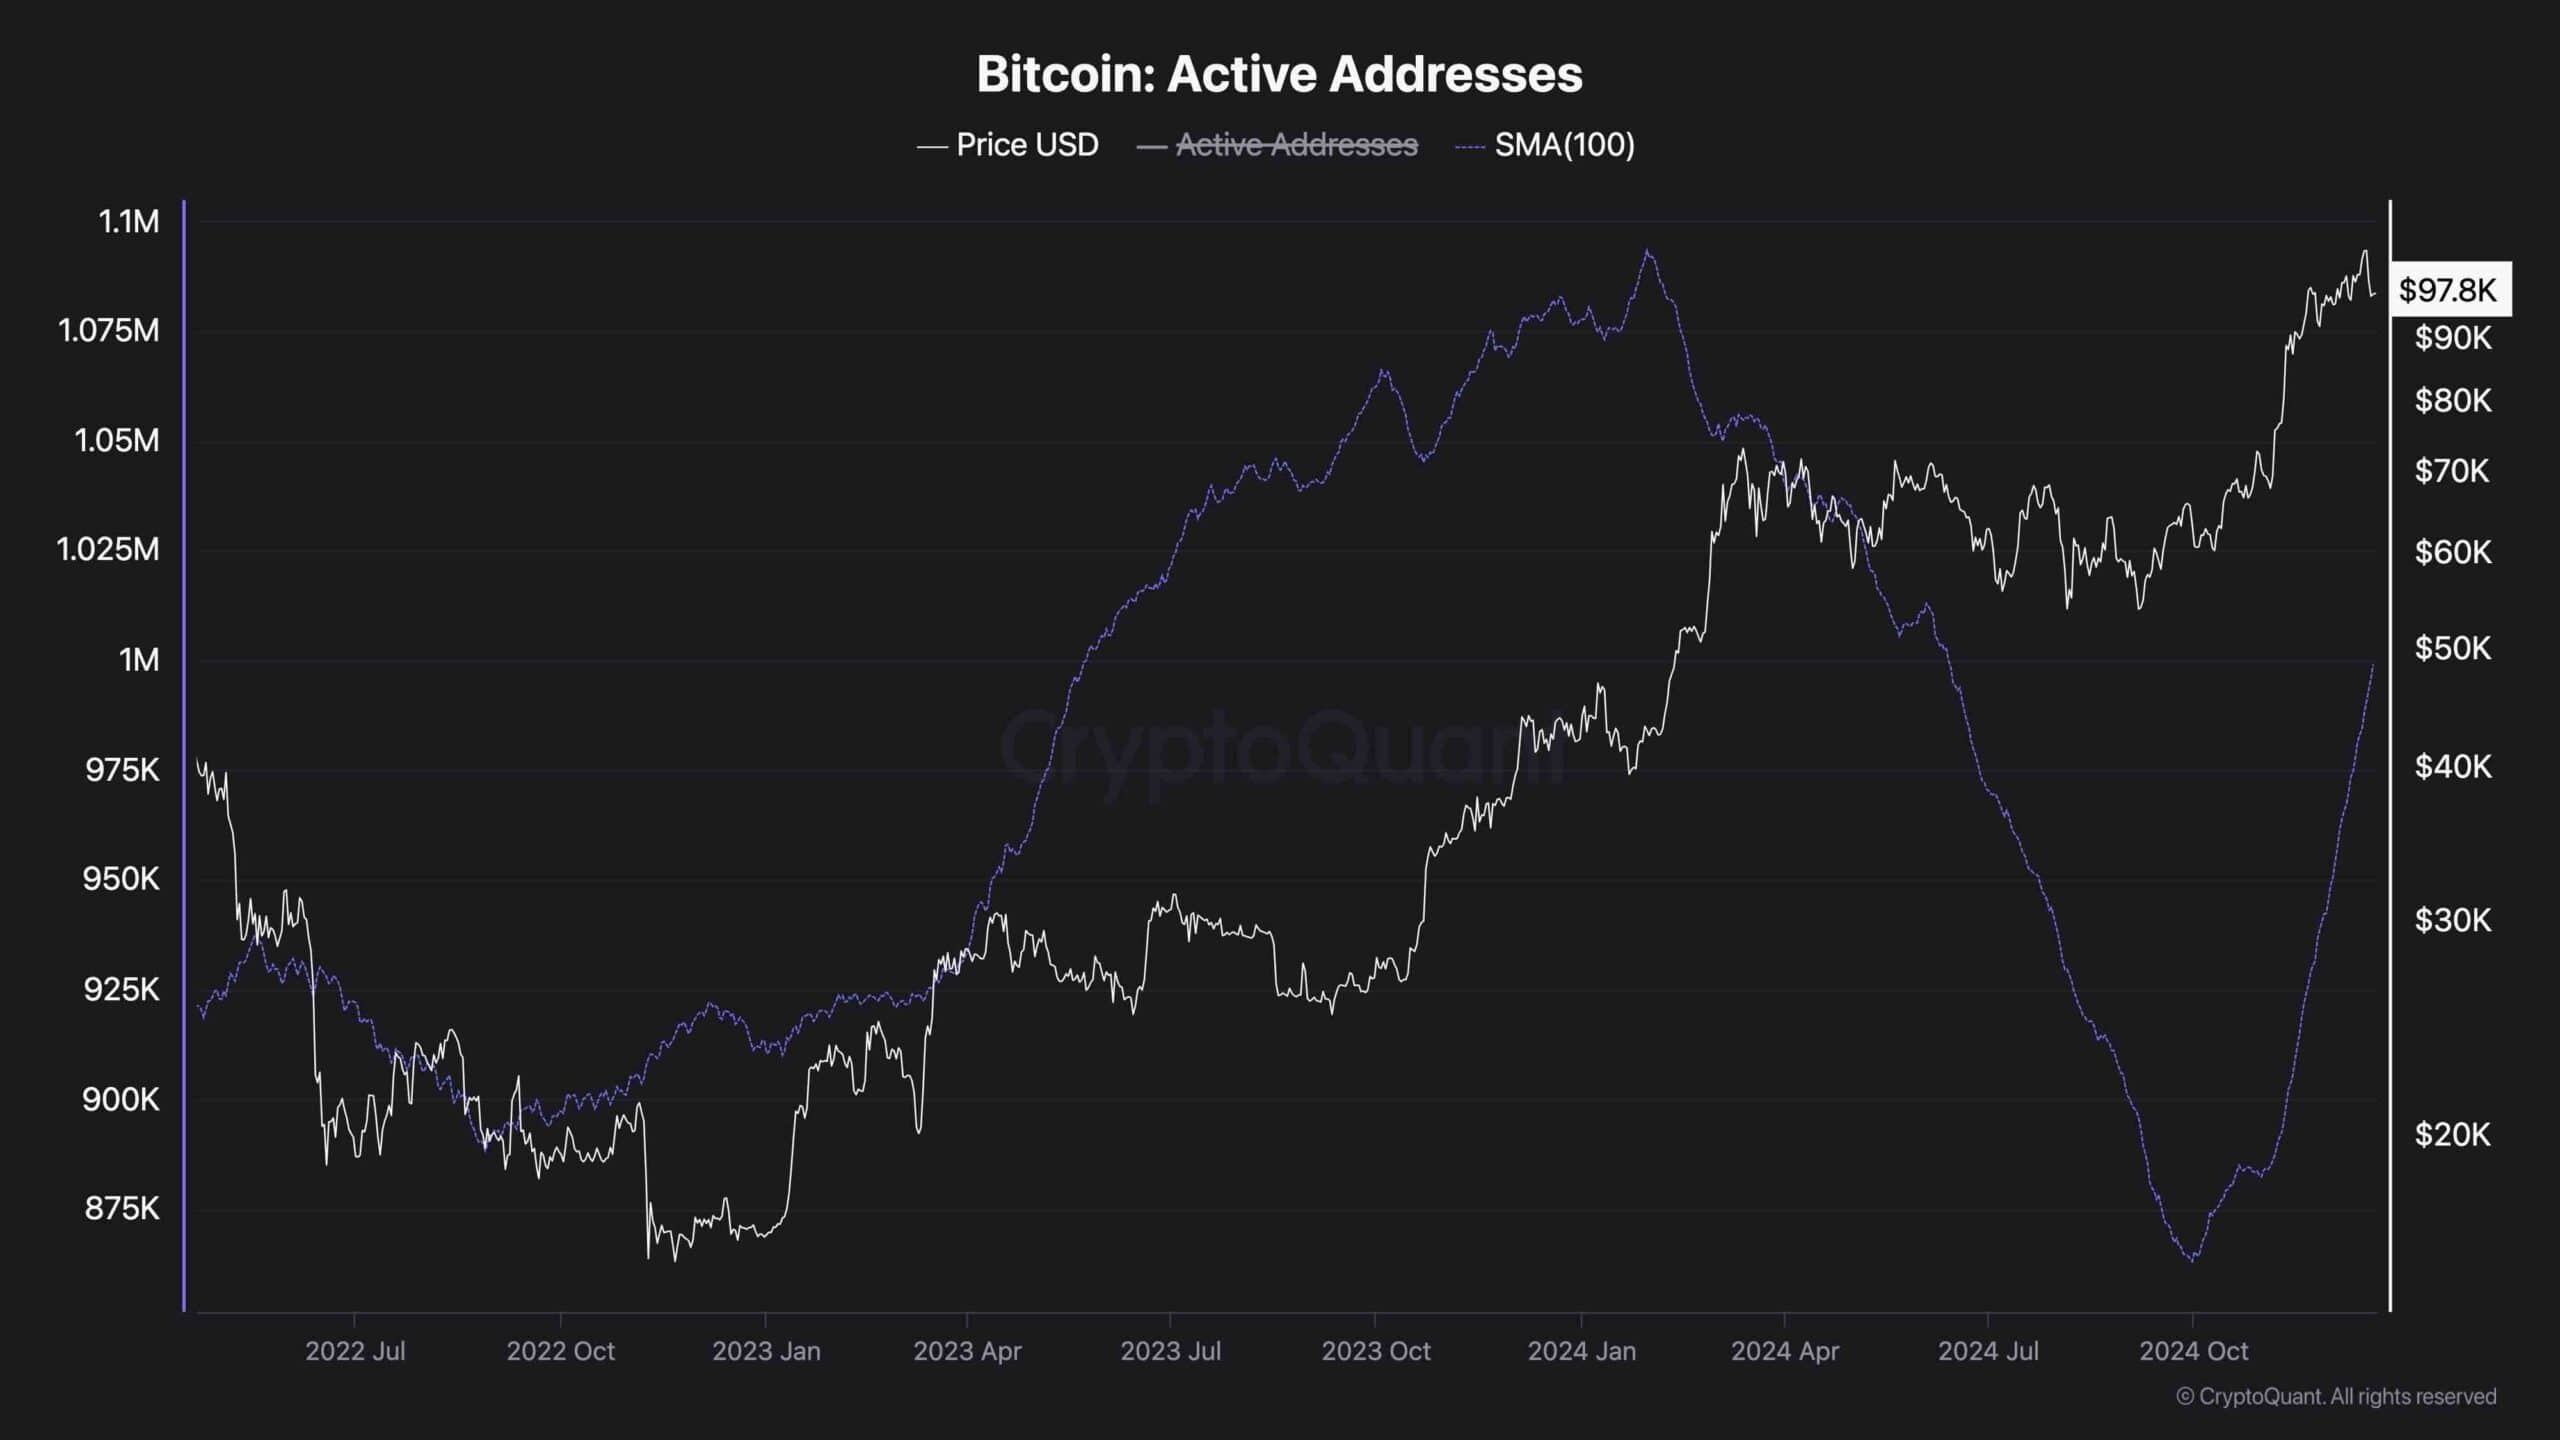
Analyzing on-chain metrics can yield valuable and interesting information about the underlying market dynamics. One of these key metrics that can offer insight beyond the price action is the active addresses metric.
Bitcoin’s network activity is one of the fundamental factors that can help in BTC valuation. The chart shows that the 100-day moving average of active addresses has been recovering rapidly during the recent uptrend and breakout above the $70K zone.
However, it is yet to reach its all-time high, which depicts a clear divergence between price action and network activity. As a result, if network activity does not make a new record high soon and starts to fall again, a lengthy correction could occur for Bitcoin.