XRP saw a 3% price increase over the past 24 hours of trading, as the cryptocurrency attempts to break %excerpt%.19. XRP penetrated beneath a rising trend line but managed to find strong support at %excerpt%.18, which allowed it to rebound. Against Bitcoin, XRP is struggling after meeting the 100-days EMA resistance to trade at 2700 SAT. Key Support & Resistance Levels XRP/USD:Support: %excerpt%.18, %excerpt%.171, %excerpt%.165.Resistance: %excerpt%.191, %excerpt%.2, %excerpt%.215.XRP/BTC:Support: 2680 SAT, 2650 SAT, 2600 SAT.Resistance: 2710 SAT, 2750 SAT, 2800 SAT. XRP/USD: Bulls Defend %excerpt%.18 And Allow XRP Rebound Since breaking beneath the previous rising trend line, XRP continued to edge lower until finding the support at the %excerpt%.18 level, provided by a short term .236 Fib Retracement. The cryptocurrency has rebounded from here as it
Topics:
Yaz Sheikh considers the following as important: Ripple (XRP) Price, XRP Analysis, xrpbtc, xrpusd
This could be interesting, too:
Dimitar Dzhondzhorov writes Is a Major Ripple v. SEC Lawsuit Development Expected This Week? Here’s Why
Mandy Williams writes Ripple Releases Institutional DeFi Roadmap for XRP Ledger in 2025
Dimitar Dzhondzhorov writes Ripple Whales Go on a Selling Spree: Is XRP Headed for a Further Correction?
Jordan Lyanchev writes ChatGPT and DeepSeek Analyze Ripple’s (XRP) Price Potential for 2025
- XRP saw a 3% price increase over the past 24 hours of trading, as the cryptocurrency attempts to break $0.19.
- XRP penetrated beneath a rising trend line but managed to find strong support at $0.18, which allowed it to rebound.
- Against Bitcoin, XRP is struggling after meeting the 100-days EMA resistance to trade at 2700 SAT.
Key Support & Resistance Levels
XRP/USD:
Support: $0.18, $0.171, $0.165.
Resistance: $0.191, $0.2, $0.215.
XRP/BTC:
Support: 2680 SAT, 2650 SAT, 2600 SAT.
Resistance: 2710 SAT, 2750 SAT, 2800 SAT.
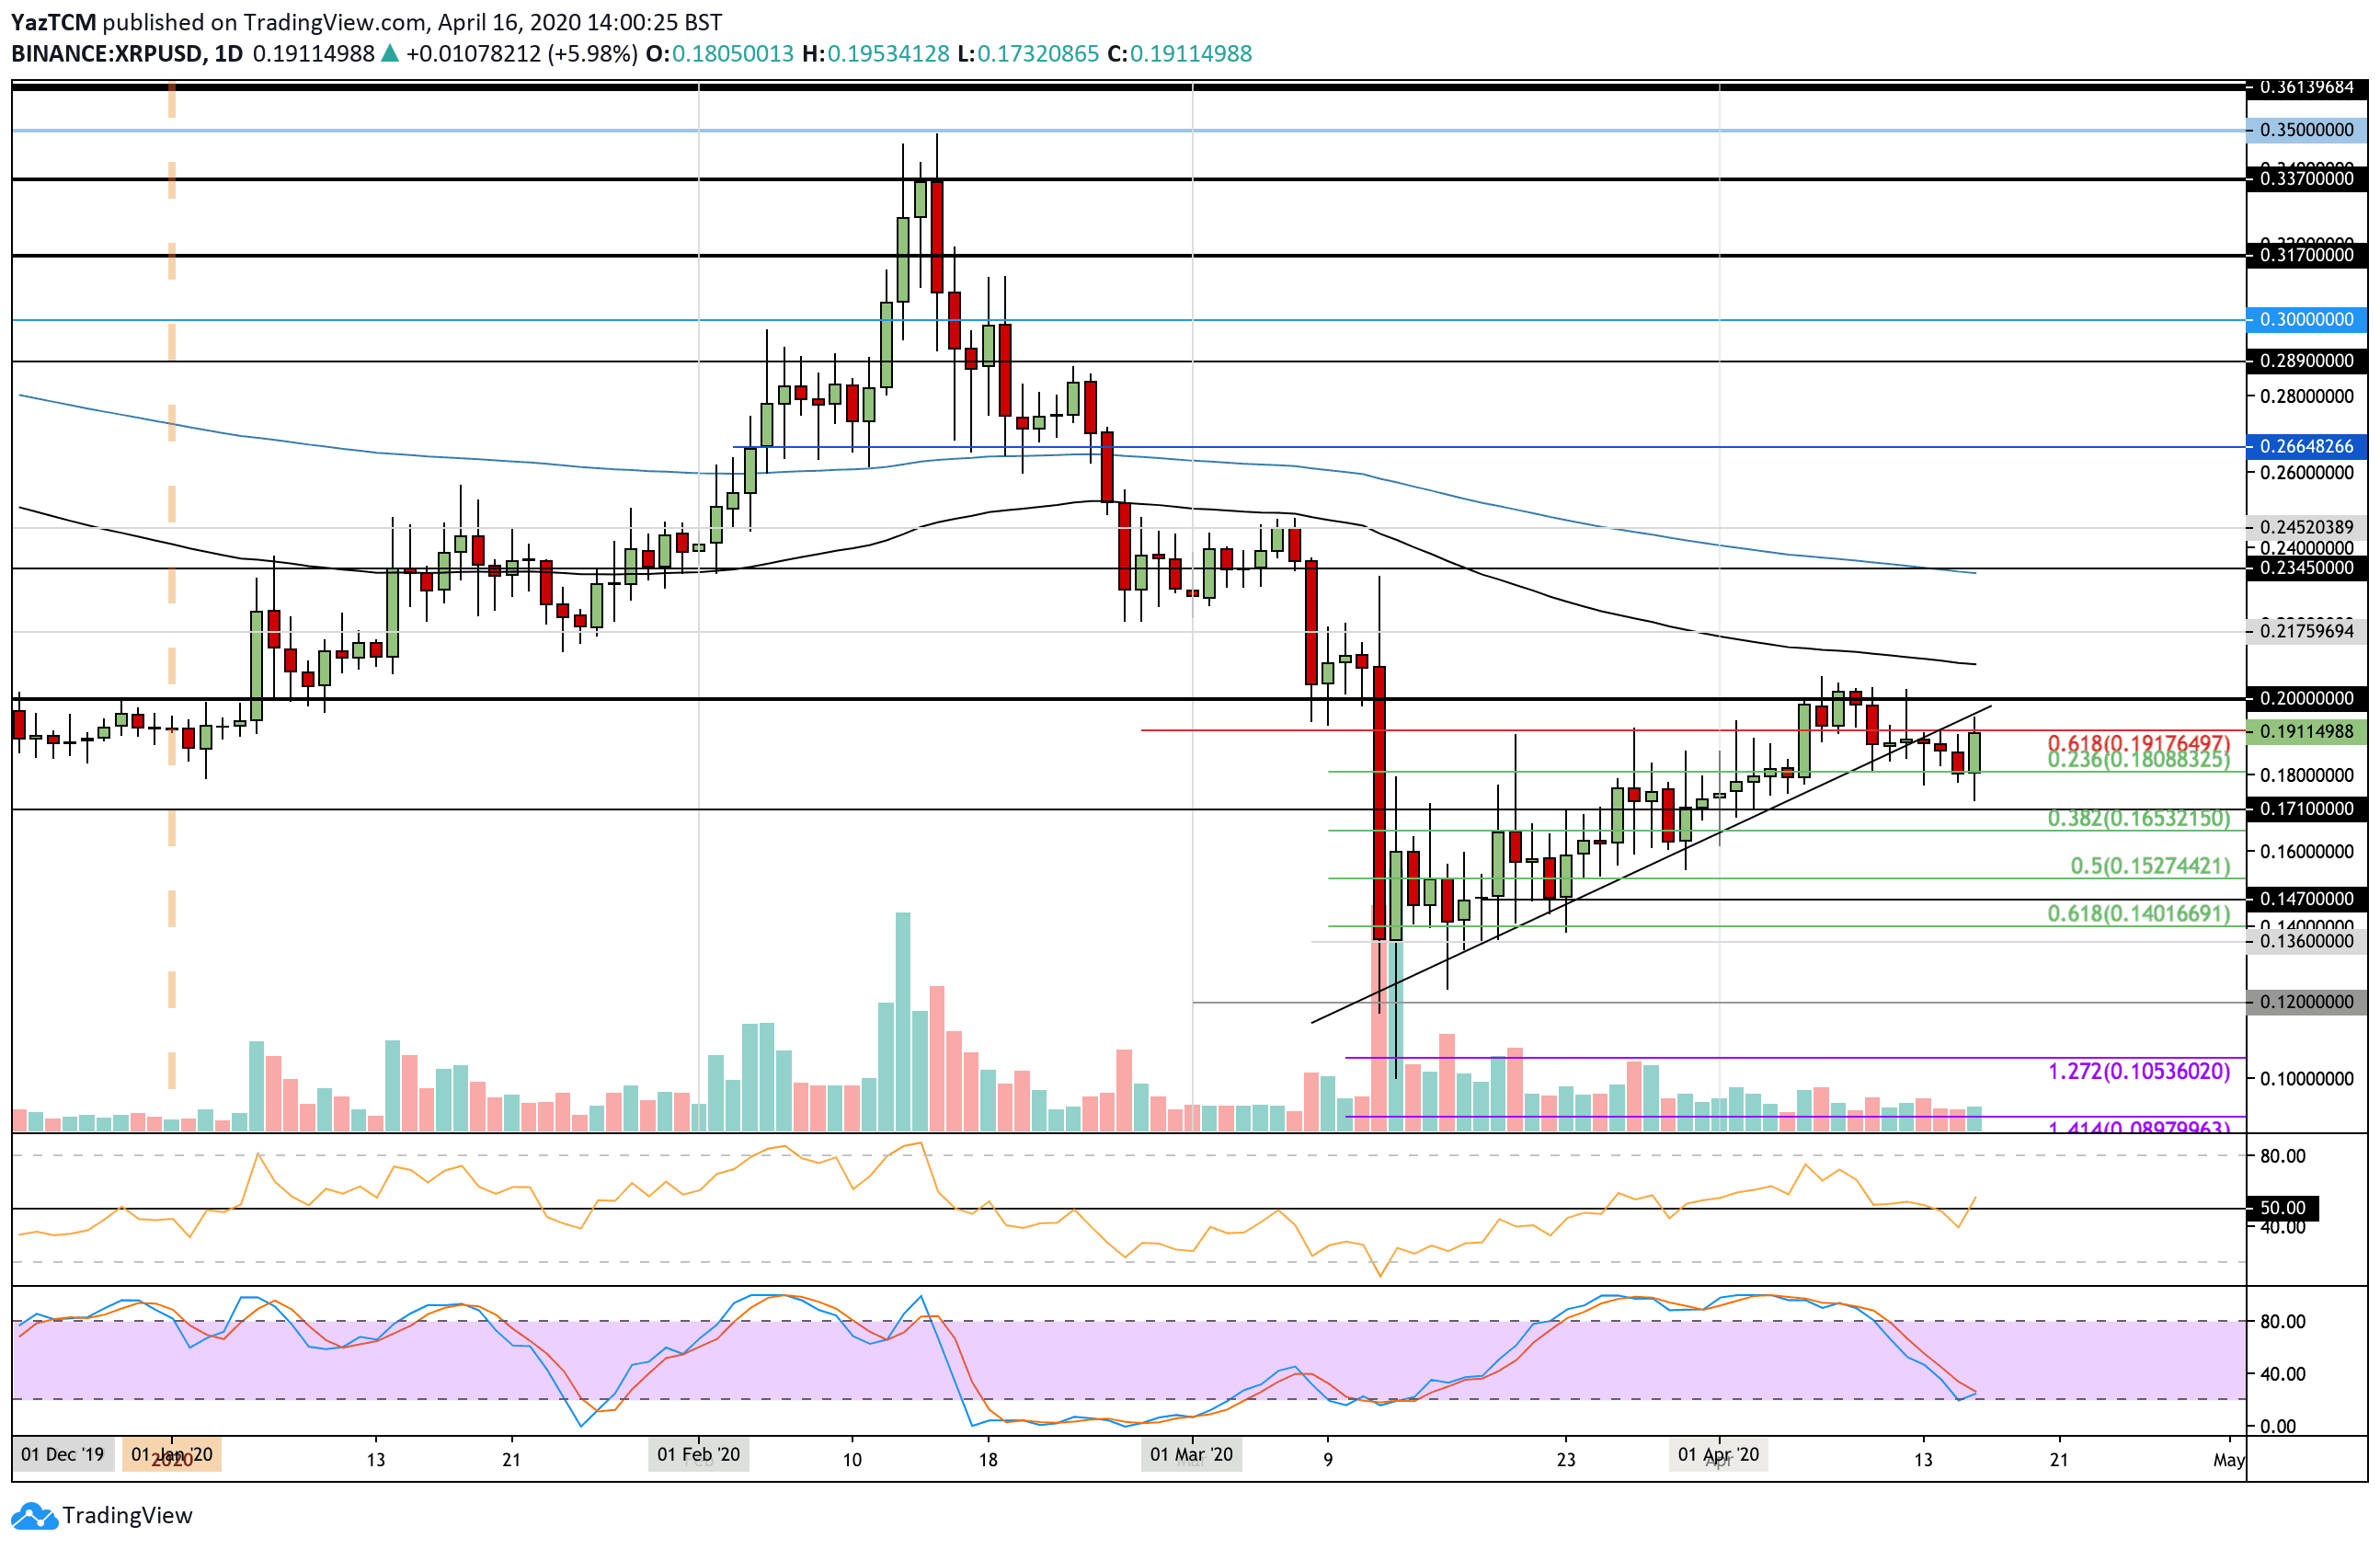
XRP/USD: Bulls Defend $0.18 And Allow XRP Rebound
Since breaking beneath the previous rising trend line, XRP continued to edge lower until finding the support at the $0.18 level, provided by a short term .236 Fib Retracement.
The cryptocurrency has rebounded from here as it battles the res resistance at $0.191 (bearish .618 Fib Retracement). This price increase is largely driven by the fact that Bitcoin managed to climb back above $7,000 today with a 4.2% price increase.
XRP/USD Short Term Price Prediction
If the bulls manage to break $0.191, the first level of resistance lies at $0.20. Above this, resistance is expected at $0.21 (100-days EMA), $0.217, and $0.234 (200-days EMA).
On the other hand, the first level of strong support lies at $0.18. Beneath this, support is located at $0.171, $0.165 (.382 Fib Retracement), $0.16, and $0.157 (.5 Fib Retracement).
The RSI recently climbed back above the 50 level, which indicates the buyers have taken control of the market momentum. Additionally, the Stochastic RSI is primed for a bullish crossover signal, which should help XRP climb back above $0.20.
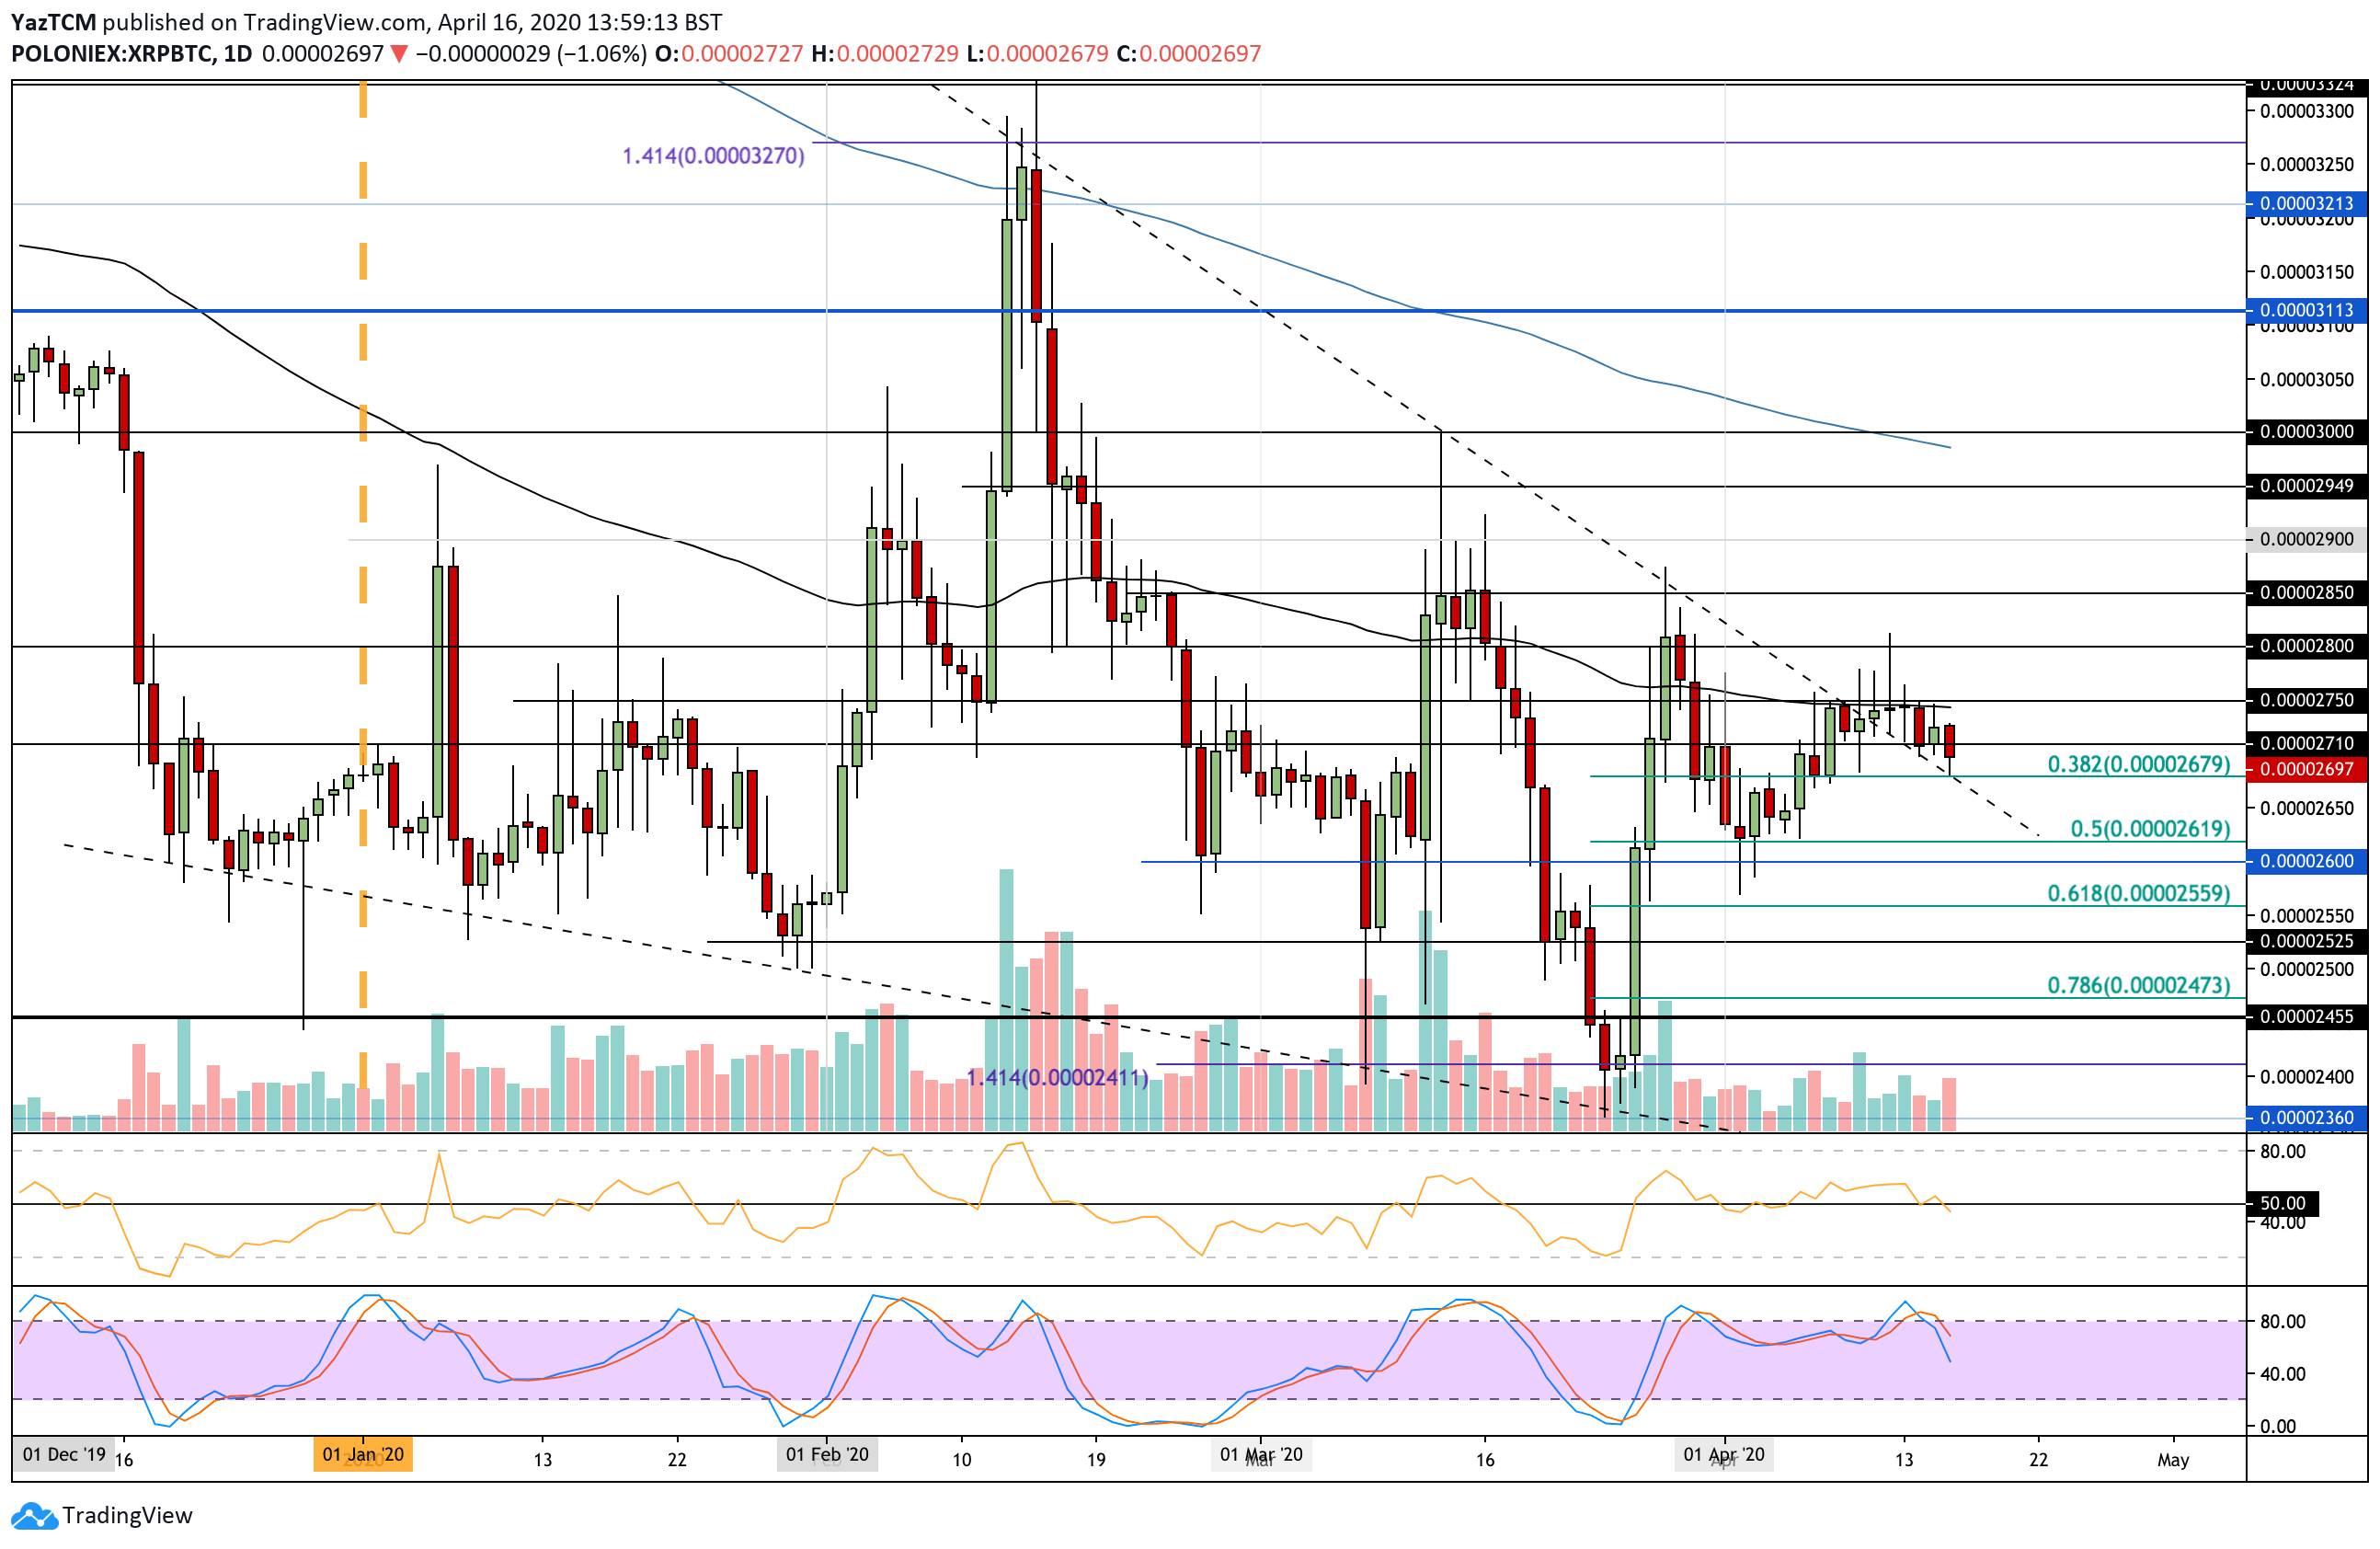
XRP/BTC: Ripple Drops Beneath 2700 SAT
Against Bitcoin, XRP has been struggling since failing to break the 100-days EMA at 2750 SAT. It briefly found support at 2710 SAT but since dropped beneath here today.
The cryptocurrency went on to find added support at 2680 SAT, which is provided by a .382 Fib Retracement level.
XRP/BTC Short Term Price Prediction
If the sellers continue beneath 2680 SAT, added support lies at 2650 SAT, 2620 SAT (.5 Fib Retracement), and 2600 SAT. Beneath this, extra support is located at 2560 SAT (.618 Fib Retracement).
Alternatively, if the bulls rebound at 2680 SAT, resistance lies at 2710 SAT, 2750 SAT (100-days EMA), and 2800 SAT.
The RSI recently dipped beneath the 50 line, which is signal that the sellers have taken control o the market momentum. If it continues to decline, XRP can be expected to drop toward 2650 SAT. Similarly, the Stochastic RSI produced a bearish crossover signal in overbought territory, which is a signal that the selling pressure is increasing.