XRP saw a 2.7% price increase today as it attempts to reclaim %excerpt%.2.The cryptocurrency remains within the confines of a descending triangle formation.Against Bitcoin, XRP rebounded from the support at 2022 SAT to reach the current 2074 SAT level.Key Support & Resistance LevelsXRP/USD:Support: %excerpt%.192, %excerpt%.187, %excerpt%.18.Resistance: %excerpt%.20, %excerpt%.207, %excerpt%.22XRP/BTC:Support: 2022 SAT, 2000 SAT, 1950 SAT.Resistance: 2100 SAT, 2200 SAT, 2360 SAT.XRP/USD: XRP Triangle Re-EmergesXRP can still be considered to be trading within a period of consolidation with the floor of the triangle at %excerpt%.187 instead of %excerpt%.192. The coin has been trading within this triangle since the start of May 2020 and must breakout from it to dictate the next move.During the week, it did look like XRP had broken beneath this triangle.
Topics:
Yaz Sheikh considers the following as important: Ripple (XRP) Price, XRP Analysis, xrpbtc, xrpusd
This could be interesting, too:
Dimitar Dzhondzhorov writes Is a Major Ripple v. SEC Lawsuit Development Expected This Week? Here’s Why
Mandy Williams writes Ripple Releases Institutional DeFi Roadmap for XRP Ledger in 2025
Dimitar Dzhondzhorov writes Ripple Whales Go on a Selling Spree: Is XRP Headed for a Further Correction?
Jordan Lyanchev writes ChatGPT and DeepSeek Analyze Ripple’s (XRP) Price Potential for 2025
- XRP saw a 2.7% price increase today as it attempts to reclaim $0.2.
- The cryptocurrency remains within the confines of a descending triangle formation.
- Against Bitcoin, XRP rebounded from the support at 2022 SAT to reach the current 2074 SAT level.
Key Support & Resistance Levels
XRP/USD:
Support: $0.192, $0.187, $0.18.
Resistance: $0.20, $0.207, $0.22
XRP/BTC:
Support: 2022 SAT, 2000 SAT, 1950 SAT.
Resistance: 2100 SAT, 2200 SAT, 2360 SAT.
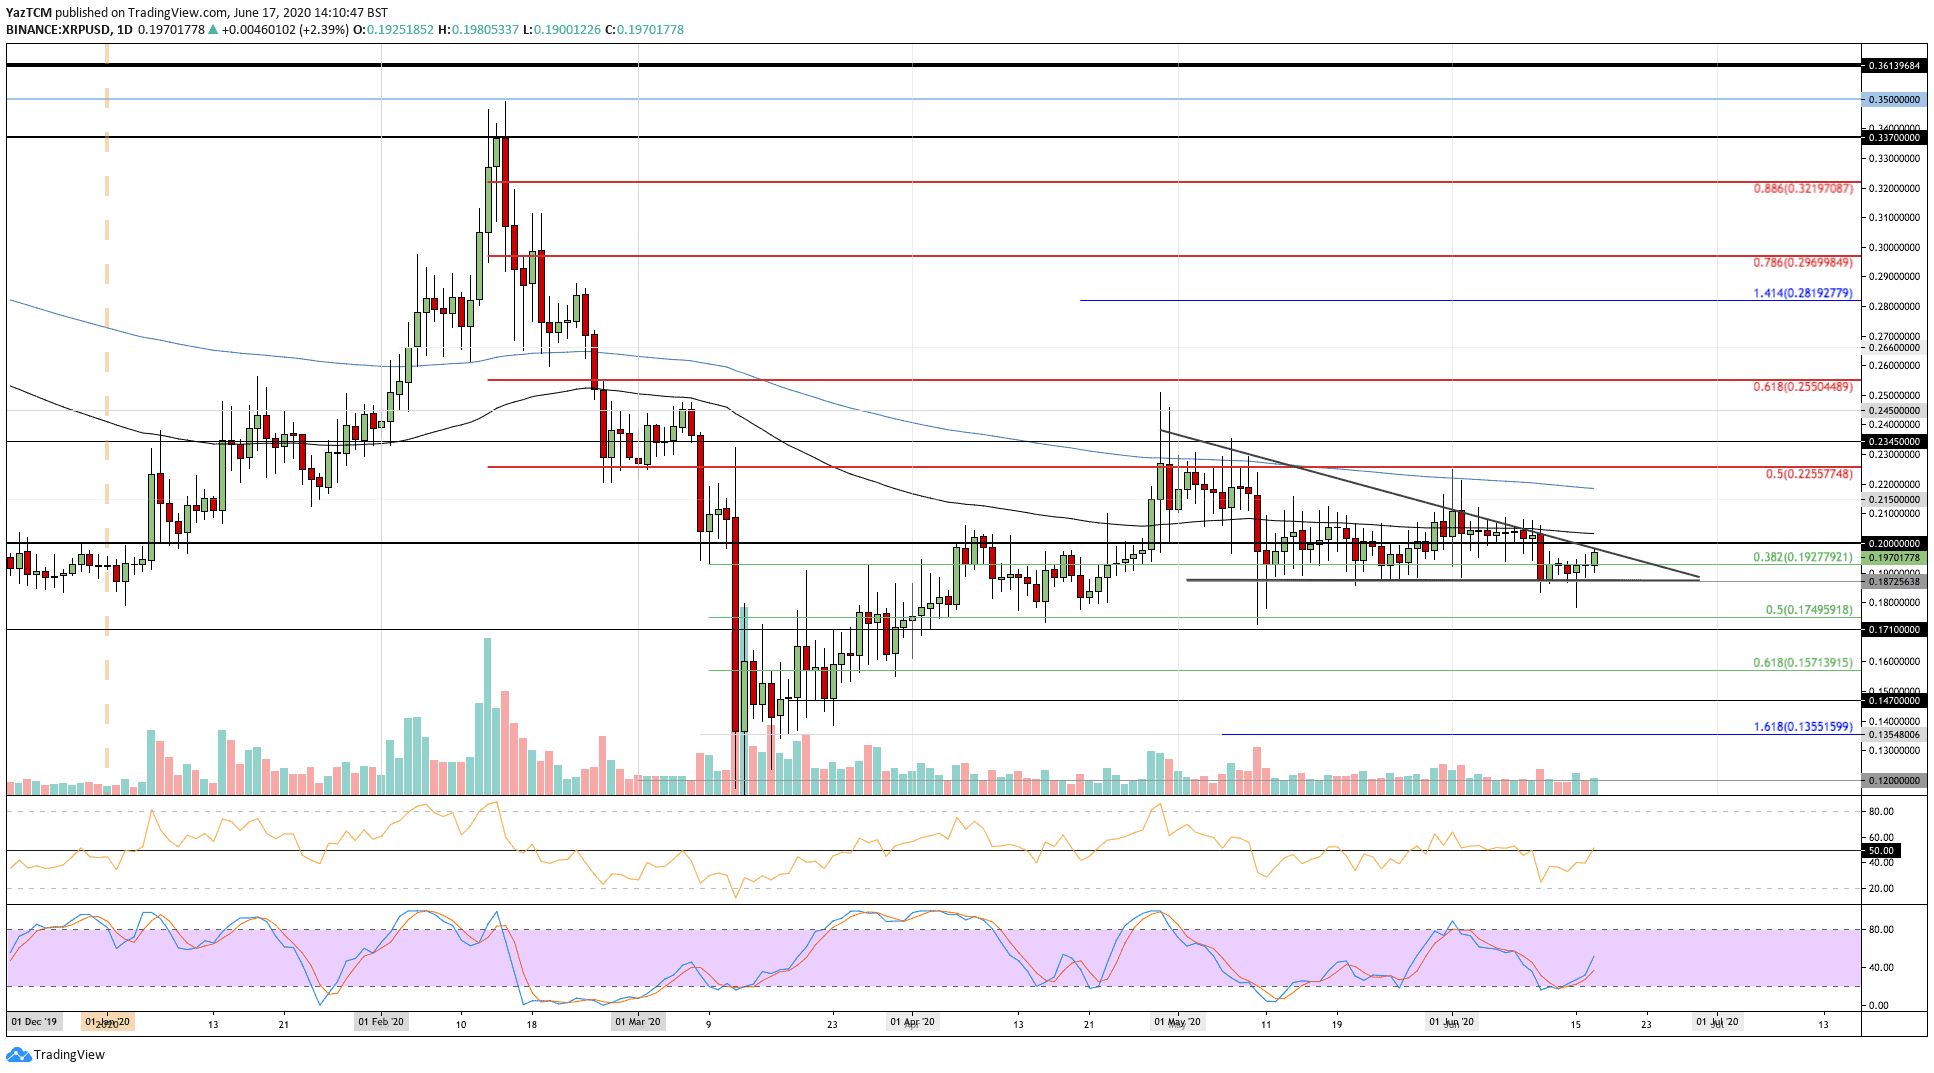
XRP/USD: XRP Triangle Re-Emerges
XRP can still be considered to be trading within a period of consolidation with the floor of the triangle at $0.187 instead of $0.192. The coin has been trading within this triangle since the start of May 2020 and must breakout from it to dictate the next move.
During the week, it did look like XRP had broken beneath this triangle. However, moving the base of the pattern has allowed it to remain inside it, but a break below $0.187 would undoubtedly spell disaster for XRP.
XRP-USD Short Term Price Prediction
Looking ahead, if the sellers push lower, the first two levels of support lie at $0.192 (.382 Fib Retracement) and $0.187 (Triangle floor). Added support lies at $0.18 and $0.175 (.5 Fib Retracement).
Alternatively, if the buyers can break above the upper boundary of the triangle, resistance lies at $0.20, $0.207 (100-day EMA), and $0.22 (200-day EMA).
The RSI recently pushed back above 50 to indicate increasing bullish momentum within the market. Furthermore, the Stochastic RSI also produced a bullish crossover signal that indicates increasing bullish pressure.
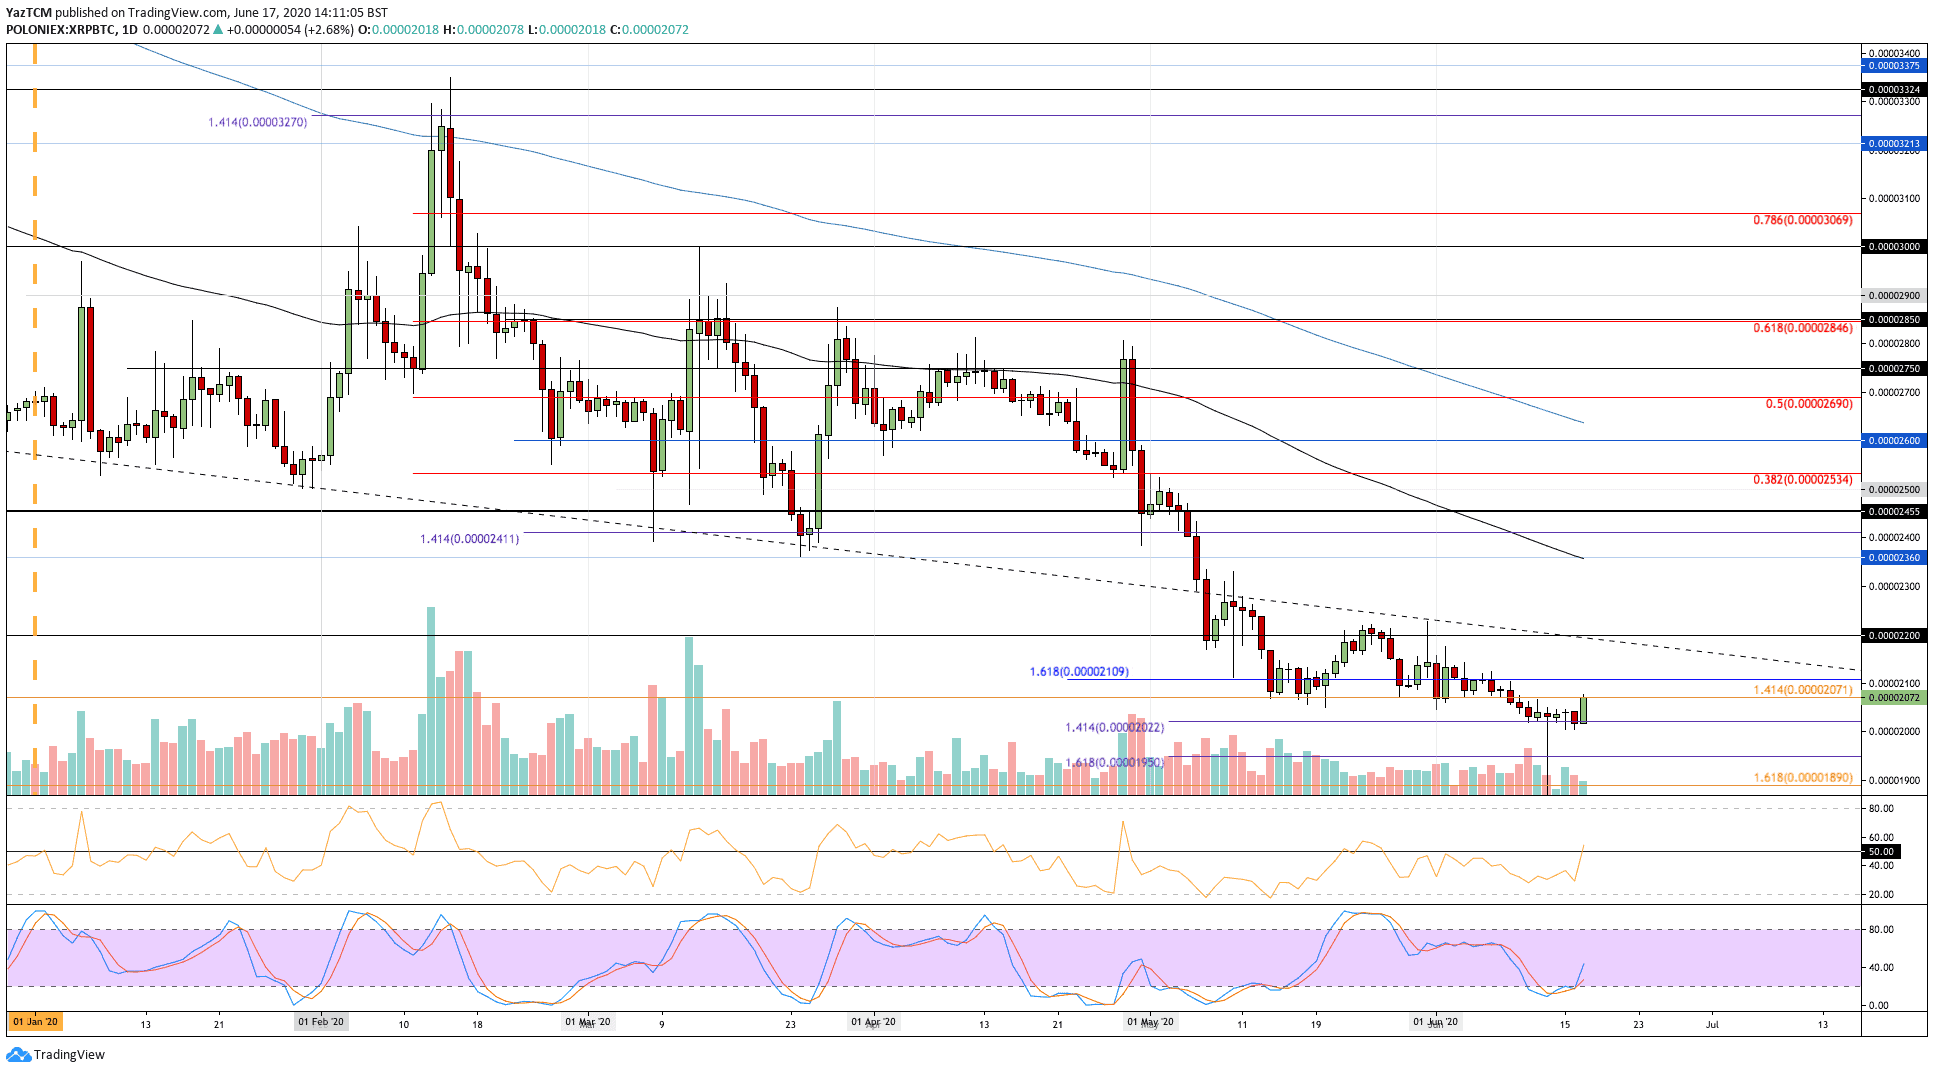
XRP/BTC: XRP Rebounds From Fresh 2-Year Lows
Against Bitcoin, XRP had suffered significantly when it slipped from 2071 SAT last week to reach as low as 2022 SAT and create a fresh multi-year low. Luckily, it managed to push higher from this support today as it climbs into the 2072 SAT level.
XRP has a long way to recover its losses against BTC in 2020. The coin would need to break above 2500 SAT before it can start to think above its recovery.
XRP-BTC Short Term Price Prediction
If the buyers continue to push XRP higher, the first level of resistance lies at 2100 SAT. Above this, resistance can be expected at 2200 SAT and 2360 SAT (100-day EMA).
Alternatively, if the sellers push lower, the first level of support lies at 2022 SAT. Beneath this, added support is found at 2000 SAT, 1950 SAT, and 1890 SAT.
The RSI has also broken above the 50 line to indicate bullish momentum present within the market.