XRP/USD – Buyers Continue To Defend October Lows Key Support Levels: %excerpt%.235, %excerpt%.228, %excerpt%.22.Key Resistance Levels: %excerpt%.245, %excerpt%.251, %excerpt%.261. XRP fell beneath the symmetrical triangle pattern at the end of October and headed toward the 100-days EMA. It found support at the 200-days EMA but fell below it yesterday. Despite this, XRP remained supported at %excerpt%.228 (.618 Fib & October lows). A break beneath this level is likely to send XRP on a downward spiral toward %excerpt%.20. On the other side, the coin would need to break resistance at %excerpt%.26 to be able to turn bullish. XRP/USD Daily Chart. Source: TradingViewXRP-USD Short Term Price Prediction Looking ahead, if the sellers head beneath %excerpt%.235, the first level of support lies at %excerpt%.228 (.618 FIb). Beneath this, support lies at
Topics:
Yaz Sheikh considers the following as important: Ripple (XRP) Price, XRP Analysis, xrpbtc, xrpusd
This could be interesting, too:
Dimitar Dzhondzhorov writes Is a Major Ripple v. SEC Lawsuit Development Expected This Week? Here’s Why
Mandy Williams writes Ripple Releases Institutional DeFi Roadmap for XRP Ledger in 2025
Dimitar Dzhondzhorov writes Ripple Whales Go on a Selling Spree: Is XRP Headed for a Further Correction?
Jordan Lyanchev writes ChatGPT and DeepSeek Analyze Ripple’s (XRP) Price Potential for 2025
XRP/USD – Buyers Continue To Defend October Lows
Key Support Levels: $0.235, $0.228, $0.22.
Key Resistance Levels: $0.245, $0.251, $0.261.
XRP fell beneath the symmetrical triangle pattern at the end of October and headed toward the 100-days EMA. It found support at the 200-days EMA but fell below it yesterday. Despite this, XRP remained supported at $0.228 (.618 Fib & October lows).
A break beneath this level is likely to send XRP on a downward spiral toward $0.20. On the other side, the coin would need to break resistance at $0.26 to be able to turn bullish.
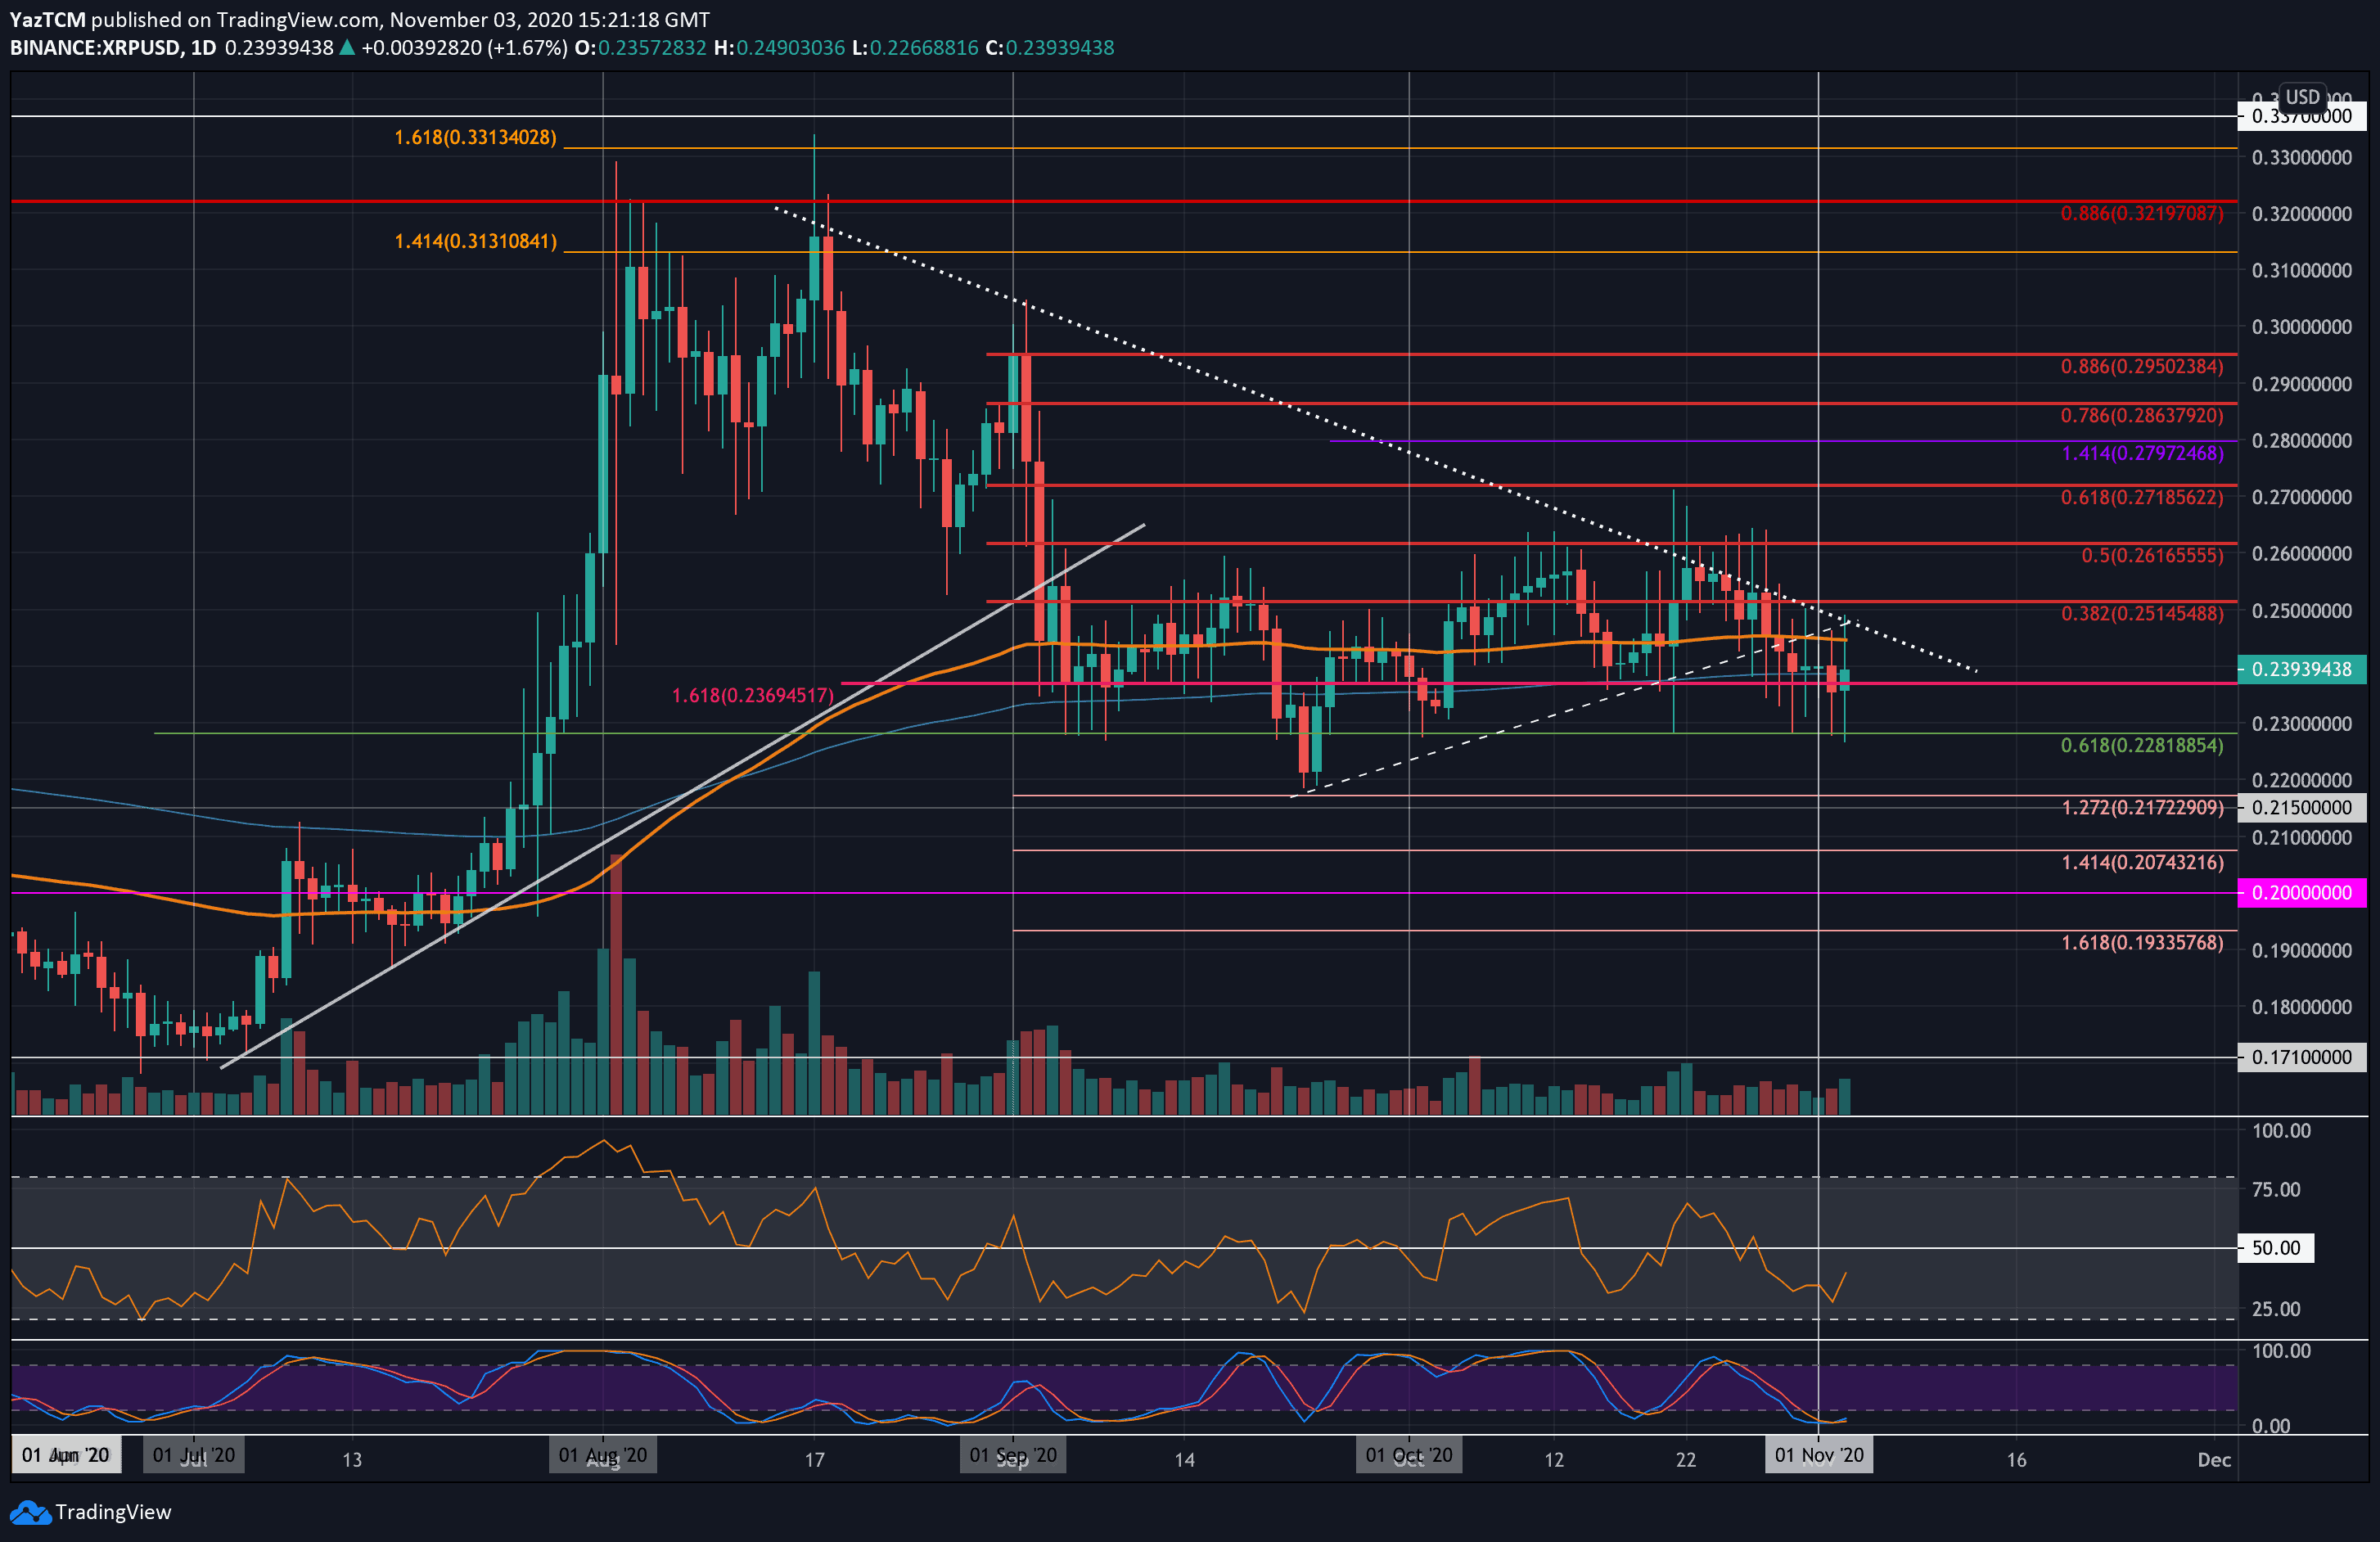
XRP-USD Short Term Price Prediction
Looking ahead, if the sellers head beneath $0.235, the first level of support lies at $0.228 (.618 FIb). Beneath this, support lies at $0.22, $0.215, and $0.21.
On the other side, if the buyers push back above the 200-days EMA, the first level of resistance lies at the 100-days EMA and the falling trend line. Following this, resistance lies at $0.251 (bearish .382 Fib) and $0.251 (bearish .5 Fib).
The Stochastic RSI is in extremely oversold territory and is primed for a bullish crossover signal that should send the market higher. Additionally, the RSI recently rebounded from near oversold territory, which suggests the bearish momentum is stalling.
XRP/BTC – Bulls Attempting To Defend 1725 SAT Support.
Key Support Levels: 1725 SAT, 1700 SAT, 1680 SAT.
Key Resistance Levels: 1800 SAT, 1865 SAT, 1900 SAT.
XRP has been struggling heavily against Bitcoin. The coin fell by a total of 28% in October as it dropped from a high at 2400 SAT to reach as low as 1725 SAT (downside 1.618 Fib Extension). The bulls have managed to defend this support over the past four days, but the downward momentum is quite extreme.
If XRP could break back above 1900 SAT (July 20’ lows), this would be a promising signal for any bulls in the market. On the other hand, if it was to close a daily candle beneath 1725 SAT then XRP is likely to suffer further.
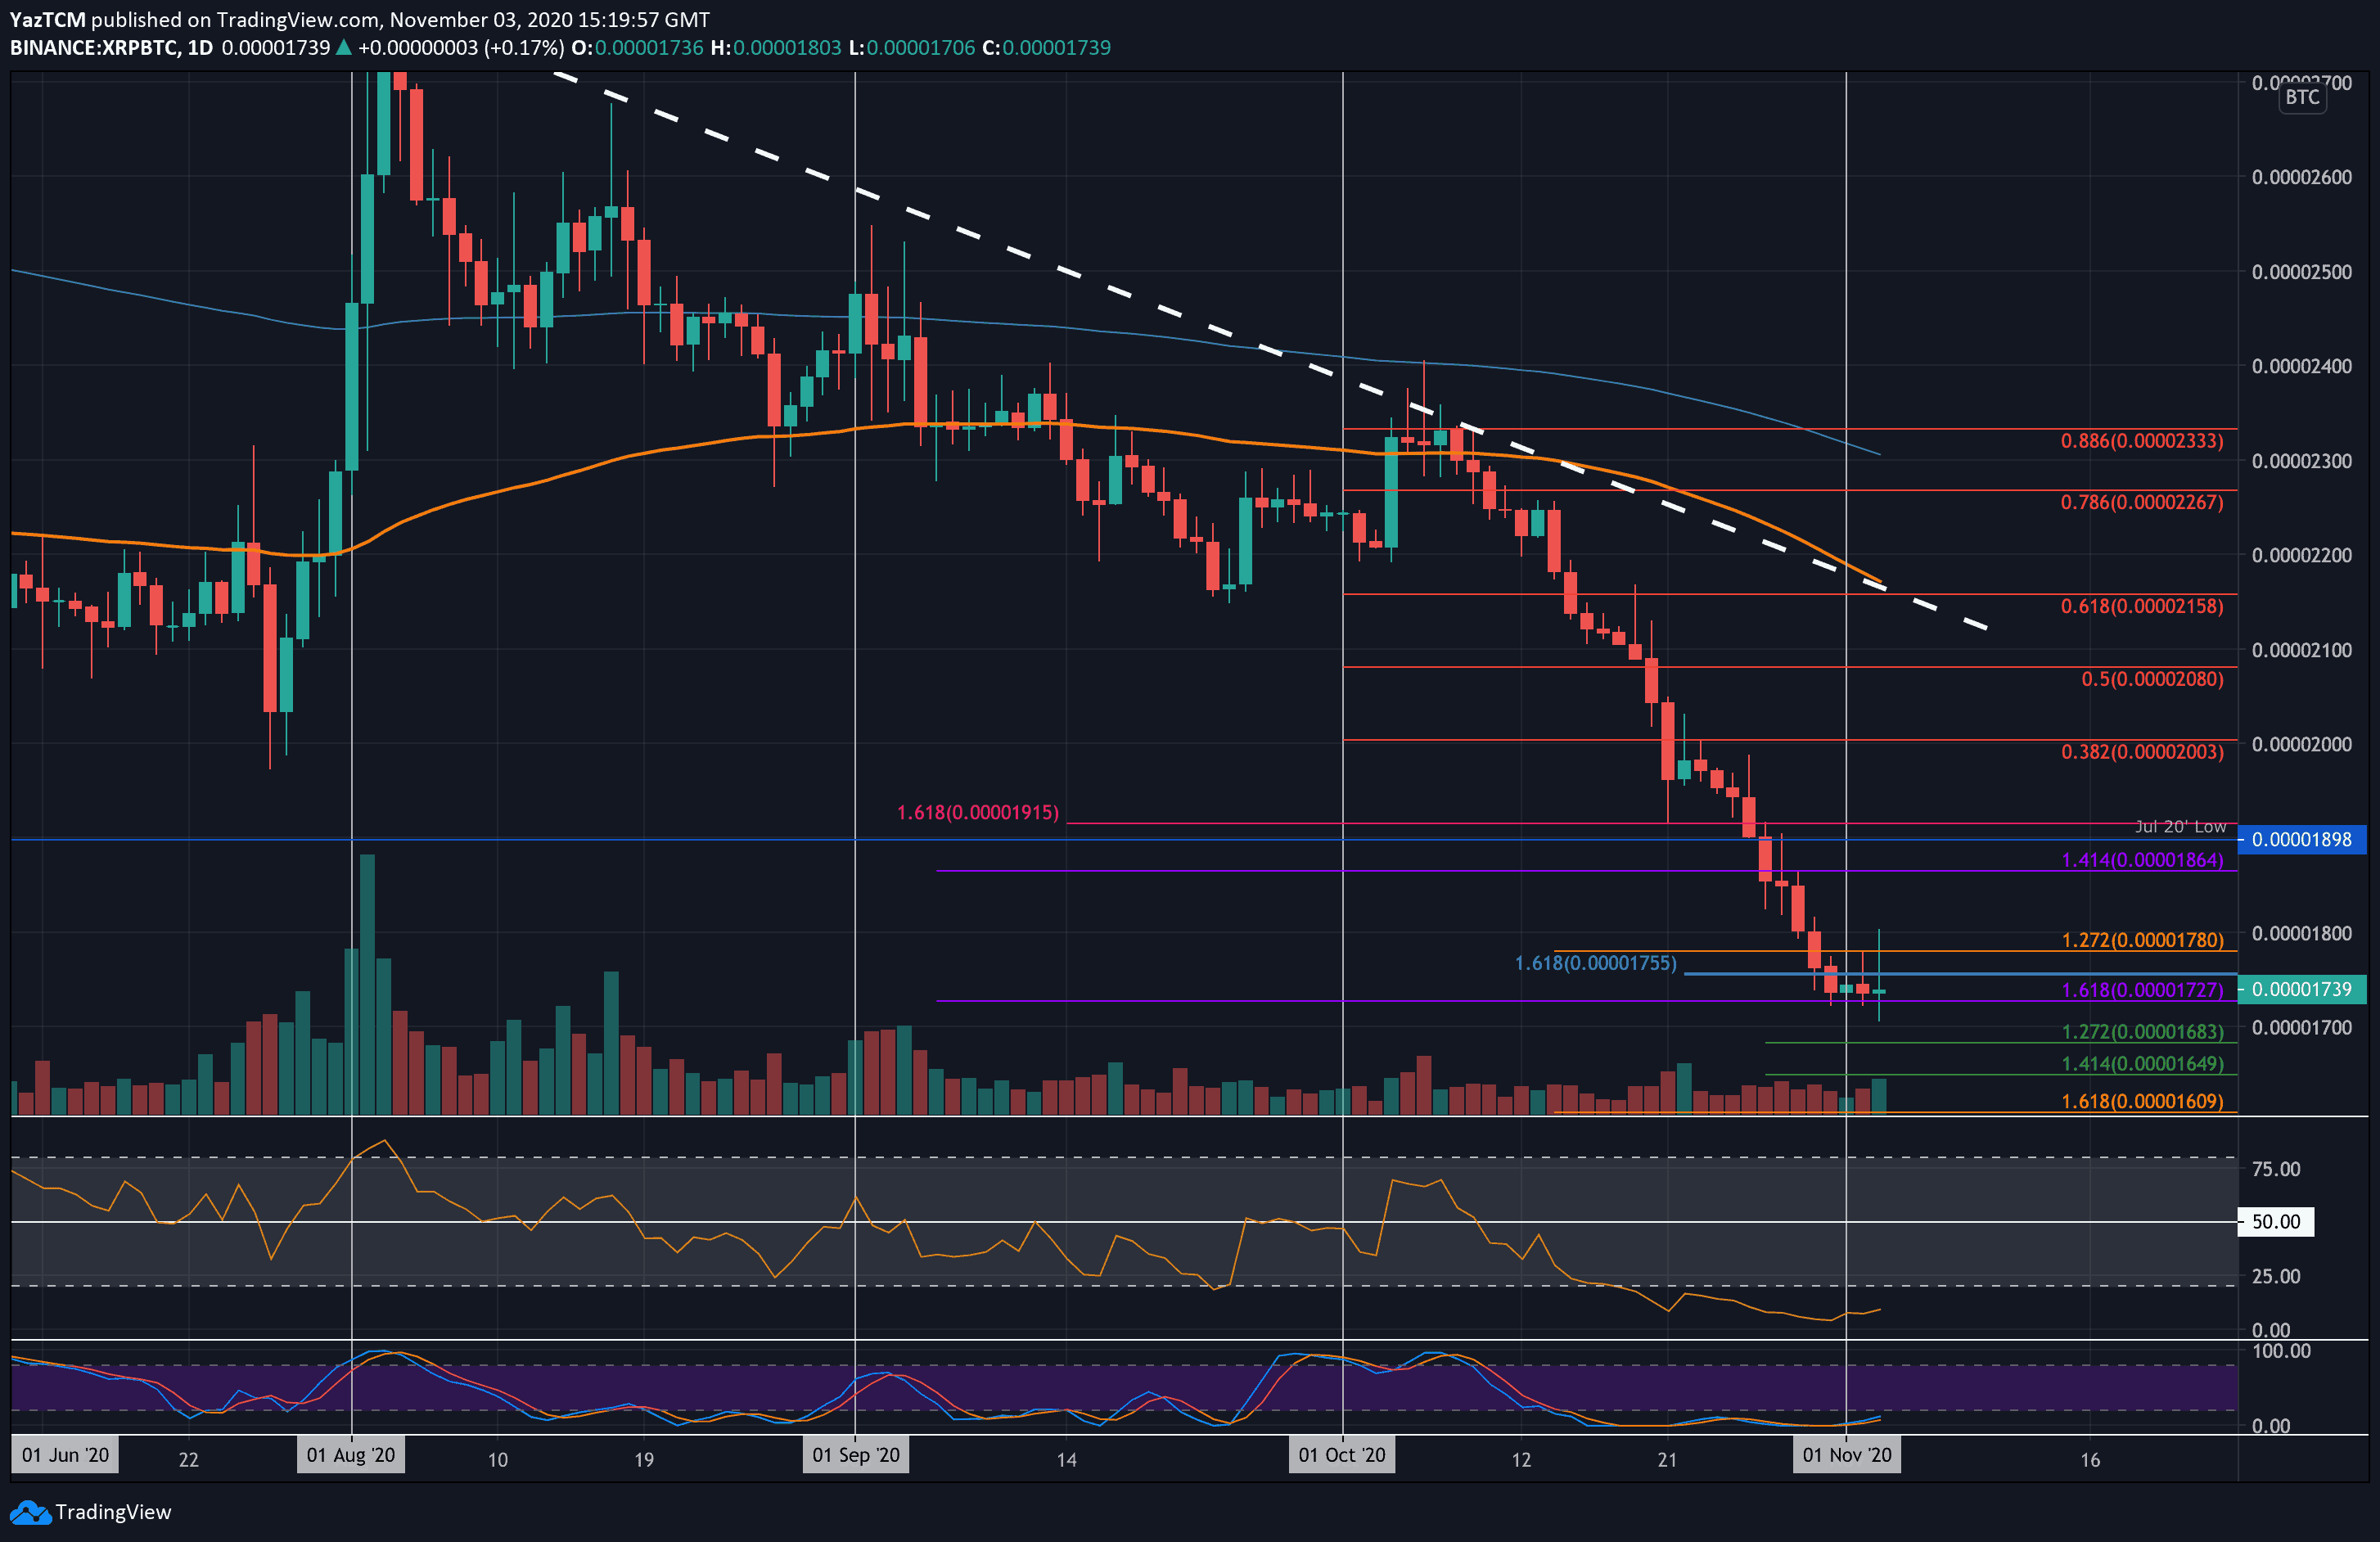
XRP-BTC Short Term Price Prediction
Looking ahead, if the bulls push higher, the first level of resistance lies at 1800 SAT. Above this, resistance lies at 1865 SAT, 1900 SAT, and 2000 SAT (bearish .382 Fib Retracement).
On the other side, if the sellers break beneath the 1725 SAT support, additional support lies at 1700 SAT, 1683 SAT (downside 1.272 Fib Extension), 1650 SAT (downside 1.414 Fib Extension), and 1600 SAT.
Likewise, both the RSI and Stochastic RSI are extremely oversold in this market, suggesting that the downward pressure could come to an end pretty soon.