Long-term Technical Analysis: The Monthly Based on the monthly timeframe, the market is not showing any strength yet. Let’s examine the market structure using the trend lines and indicators shown in the following chart. If we compare the current cycle (2021) with the previous one (2017), the RSI indicator is still on its uptrend with a lower slope (marked by green – dynamic line). During the 2017 bull run, the failure of this line signaled the end of the bull run (the red vertical line). However, the mid-term trend line was already broken in April and created similar conditions as were seen once the 2017 bull run ended. It remains to be seen if hitting the new ATH was the end of a bullish phase that started in July. The Stochastic RSI oscillator is currently near the
Topics:
George Georgiev considers the following as important: Bitcoin (BTC) Price, BTC Analysis, BTCEUR, BTCGBP, btcusd, btcusdt
This could be interesting, too:
Mandy Williams writes Bitcoin ETFs Record Over .6B in Outflows in the Past 2 Weeks
Chayanika Deka writes Bitcoin Whales Offload 6,813 BTC as Selling Pressure Mounts
Wayne Jones writes Bitcoin Sentiment Hits 2022 Lows as Fear & Greed Index Falls to 10
Jordan Lyanchev writes Bitcoin Falls Below K for the First Time in 3 Months, How Much Lower Can It Go?
Long-term Technical Analysis: The Monthly
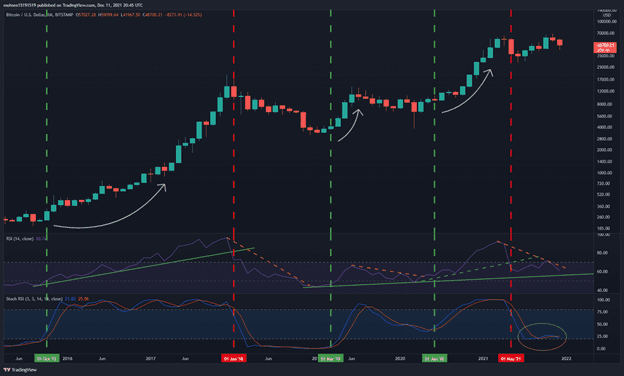
Based on the monthly timeframe, the market is not showing any strength yet. Let’s examine the market structure using the trend lines and indicators shown in the following chart.
If we compare the current cycle (2021) with the previous one (2017), the RSI indicator is still on its uptrend with a lower slope (marked by green – dynamic line).
During the 2017 bull run, the failure of this line signaled the end of the bull run (the red vertical line). However, the mid-term trend line was already broken in April and created similar conditions as were seen once the 2017 bull run ended. It remains to be seen if hitting the new ATH was the end of a bullish phase that started in July.
The Stochastic RSI oscillator is currently near the oversold area. We still have to wait for the cross above the two lines in this index, which had been the beginning of the strong uptrend (green vertical line). Another confirmation obtained is the break of the downtrend line in RSI (yellow dynamic dashed line).
It seems like the BTC price will enter a volatile phase for a while, before gaining the momentum needed for a significant uptrend. Such an uptrend usually requires a fundamental catalyst (positive news) or a new wave of newcomers injecting fresh capital into the market.
Short-Term Analysis: The 4-Hour Timeframe
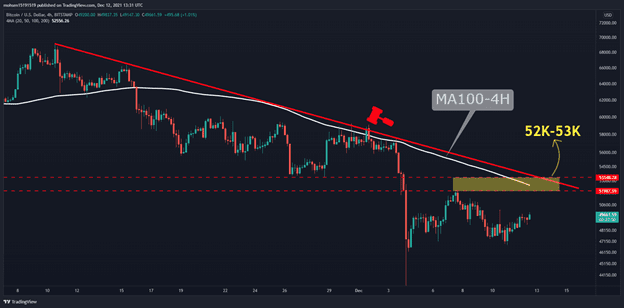
The yellow static zone is the major resistance area on the way to recovery for bitcoin. This zone combines dynamic resistance, static resistance, and the MA100 line. Ten days ago, bitcoin struggled with this resistance, and after failing to break above, BTC dropped sharply to $42K (Dec-4). Breaking above this resistance can confirm the end of this short-term downtrend.
Options market Analysis
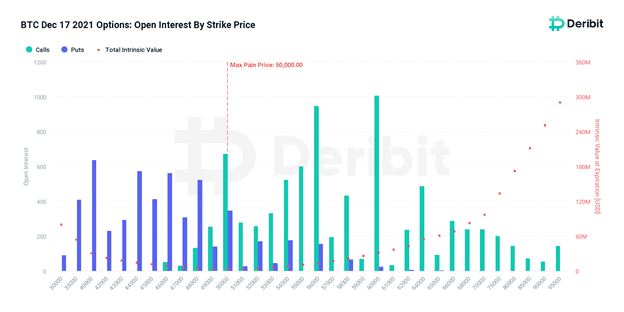
This Friday, 17 DEC 21, about $662 million worth of bitcoin options contracts will expire on Deribit Exchange. Max pain price is $50k for this expiry. Calls at $60k strike price have the highest open interest – lots of calls sold for this strike price.
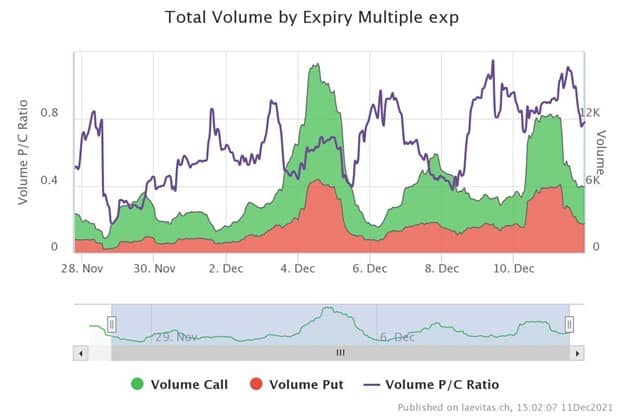
To better understand options traders’ activities for Dec, we can consider the Total volume trend specifically filtered for December’s expiries. P/C Ratio increased for this month, meaning option traders still want to hedge against the market’s downside.
Last week’s top instrument OI change shows lots of calls activities at 60k strike for 31-Dec expiry: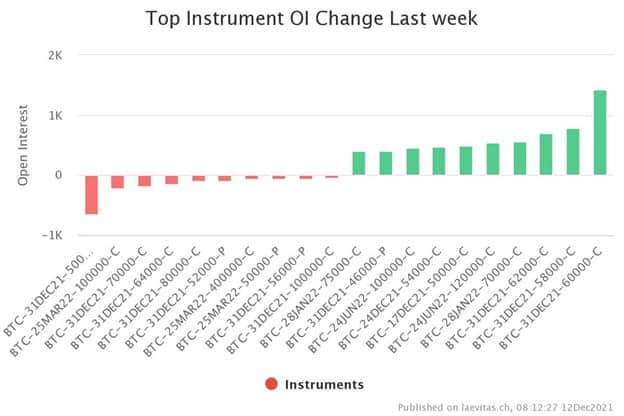
On-chain Analysis
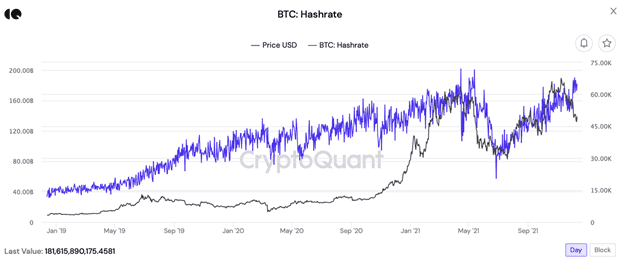
A fascinating on-chain metric to watch in recent weeks was the BTC hashrate. Following the great migration of miners to North America, just after China banned the mining, the network has gained its hashrate again.
This healthy and steady trend shows the string conviction of new investors in the mining industry. The new miners are not reacting to the market sentiment, and all they seem to care for is to mine as much as they can. In other words, the risk of missing the mining opportunities is high for these new players.
The above analysis was complied by @N__E__D__A, @GrizzlyBTClover, and @CryptoVizArt. Data provided by @tsypruyan exclusively for CryptoPotato.