Bitcoin dropped by almost ,000 over the past 48 hours as it fell by 25% to reach yesterday’s low at ,300. After the huge drop, which can also be seen as another Black Monday, the bulls found support at a rising trend line that extends back to the December lows.Since this support was reached at the closing time for yesterday’s candle, Bitcoin had already recovered over 15% from its low, allowing it to close Monday at ,455.Today, BTC tried to push higher but faced strong resistance around ,460 – provided by the 50-MA, as marked on the following 4-hour chart. At the time of this writing, Bitcoin is trading around K.BTC Price Support and Resistance Levels to WatchKey Support Levels: ,800, ,000 ,500, ,000, ,300, ,000.Key Resistance Levels: ,460, ,150,
Topics:
Yaz Sheikh considers the following as important: Bitcoin (BTC) Price, BTC Analysis, BTCEUR, BTCGBP, btcusd, btcusdt
This could be interesting, too:
Mandy Williams writes Bitcoin ETFs Record Over .6B in Outflows in the Past 2 Weeks
Chayanika Deka writes Bitcoin Whales Offload 6,813 BTC as Selling Pressure Mounts
Wayne Jones writes Bitcoin Sentiment Hits 2022 Lows as Fear & Greed Index Falls to 10
Jordan Lyanchev writes Bitcoin Falls Below K for the First Time in 3 Months, How Much Lower Can It Go?
Bitcoin dropped by almost $11,000 over the past 48 hours as it fell by 25% to reach yesterday’s low at $30,300. After the huge drop, which can also be seen as another Black Monday, the bulls found support at a rising trend line that extends back to the December lows.
Since this support was reached at the closing time for yesterday’s candle, Bitcoin had already recovered over 15% from its low, allowing it to close Monday at $35,455.
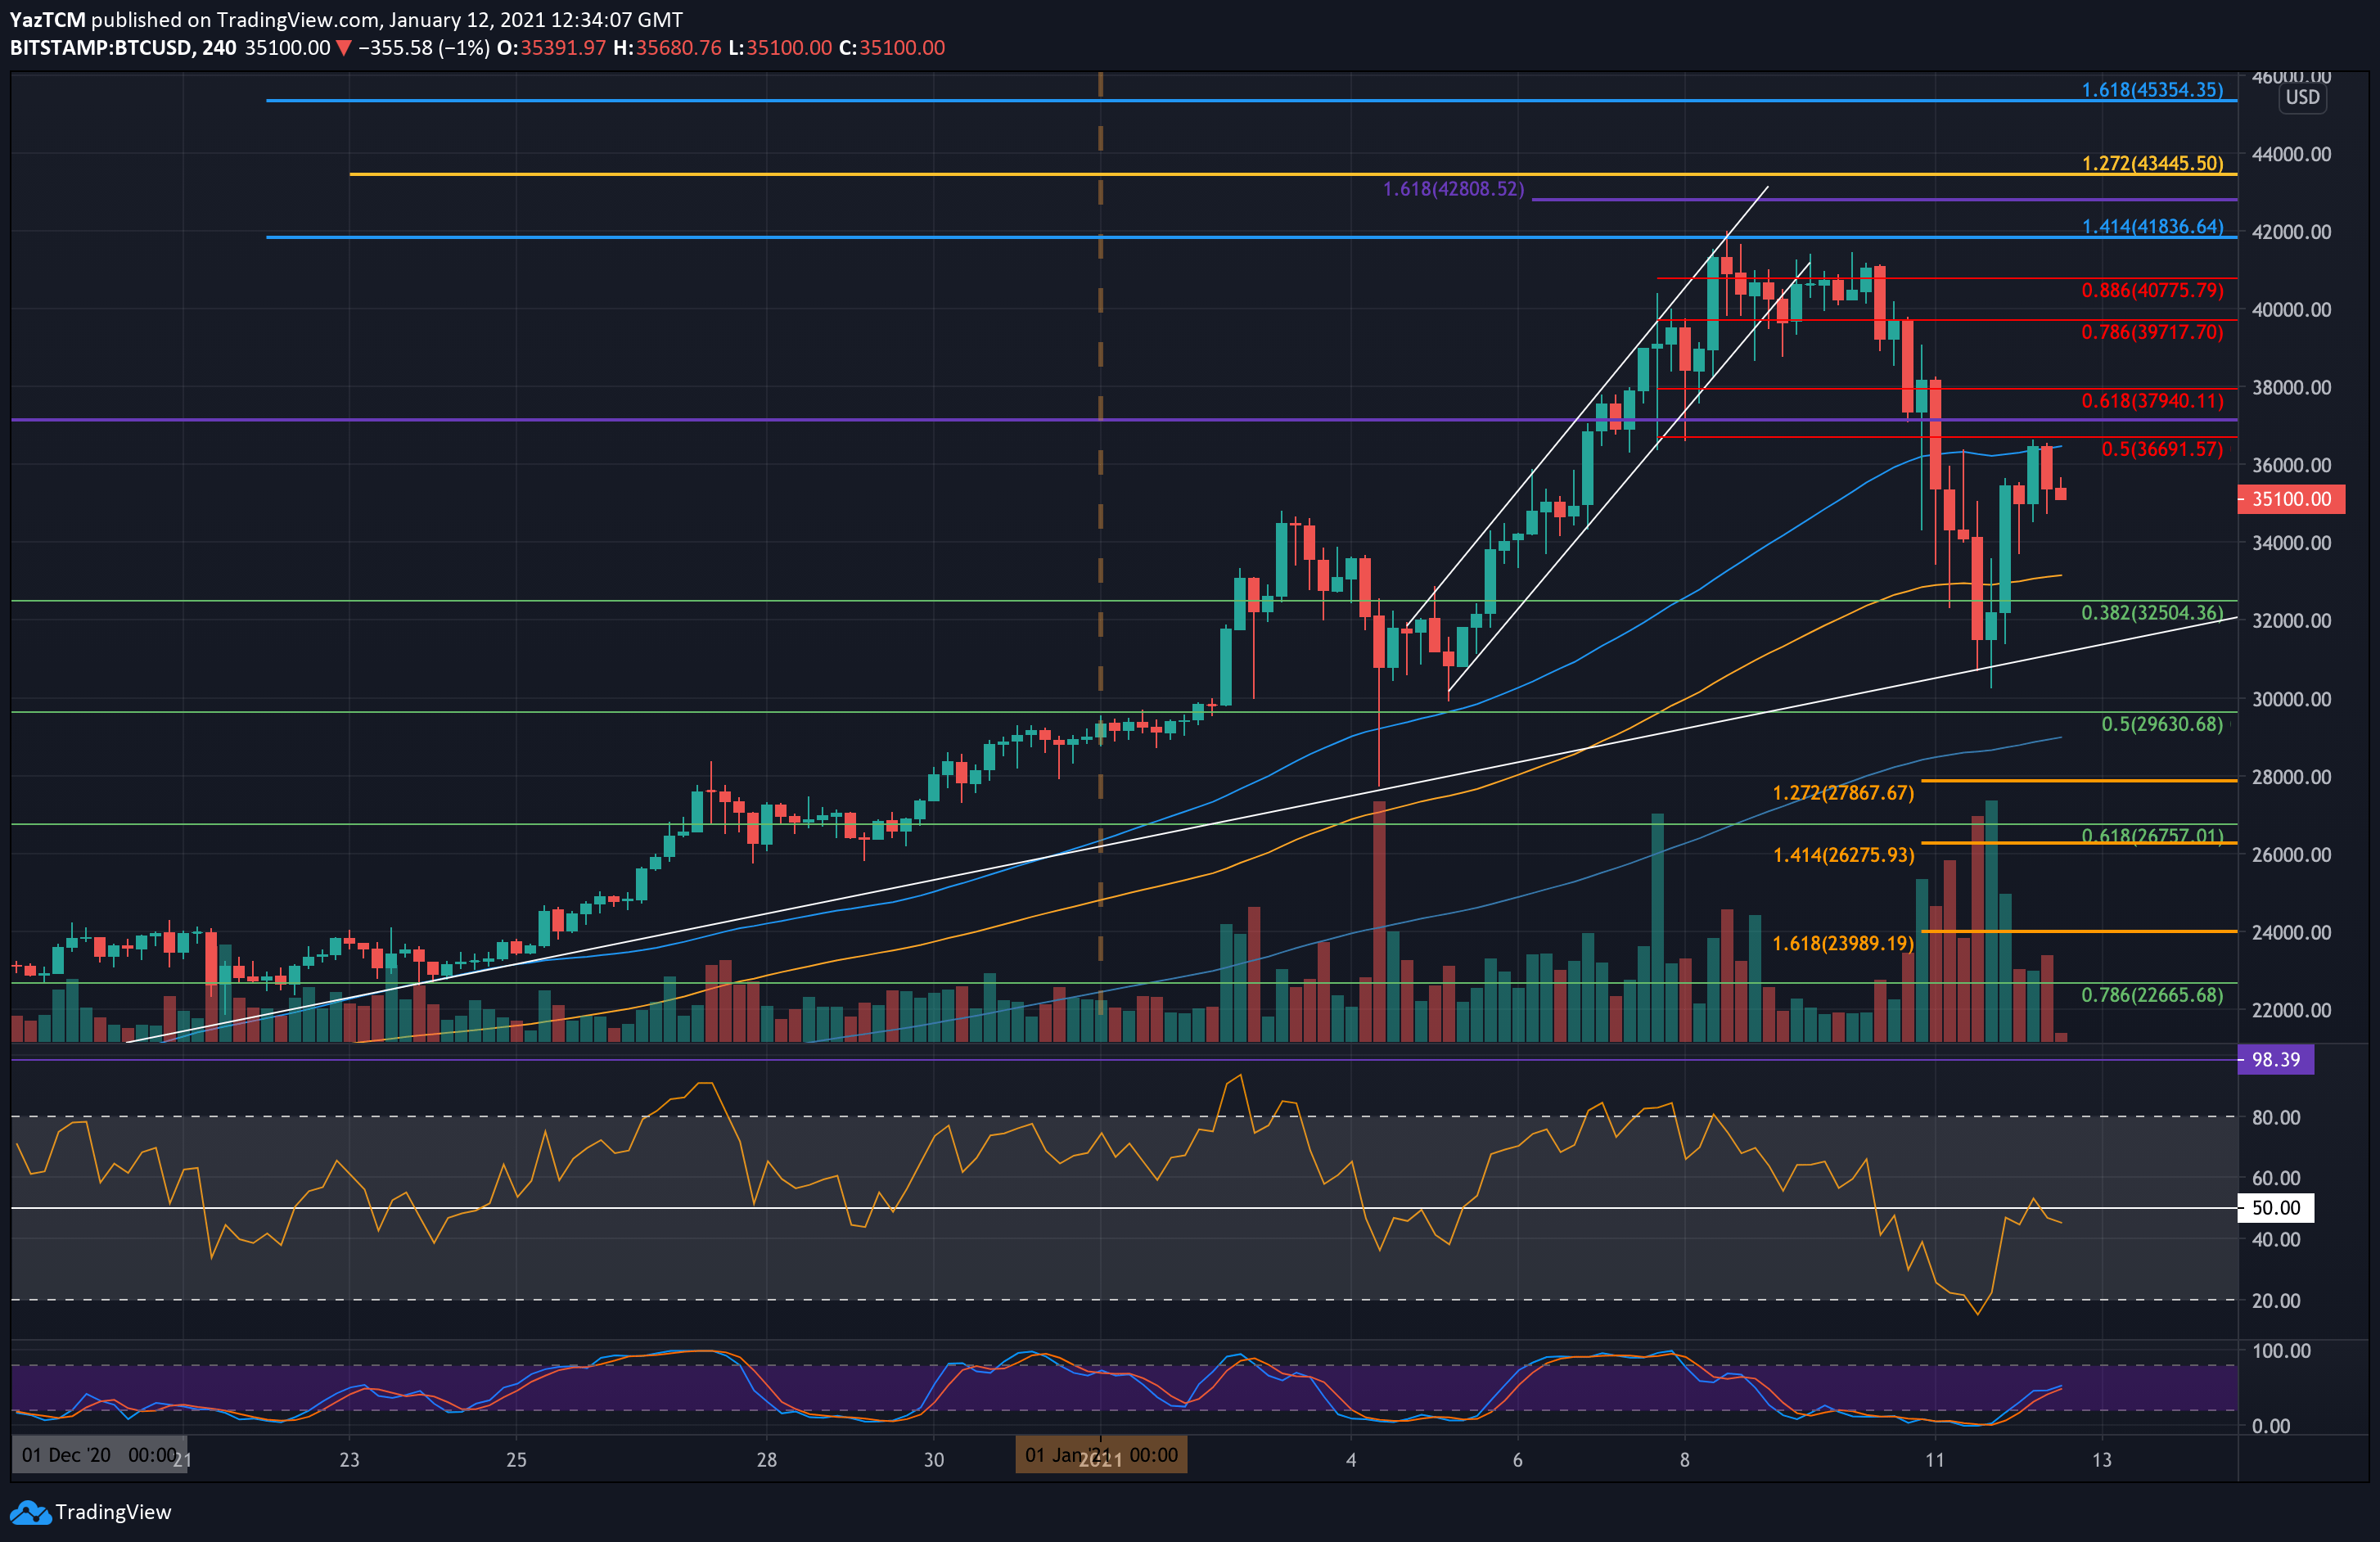
Today, BTC tried to push higher but faced strong resistance around $36,460 – provided by the 50-MA, as marked on the following 4-hour chart. At the time of this writing, Bitcoin is trading around $35K.
BTC Price Support and Resistance Levels to Watch
Key Support Levels: $34,800, $34,000 $32,500, $32,000, $30,300, $30,000.
Key Resistance Levels: $36,460, $37,150, $37,940 – $38,000, $39,700-$40,000.
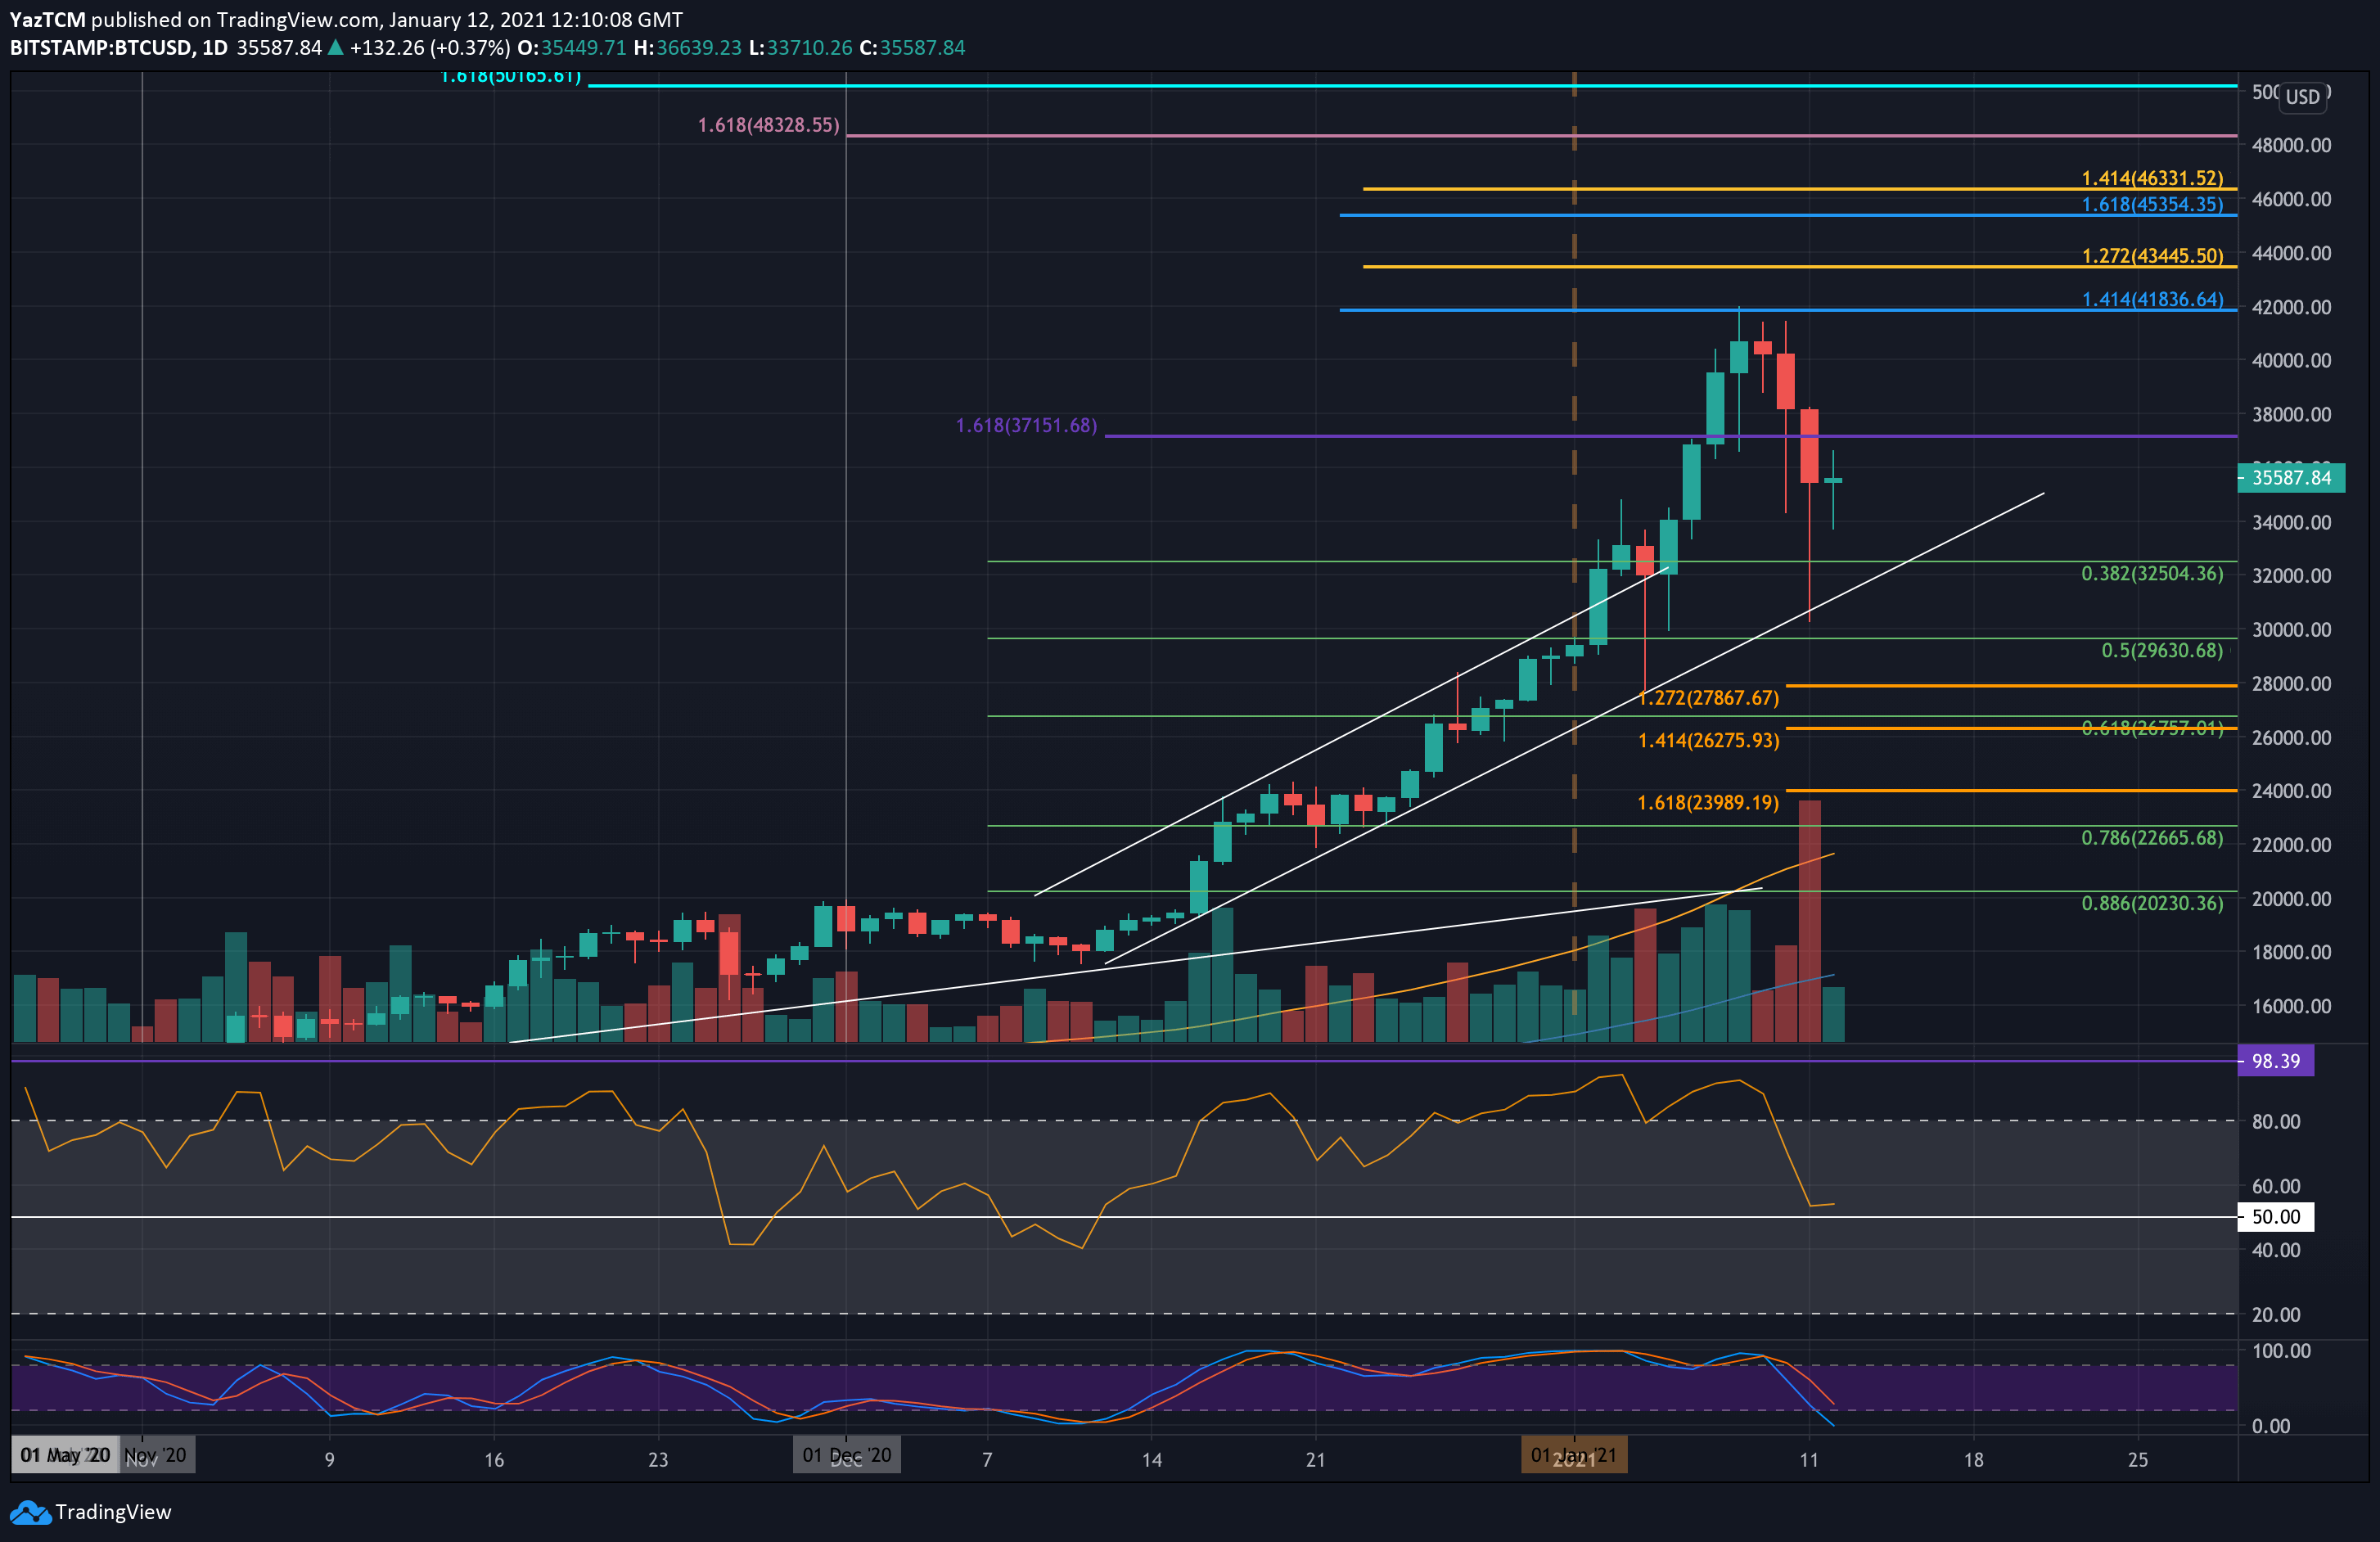
Moving forward, if the correction is not over yet, then the first level of support lies at $34,800 (the high recorded January 3rd), followed by $34,000.
Further down lies $32,500 (.382 Fib Retracement), $32,000, and the rising trend line support (which now lies around $31,000). The next support lies at $30,300 (yesterday’s low) and $30,000.
On the other side, the first level of resistance lies at $36,460 (4-hour 50-MA, today’s highest area). This is followed by $37,151, $37,940 – $38K (bearish .618 Fib), $39,700 (bearish .786 Fib), and $40,000. Beyond $40,000, added resistance is found at $40,775 (bearish .886 Fib), $42,000 (ATH Price), and $42,800.
The daily RSI remains healthy as it stays above the midline. The price drop yesterday allowed it to drop from extremely overbought conditions, giving the market some space to breathe, maybe for another bullish move?
Bitstamp BTC/USD Daily Chart
Bitstamp BTC/USD 4-Hour Chart