Bitcoin is down by a sharp 3% over the past 24 hours. The cryptocurrency bounced from ,185 (downside 1.618 Fib Extension) last week but failed to overcome resistance at ,765 (bearish .382 Fib & 200-day MA). From there, BTC headed lower into the weekend but sustained support at ,760 after spiking as low as ,520. The daily chart looks pretty choppy, but the short-term 4-hour chart provides a clear symmetrical triangle pattern forming. Yesterday, BTC bounced from the lower boundary of this triangle and reached the upper angle (K). The price was rejected at the upper angle and started to head lower from there. The market is now attempting to defend support of around ,000 – provided by a short-term .5 Fib level. A breakout of this short-term triangle will
Topics:
Yaz Sheikh considers the following as important: Bitcoin (BTC) Price, BTC Analysis, BTCEUR, BTCGBP, btcusd, btcusdt
This could be interesting, too:
Chayanika Deka writes XRP, SOL, and ADA Inclusion in US Crypto Reserve Pushes Traders on Edge
Chayanika Deka writes Why Arthur Hayes Is Bullish on Bitcoin Under Trump’s Economic Strategy
Mandy Williams writes Why the Bitcoin Market Is Stuck—and the Key Metric That Could Change It: CryptoQuant CEO
Wayne Jones writes Metaplanet Acquires 156 BTC, Bringing Total Holdings to 2,391
Bitcoin is down by a sharp 3% over the past 24 hours.
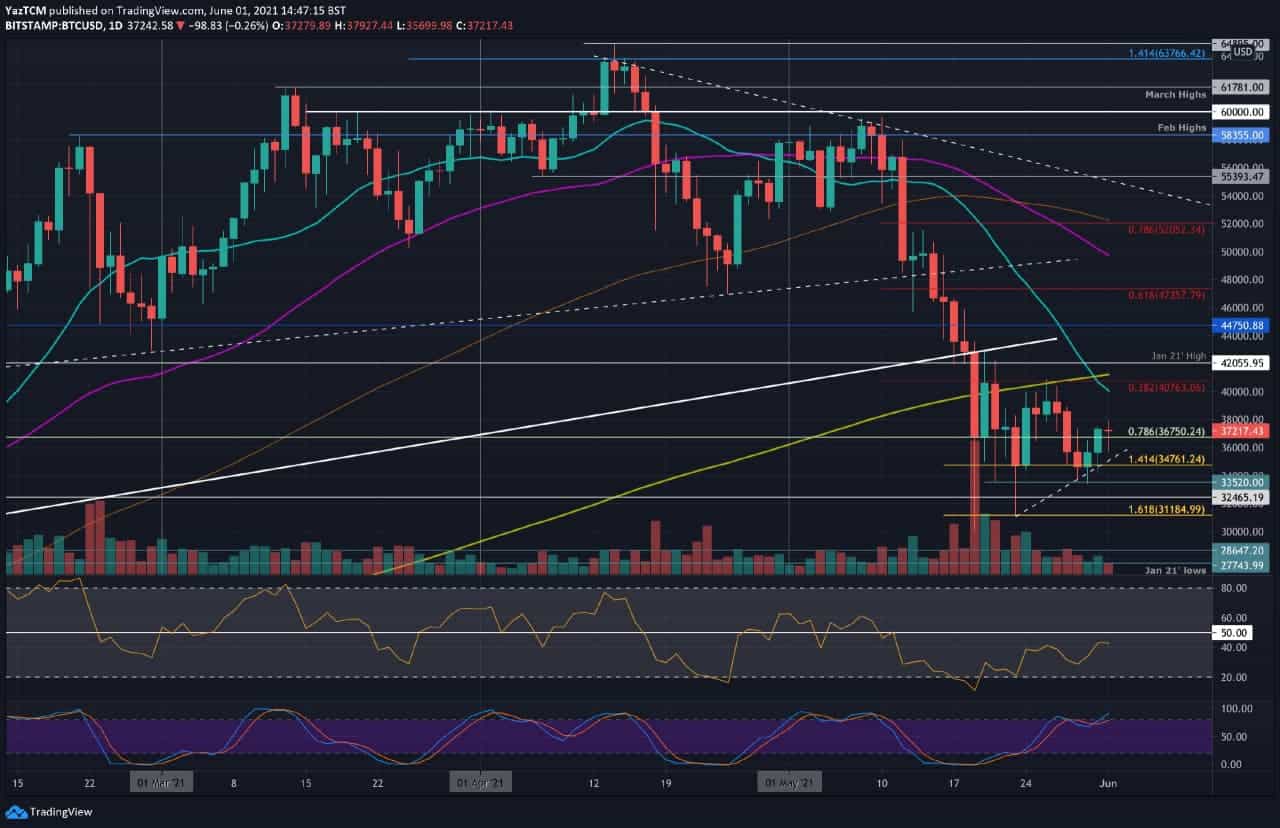
The cryptocurrency bounced from $31,185 (downside 1.618 Fib Extension) last week but failed to overcome resistance at $40,765 (bearish .382 Fib & 200-day MA).
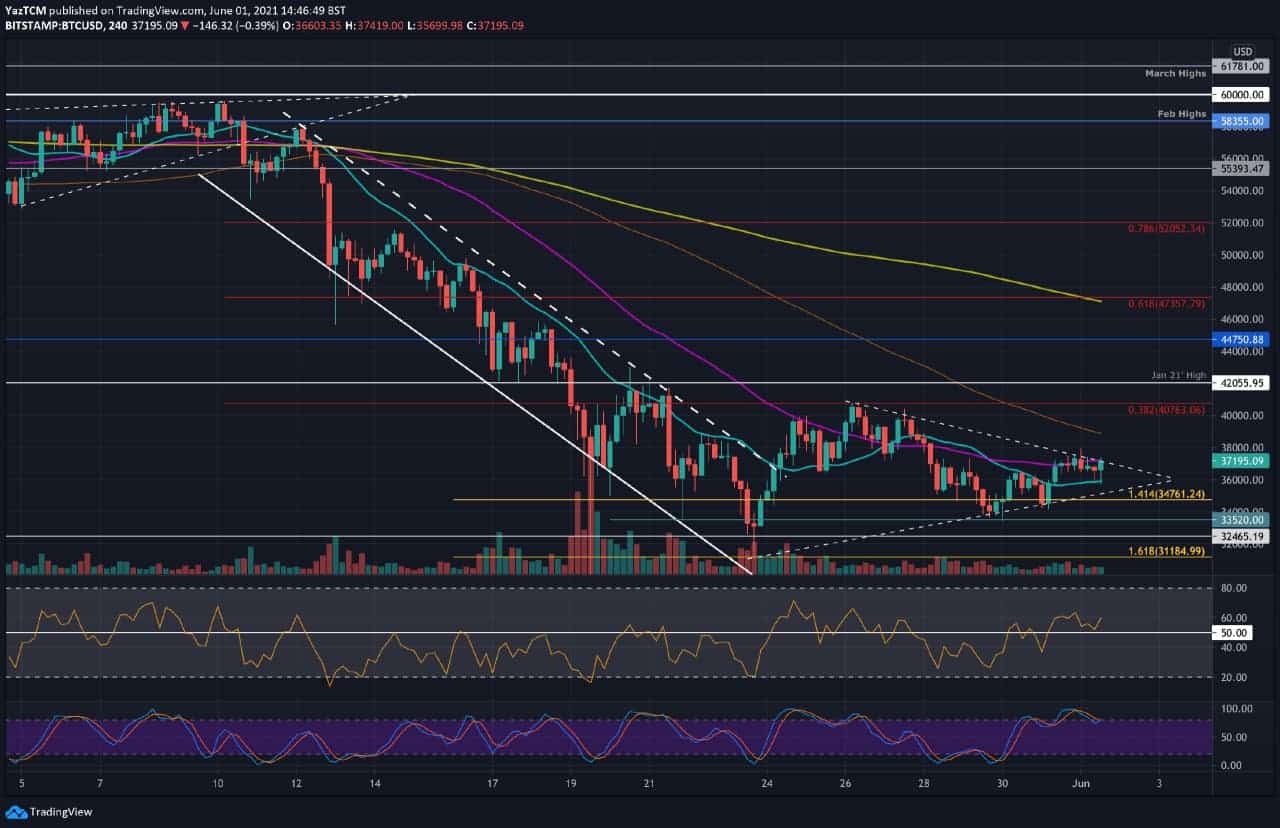
From there, BTC headed lower into the weekend but sustained support at $34,760 after spiking as low as $33,520. The daily chart looks pretty choppy, but the short-term 4-hour chart provides a clear symmetrical triangle pattern forming.
Yesterday, BTC bounced from the lower boundary of this triangle and reached the upper angle ($38K). The price was rejected at the upper angle and started to head lower from there. The market is now attempting to defend support of around $36,000 – provided by a short-term .5 Fib level.
A breakout of this short-term triangle will dictate the next direction for the market. A break toward the downside is likely to see BTC retesting $30,000 again, with a break toward the upside should set the stage for a recovery back above $40,000. We won’t have to wait long for this triangle to be resolved as the apex is set for June 3rd and the breakout typically occurs prior to the apex.
BTC Price Support and Resistance Levels to Watch
Key Support Levels: $35,100, $34,760, $34,000, $33,250, $32,465.
Key Resistance Levels: $37,200, $38,000, $40,000, $40,765, $41,200.
Looking ahead, the first support lies at $35,100 (lower angle of the the triangle. This is followed by $34,760 (downside 1.414 Fib Extension), $34,000, $33,250, and $32,465. Additional support lies at $32,000 and $31,185 (downside 1.618 Fib Extension).
On the other side, the first resistance lies at $37,200 (upper angle of the triangle). This is followed by $38,000, $40,000 (20-day MA), $40,765 (bearish .382 Fib), $41,200 (200-day MA), and $42,000 – which is the most critical level for the midterm.
The daily RSI remains sluggish as it sits in bearish territory. It is rising and created a higher high recently. However, it seems as if the bulls are still unable to create any form of sustained momentum just yet.
Bitstamp BTC/USD Daily Chart
Bitstamp BTC/USD 4-Hour Chart