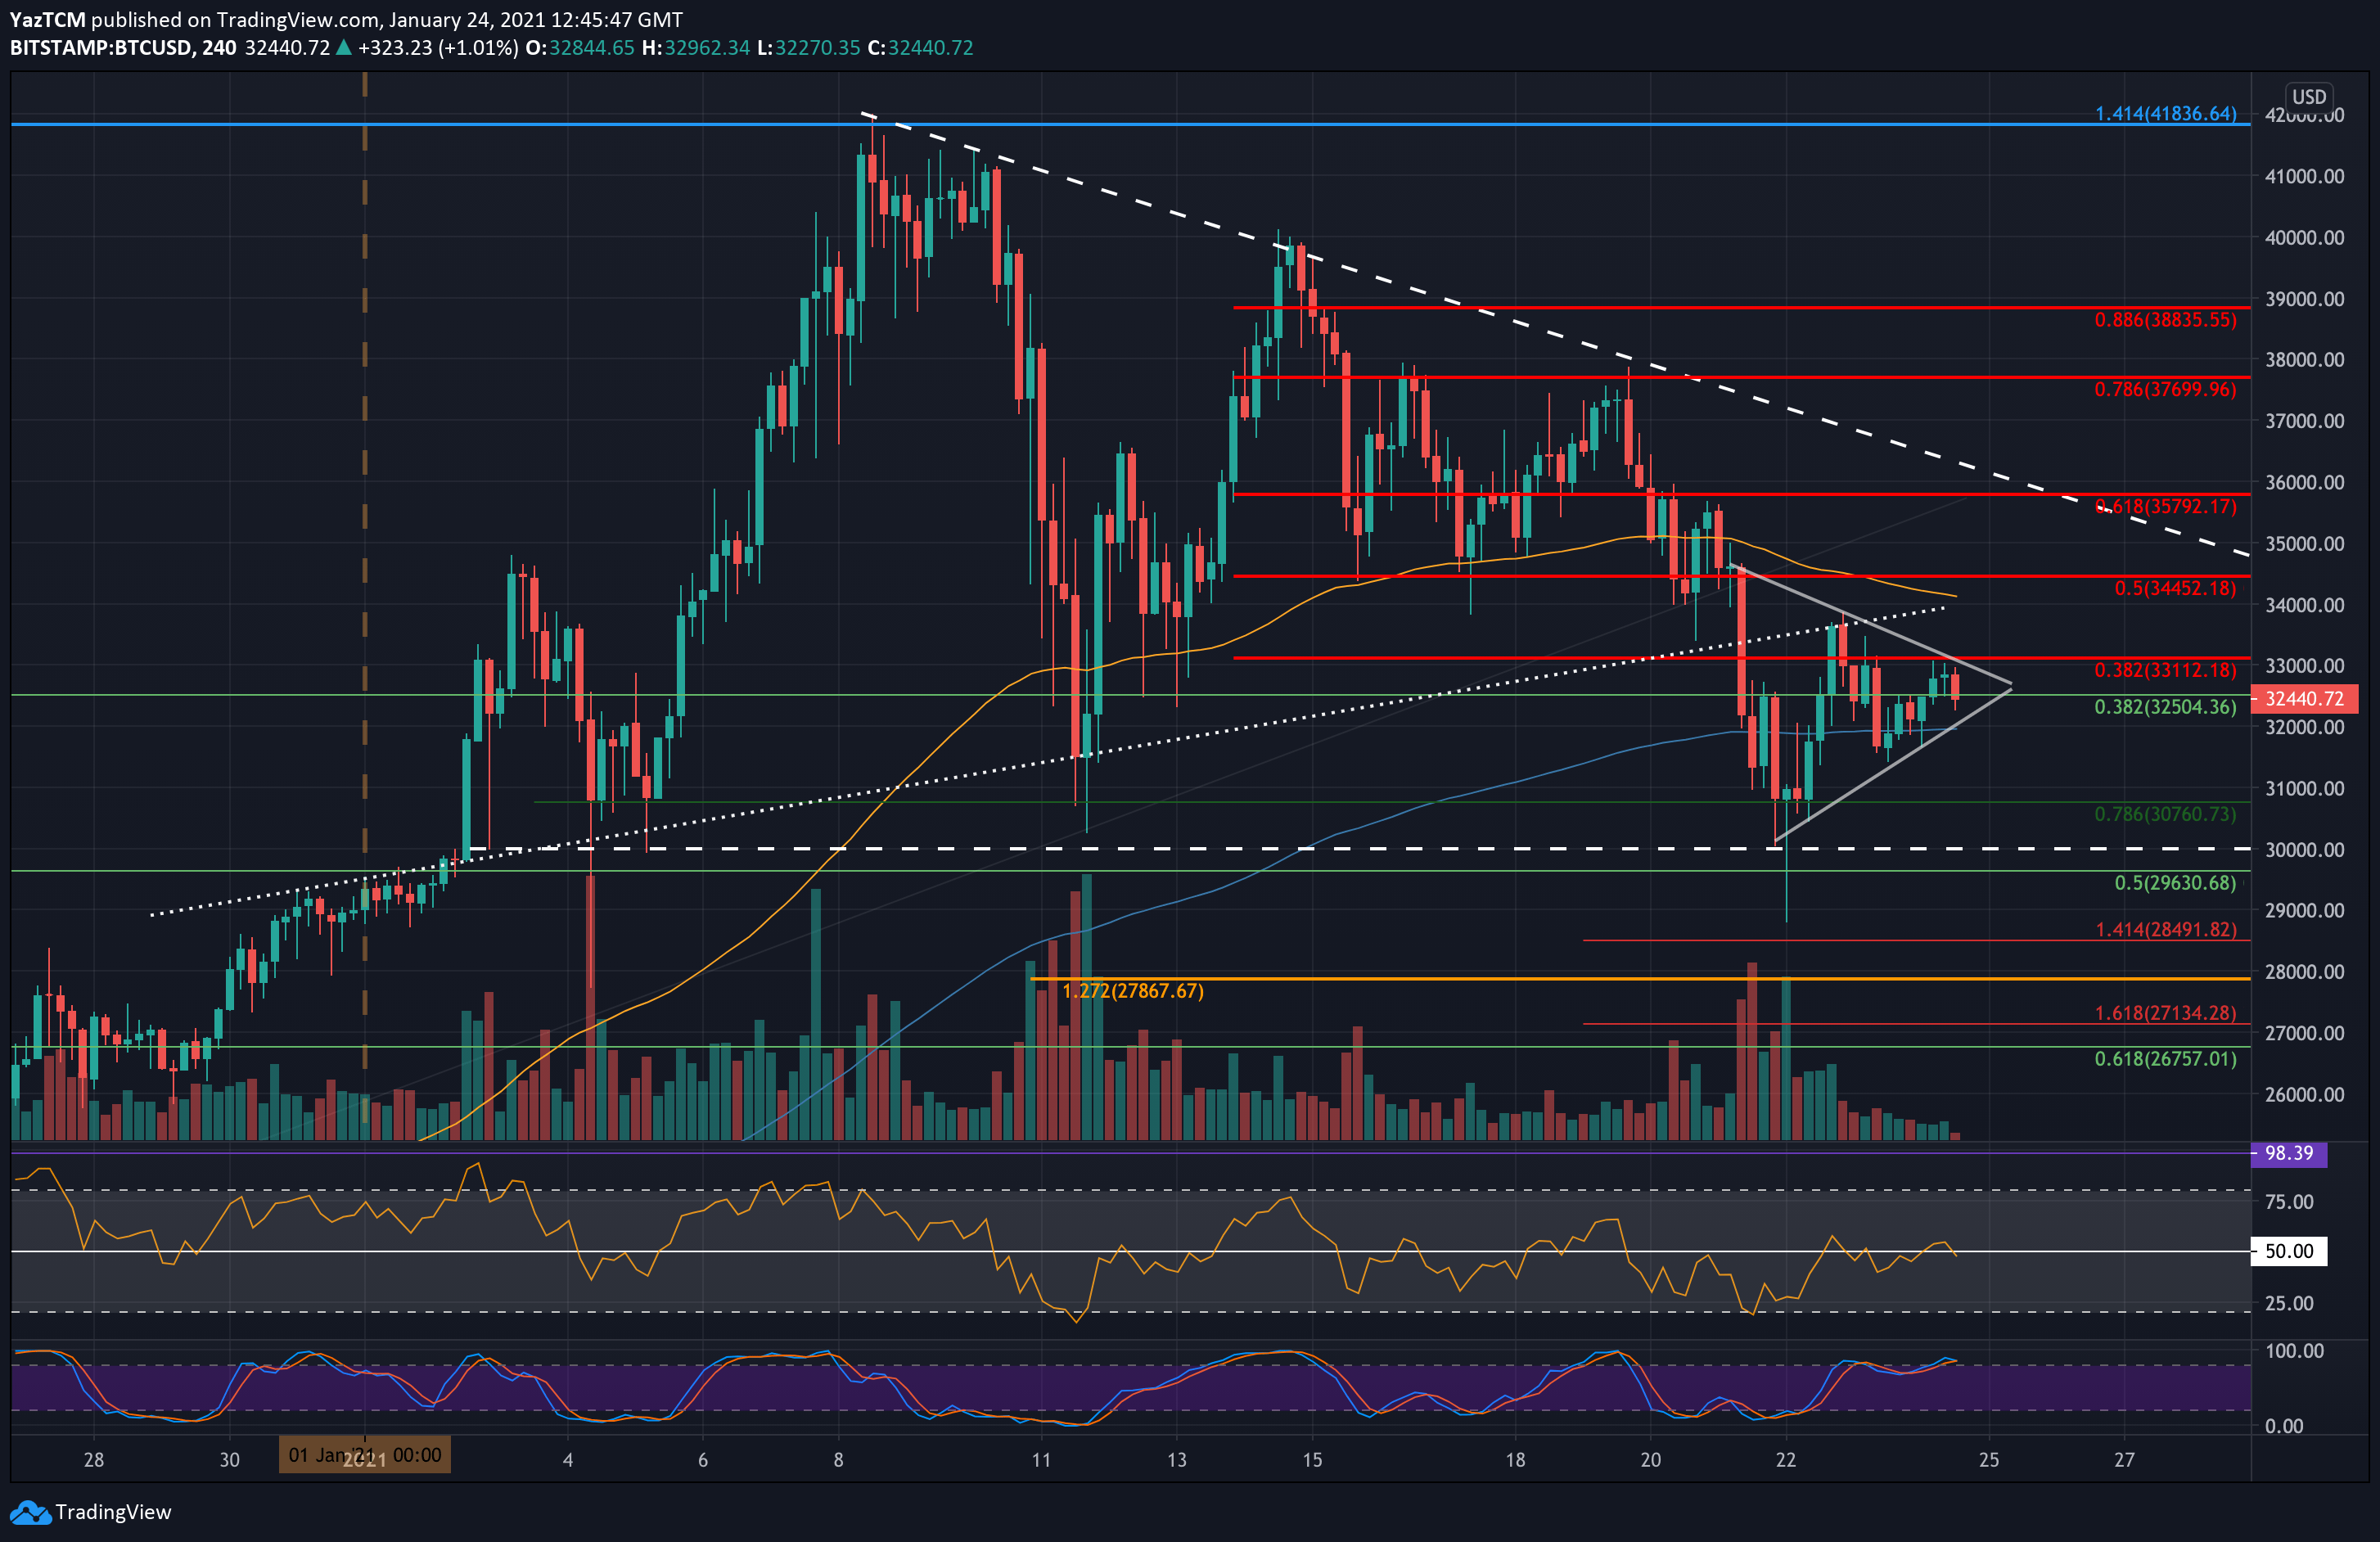
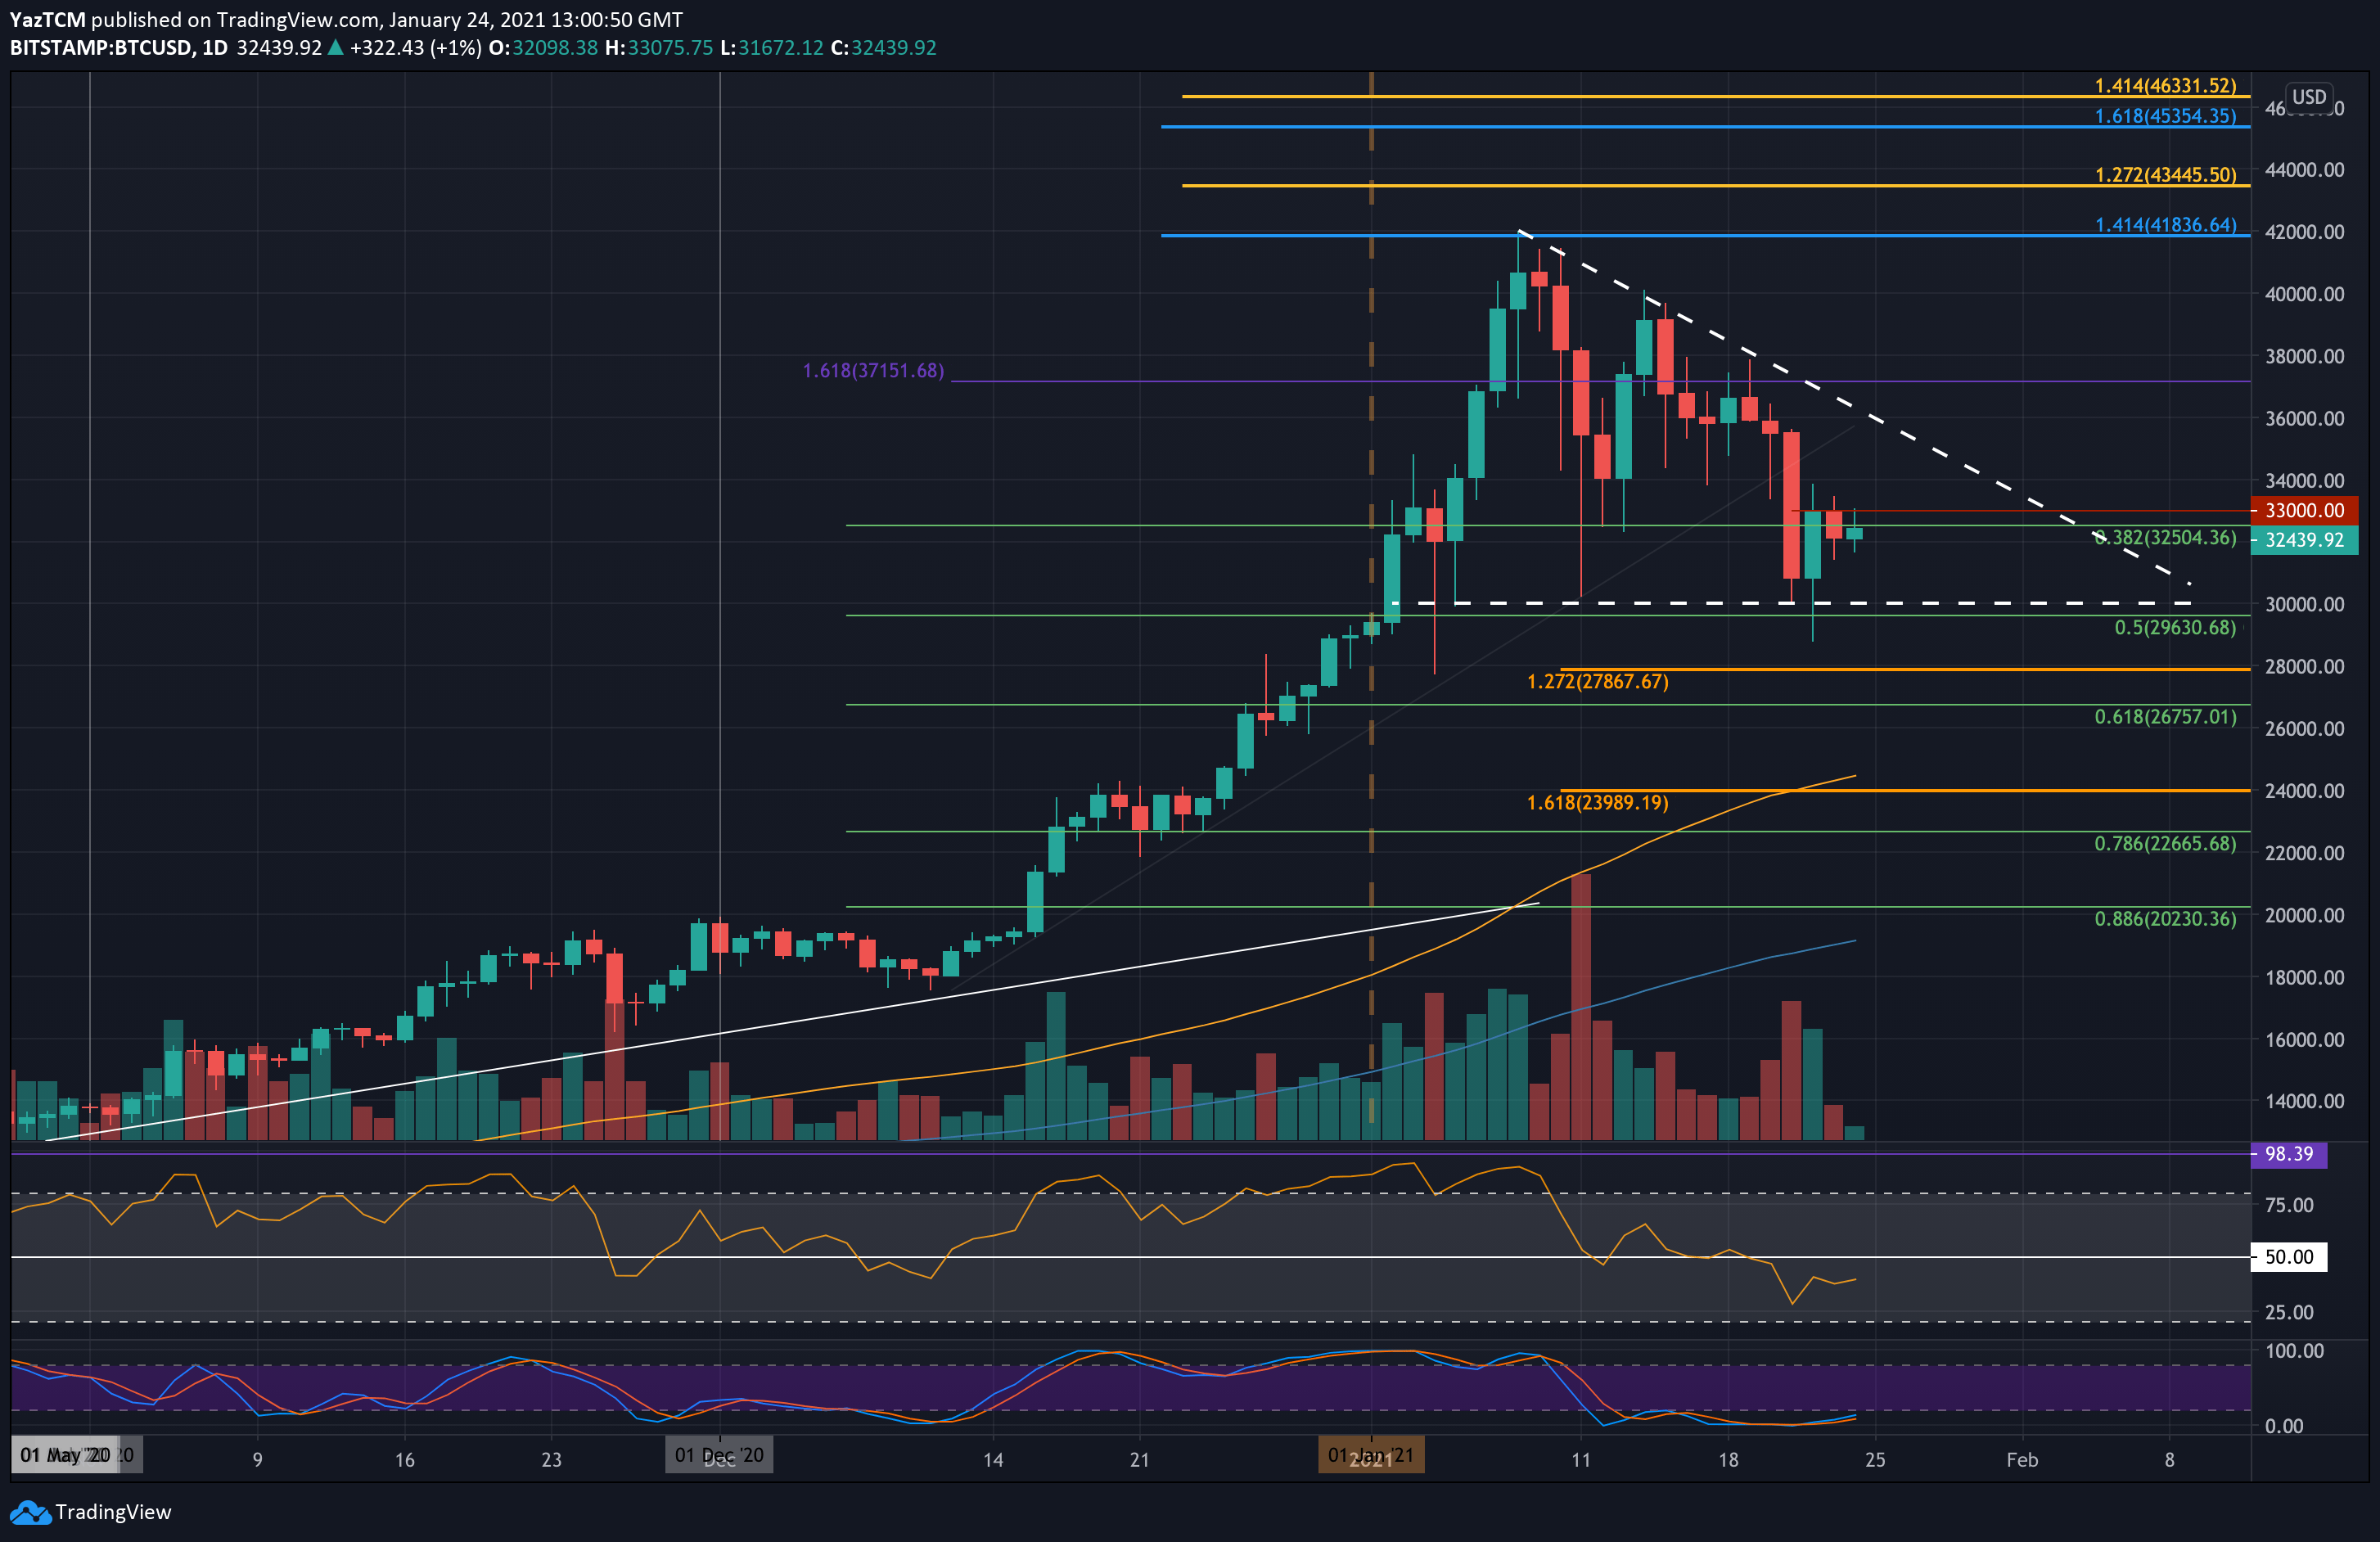
Over the past week, Bitcoin price lost approximately 10% of its value, following a drop from the K – K price area. This comes just two weeks after setting the current all-time high of ,000 on January 8, 2021.Over the past days, the primary cryptocurrency found support, once again, around the K horizontal line. Looking at the bigger picture, the ,000 had now formed the baseline of a bearish triangle that Bitcoin is currently trading within and can be seen on the following daily chart.Looking at the shorter timeframe, as can be seen on the following 4-hour chart, Bitcoin is trading inside a symmetrical triangle pattern, and struggling to hold above the 200-days moving average’s line of the 4-hour timeframe.The triangle boundaries are at around K from the top, K from the
Topics:
Yaz Sheikh considers the following as important: Bitcoin (BTC) Price, BTC Analysis, BTCEUR, BTCGBP, btcusd, btcusdt
This could be interesting, too:
Chayanika Deka writes XRP, SOL, and ADA Inclusion in US Crypto Reserve Pushes Traders on Edge
Chayanika Deka writes Why Arthur Hayes Is Bullish on Bitcoin Under Trump’s Economic Strategy
Mandy Williams writes Why the Bitcoin Market Is Stuck—and the Key Metric That Could Change It: CryptoQuant CEO
Wayne Jones writes Metaplanet Acquires 156 BTC, Bringing Total Holdings to 2,391
Over the past week, Bitcoin price lost approximately 10% of its value, following a drop from the $37K – $38K price area. This comes just two weeks after setting the current all-time high of $42,000 on January 8, 2021.
Over the past days, the primary cryptocurrency found support, once again, around the $30K horizontal line. Looking at the bigger picture, the $30,000 had now formed the baseline of a bearish triangle that Bitcoin is currently trading within and can be seen on the following daily chart.
Looking at the shorter timeframe, as can be seen on the following 4-hour chart, Bitcoin is trading inside a symmetrical triangle pattern, and struggling to hold above the 200-days moving average’s line of the 4-hour timeframe.
The triangle boundaries are at around $33K from the top, $32K from the bottom. The apex of the triangle is expected sometime during the next hours or day. Not always Bitcoin awaits the apex in order to break out, so a breakout can take place at any moment.
Once it occurs, we can expect a significant move towards the breakout’s direction. Furthermore, the trading volume has faded quite significantly this weekend, usually indicative of a large move ahead.
BTC Price Support and Resistance Levels to Watch
Key Support Levels: $32,000, $30,760, $30,000, $29,630, $29,000.
Key Resistance Levels: $33,110, $33,750, $35,000, $35,800 – $36K.
Looking ahead, the first level of support now lies at the lower boundary of the 4-hour chart’s symmetrical triangle around $32,000. This is followed by $30,760 (short term .786 Fib), $30,000 (descending triangle base), and $29,630 (.5 Fib Retracement).
The next targets down are $29,000, $28,500 (downside 1.414 Fib Extension, along with the weekly low), and $26,000.
On the other side, the first resistance lies at $33,110 (bearish .5 Fib), along with the upper angle of the symmetrical triangle on the following 4-hour’s chart.
This is followed by $33,750, $35,000, and $35,800 (bearish .618 Fib & upper border of descending triangle). We can expect the major resistance level to be around the $36K price area, where lies the upper angle of the bearish triangle as can be seen on the daily chart.
Further resistance levels lie at $37,000 and $37,700 (bearish .786 Fib).
The daily RSI is beneath the midline but attempts to rise, indicating the bearish momentum might be fading but failed to do so as of now. The RSI attempted to break the midline on the shorter-term charts, but the bullish momentum was not strong enough to get control of the market.
Bitstamp BTC/USD Daily Chart
Bitstamp BTC/USD 4-Hour Chart