Bitcoin (BTC) Price Analysis Bitcoin collapsed by almost 15% from today’s ,000 opening price, reaching as low as ,540 (as of now). The cryptocurrency had set a new all-time high price earlier in the week at ,895 but failed to produce a daily closing candle above significant resistance at ,760. Together with the bearish divergence that spotted on the 4-hour timeframe, and fundamental rumors and FUD, this resulted in one of the ugliest drops ever. In a matter of minutes, Bitcoin dropped sharply from the k area to .5k, according to Bitstamp. The steep price decline found support near a .618 Fib, which allowed the coin to rebound to the current level of around ,300. It is now trying to gain ground back above ,400 as it will face the 50-day moving
Topics:
Yaz Sheikh considers the following as important: BTC Analysis, BTCEUR, BTCGBP, btcusd, btcusdt, ETH Analysis, ETHBTC, ethusd, Price Analysis, XRP Analysis, xrpbtc, xrpusd
This could be interesting, too:
Chayanika Deka writes Bitcoin Whales Offload 6,813 BTC as Selling Pressure Mounts
Wayne Jones writes Bitcoin Sentiment Hits 2022 Lows as Fear & Greed Index Falls to 10
Dimitar Dzhondzhorov writes Is a Major Ripple v. SEC Lawsuit Development Expected This Week? Here’s Why
Jordan Lyanchev writes Bitcoin Falls Below K for the First Time in 3 Months, How Much Lower Can It Go?
Bitcoin (BTC) Price Analysis
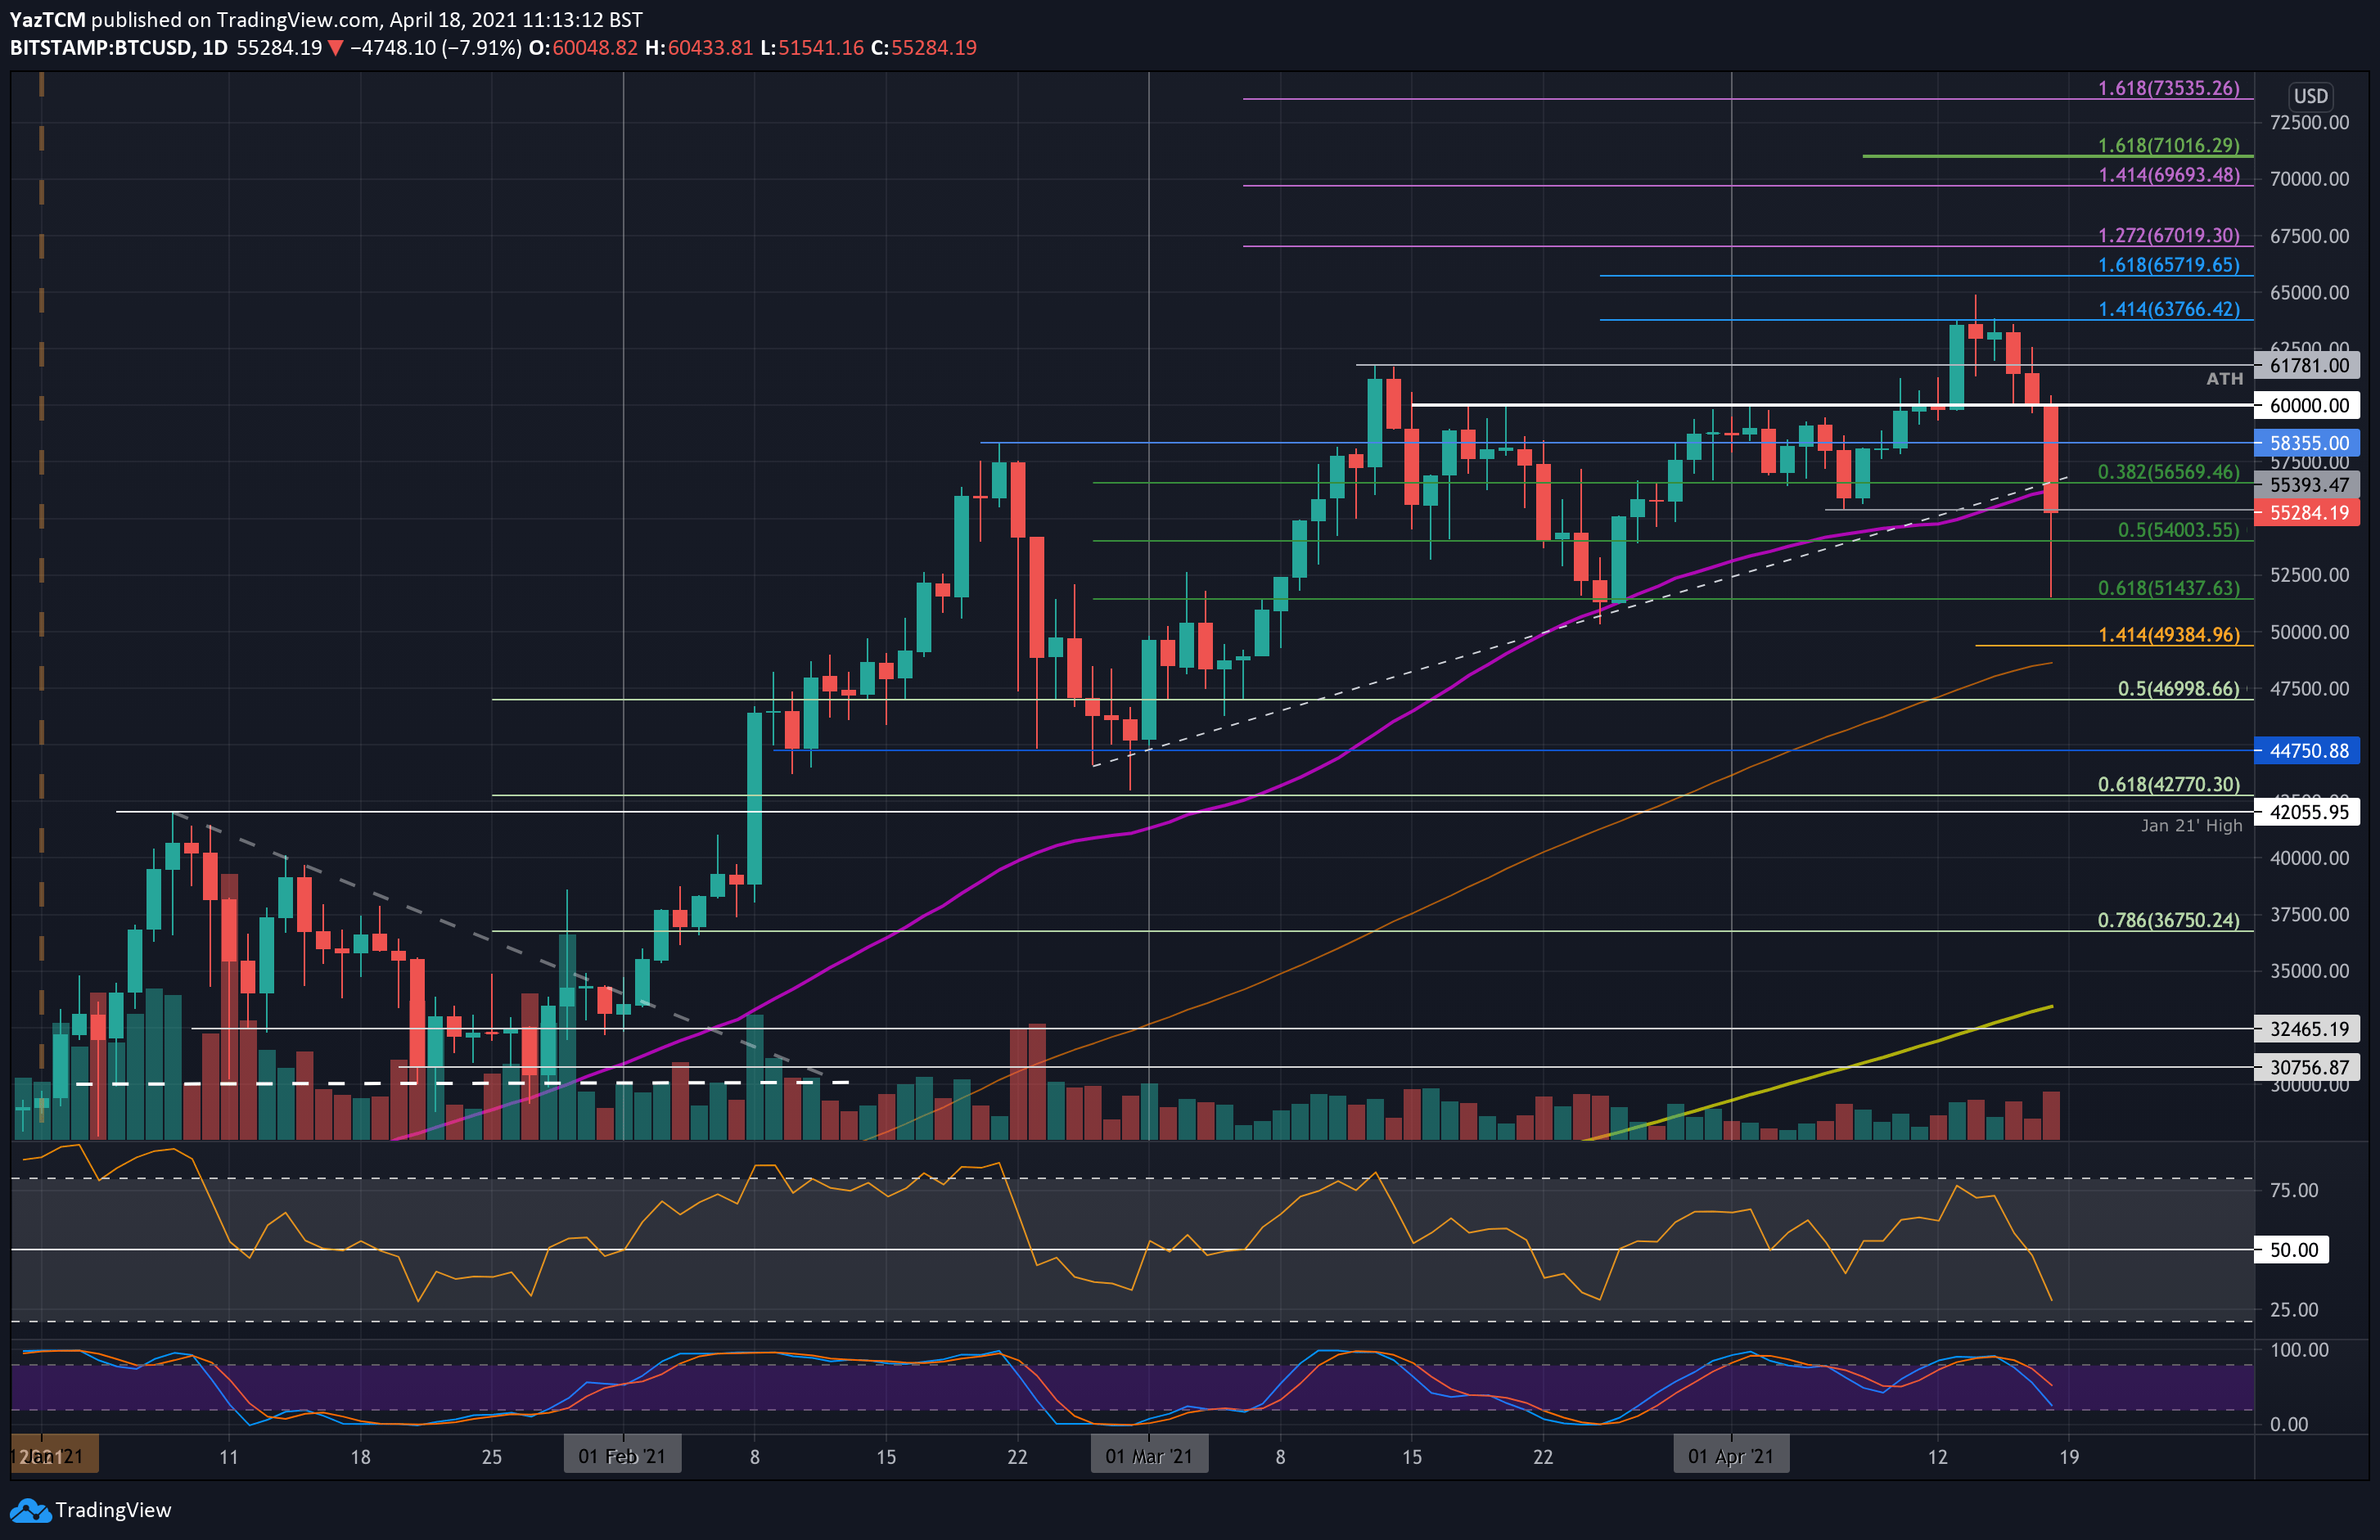
Bitcoin collapsed by almost 15% from today’s $60,000 opening price, reaching as low as $51,540 (as of now). The cryptocurrency had set a new all-time high price earlier in the week at $64,895 but failed to produce a daily closing candle above significant resistance at $63,760.
Together with the bearish divergence that spotted on the 4-hour timeframe, and fundamental rumors and FUD, this resulted in one of the ugliest drops ever. In a matter of minutes, Bitcoin dropped sharply from the $59k area to $51.5k, according to Bitstamp.
The steep price decline found support near a .618 Fib, which allowed the coin to rebound to the current level of around $55,300. It is now trying to gain ground back above $55,400 as it will face the 50-day moving average line at $56,300 as its first major support turned resistance.
Looking ahead, the first level of support lies at $54,00 (.5 Fib). This is followed by today’s low of $51,540 (near the .618 Fib), $50,000, and $49,385 (downside 1.414 Fib Exetnsion). Further support lies at $48,650 (100-days MA), $47,000 (long term .5 Fib), and $44,750.
On the other side, as mentioned above, the first major resistance now lies at $56,300 (50-days MA). This is followed by $58,355, $59,300 (MA-20 and ascending trend-line) before reaching the $60,000 level once again. Further above lies $61,781, $62,500, and $63,766 (1.414 Fib Extension).
Ethereum (ETH) Price Analysis
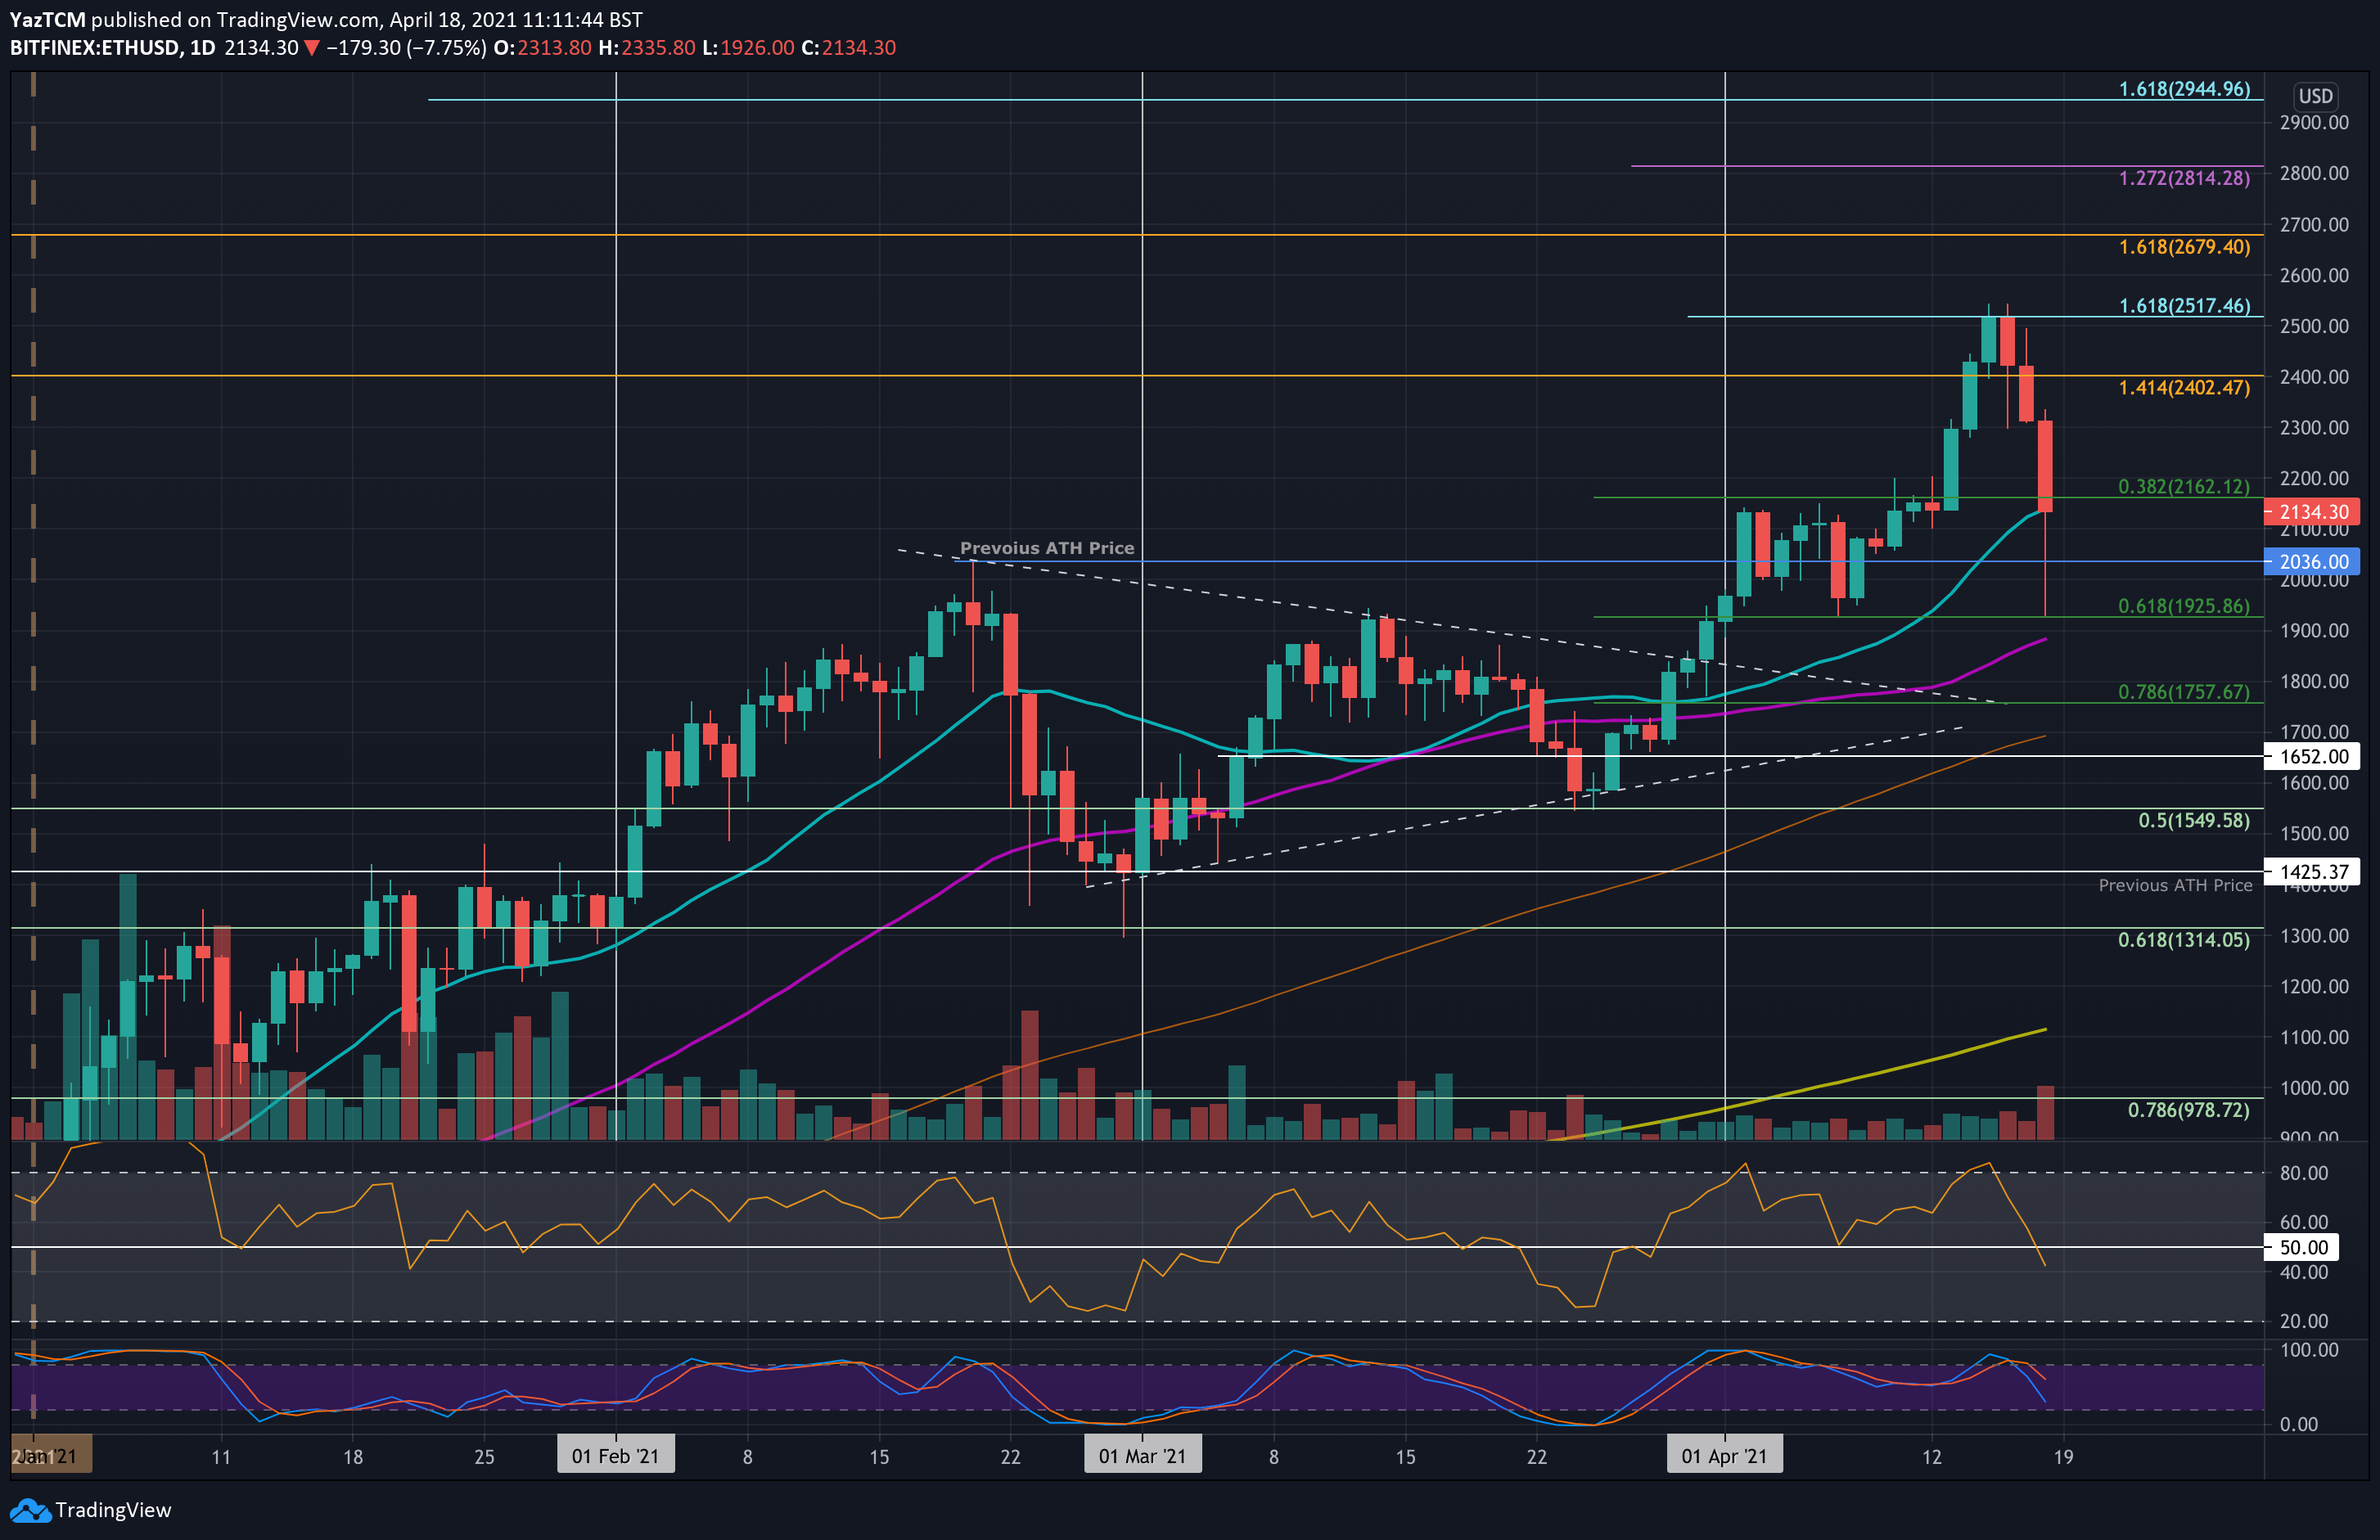
ETH/USD: The Bitcoin price drop also caused a substantial decline in Ethereum as it fell almost 16% from today’s opening price of $2,314 to reach as low as $1,926. There, it found support at a .618 Fib Retracement and has since rebounded higher to the current $2135 level, where it sits at the 20-days MA support turned resistance.
Likewise, Ethereum also produced a new ATH earlier in the week but could not close a daily candle above resistance around $2517 (1.618 Fib Extension).
Moving forward, the first level of support beneath the 20-days EMA lies at $2100. This is followed by $2000, $1926 (.618 Fib), $1885 (50-days MA), and $1758 (.786 Fib).
On the other side, the first resistance lies at $2200. This is followed by $2300, $2400, $2517 (1.618 Fib Extension), and $2600.
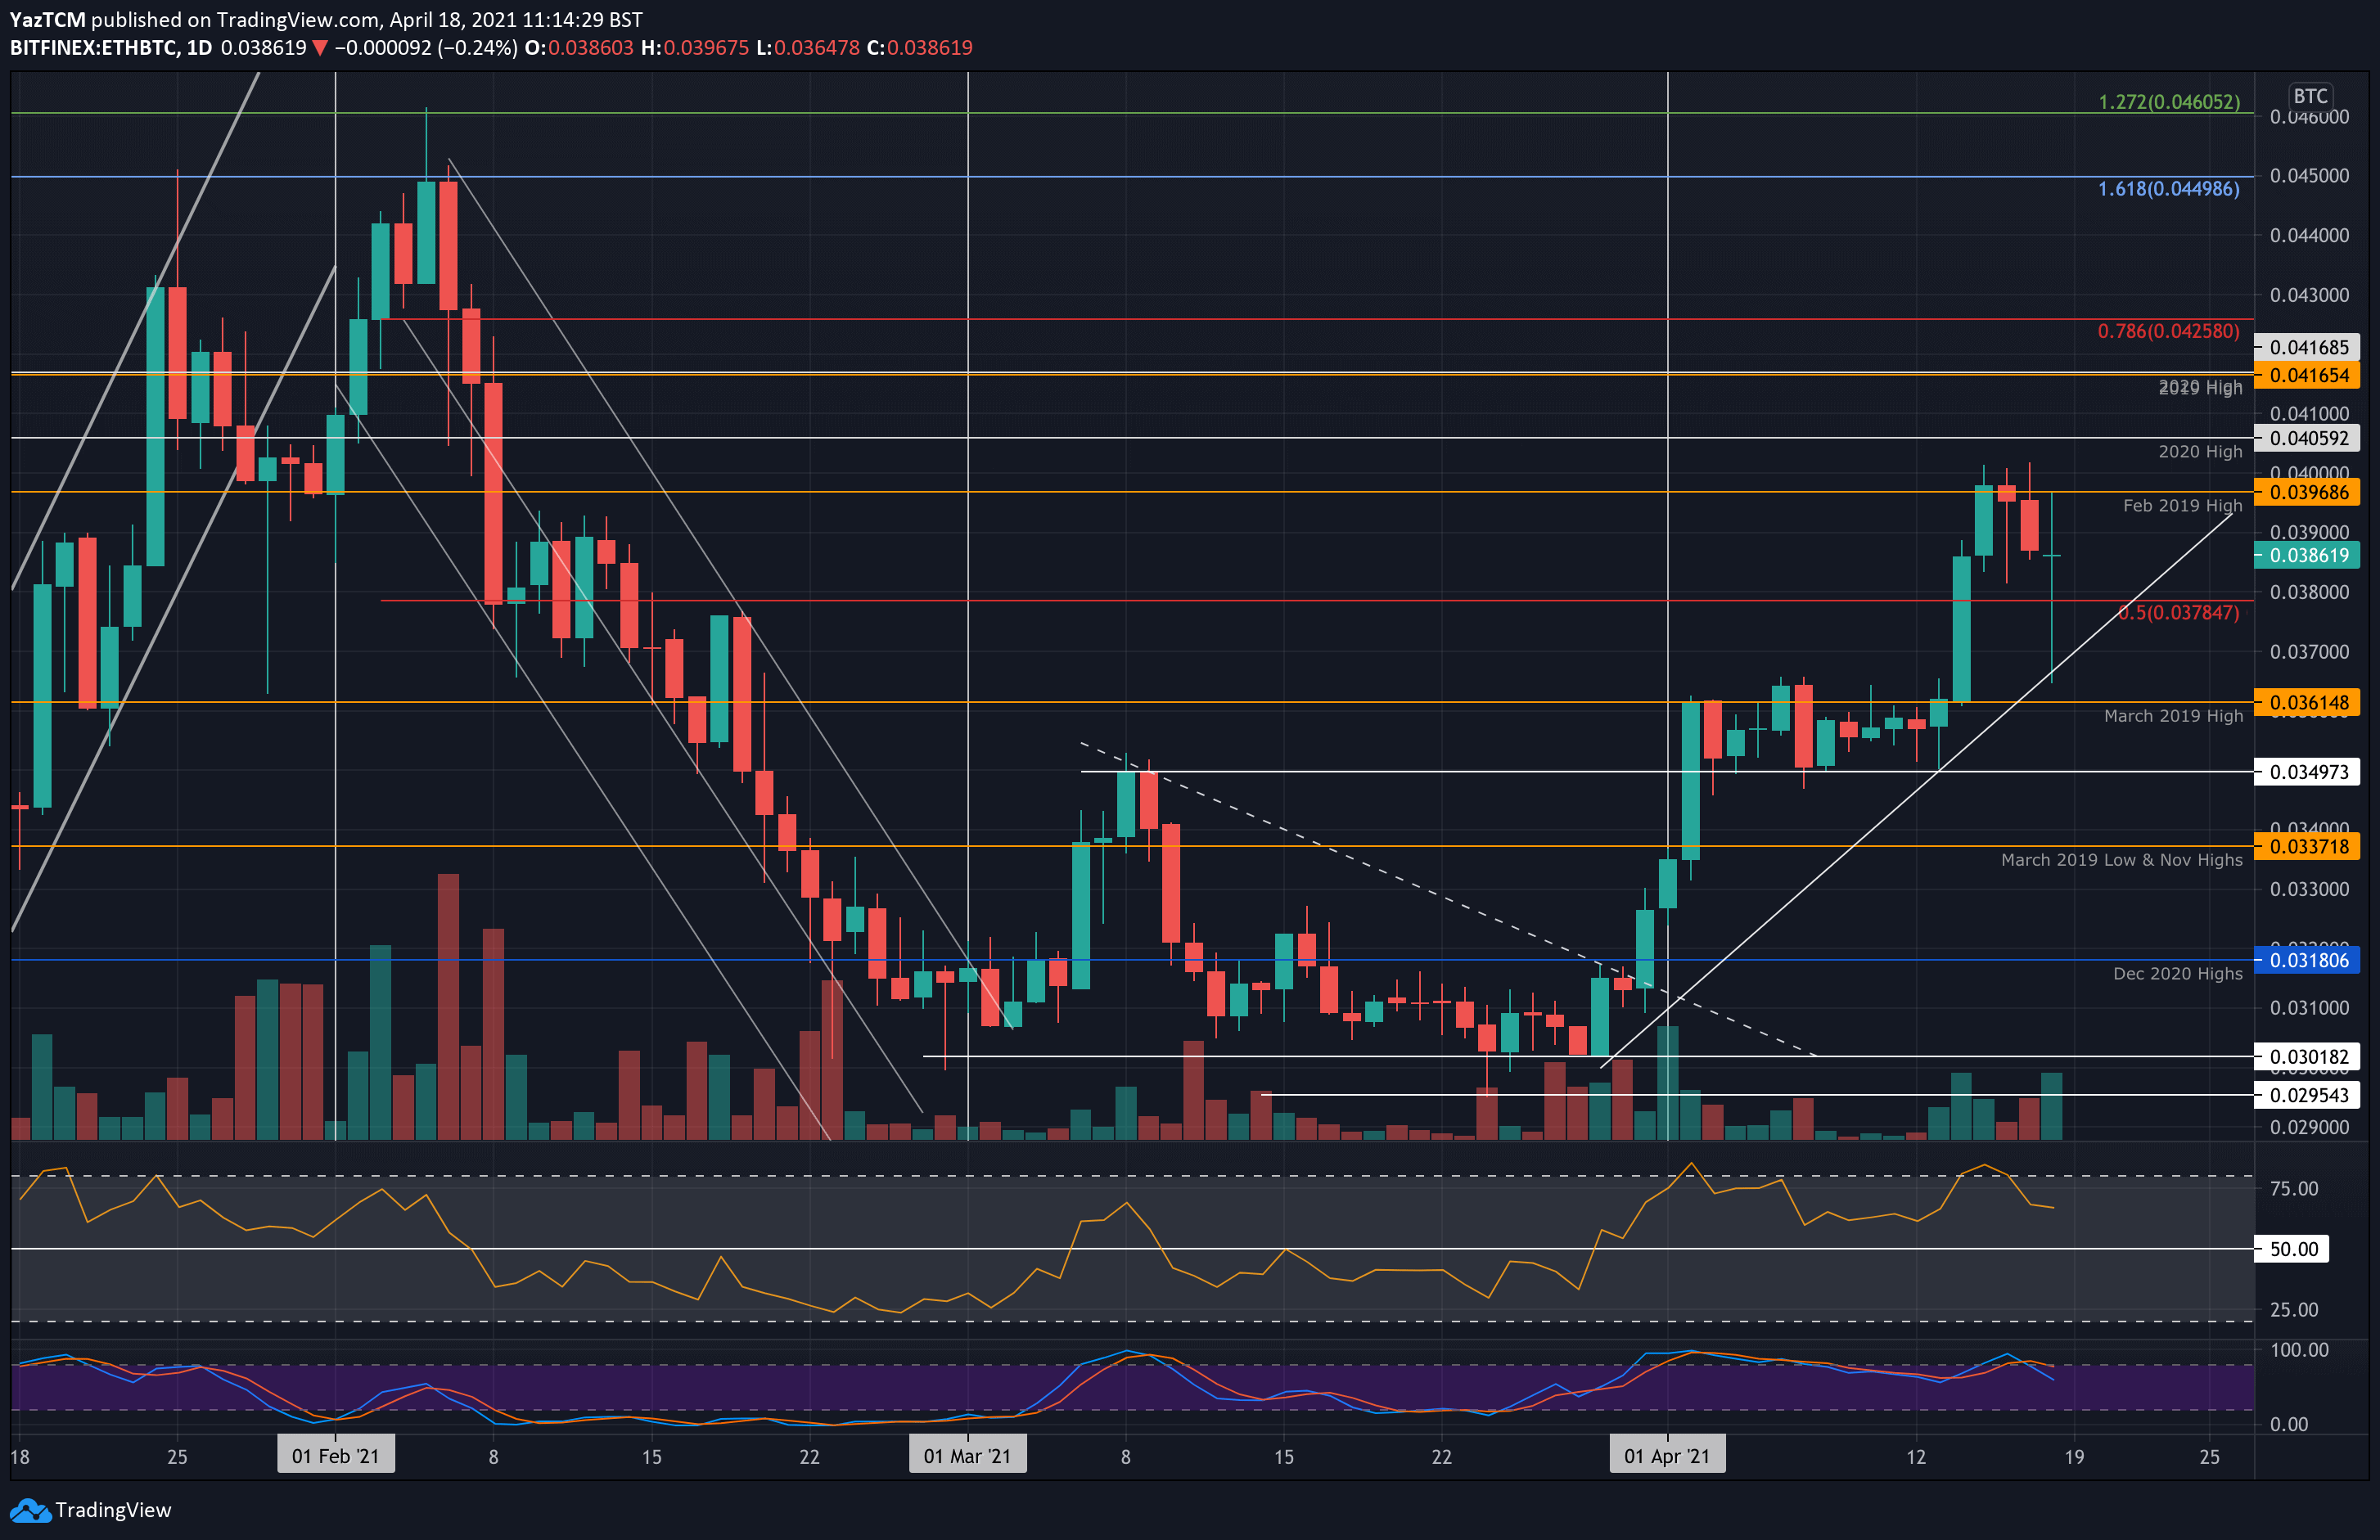
ETH/BTC: Etheruem dropped by a steep 6% against Bitcoin, however, ETH/BTC was able to recover most of the drop (as of now). ETH had plummeted beneath 0.037 BTC to reach as low as 0.0365 BTC. There, it found support at a short-term ascending trend line and rebounded.
Looking ahead, the first resistance lies at 0.039 BTC. This is followed by 0.0396 BTC (Feb 2019 Highs), 0.0405 BTC (2020 highs), and 0.0416 BTC (2019 Highs).
On the other side, the first major support lies at 0.038 BTC. This is followed by 0.0365 BTC (ascending trend line and today’s low), 0.0361 BTC (March 2019 Highs), 0.035 BTC, and 0.0337 BTC (Nov 2020 highs).
Ripple (XRP) Price Analysis
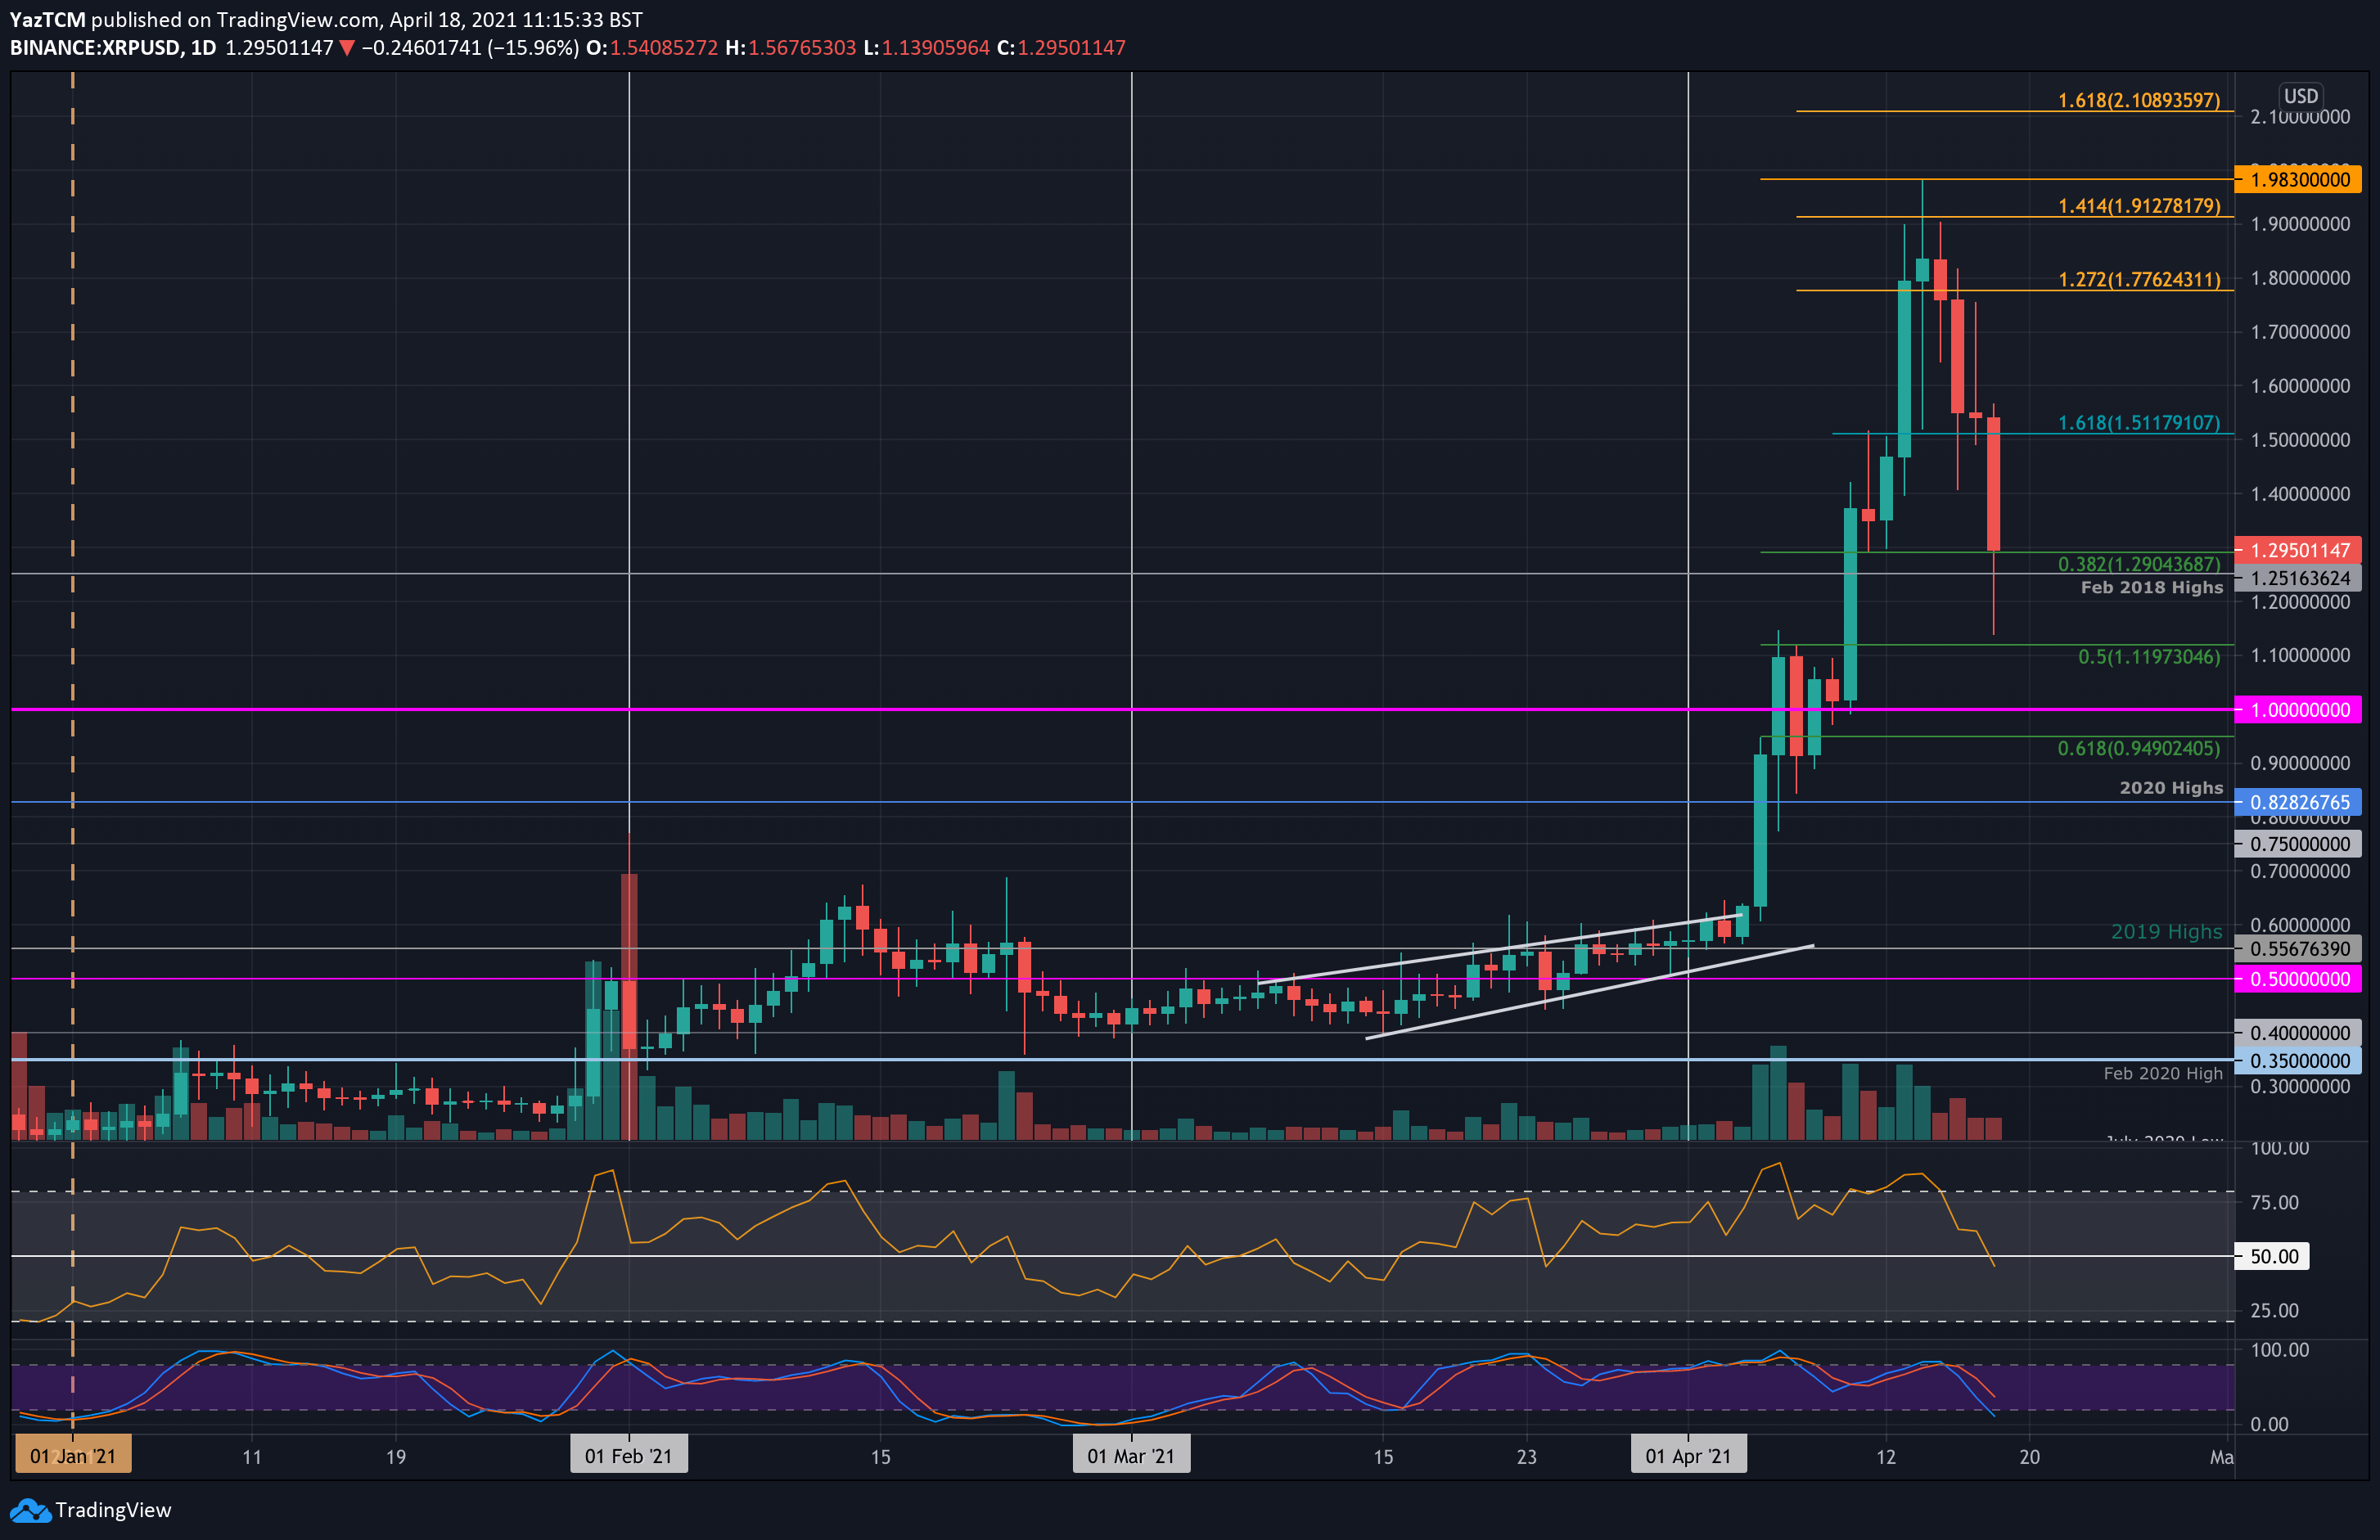
XRP/USD: Ripple fell by a precipitous 26% from today’s opening price of $1.54 to drop as low as $1.13. There, it found support at a 20-days MA level and started to recover quickly. So far, it has managed to climb back above the Feb 2018 highs at $1.25 to reach the $1.29 support provided by a .382 Fib.
Moving forward, if the bears push back beneath $1.29 and $1.25, the first support lies at today’s low of $1.13. This is followed by $1.00, $0.95 (.618 Fib)m $0.828 (2020 highs), and $0.75.
On the other side, the first resistance lies at $1.40. This is followed by $1.50, $1.77 (1.272 Fib Extension), $1.91 (1.414 Fib Extension), and $1.98 (April highs).
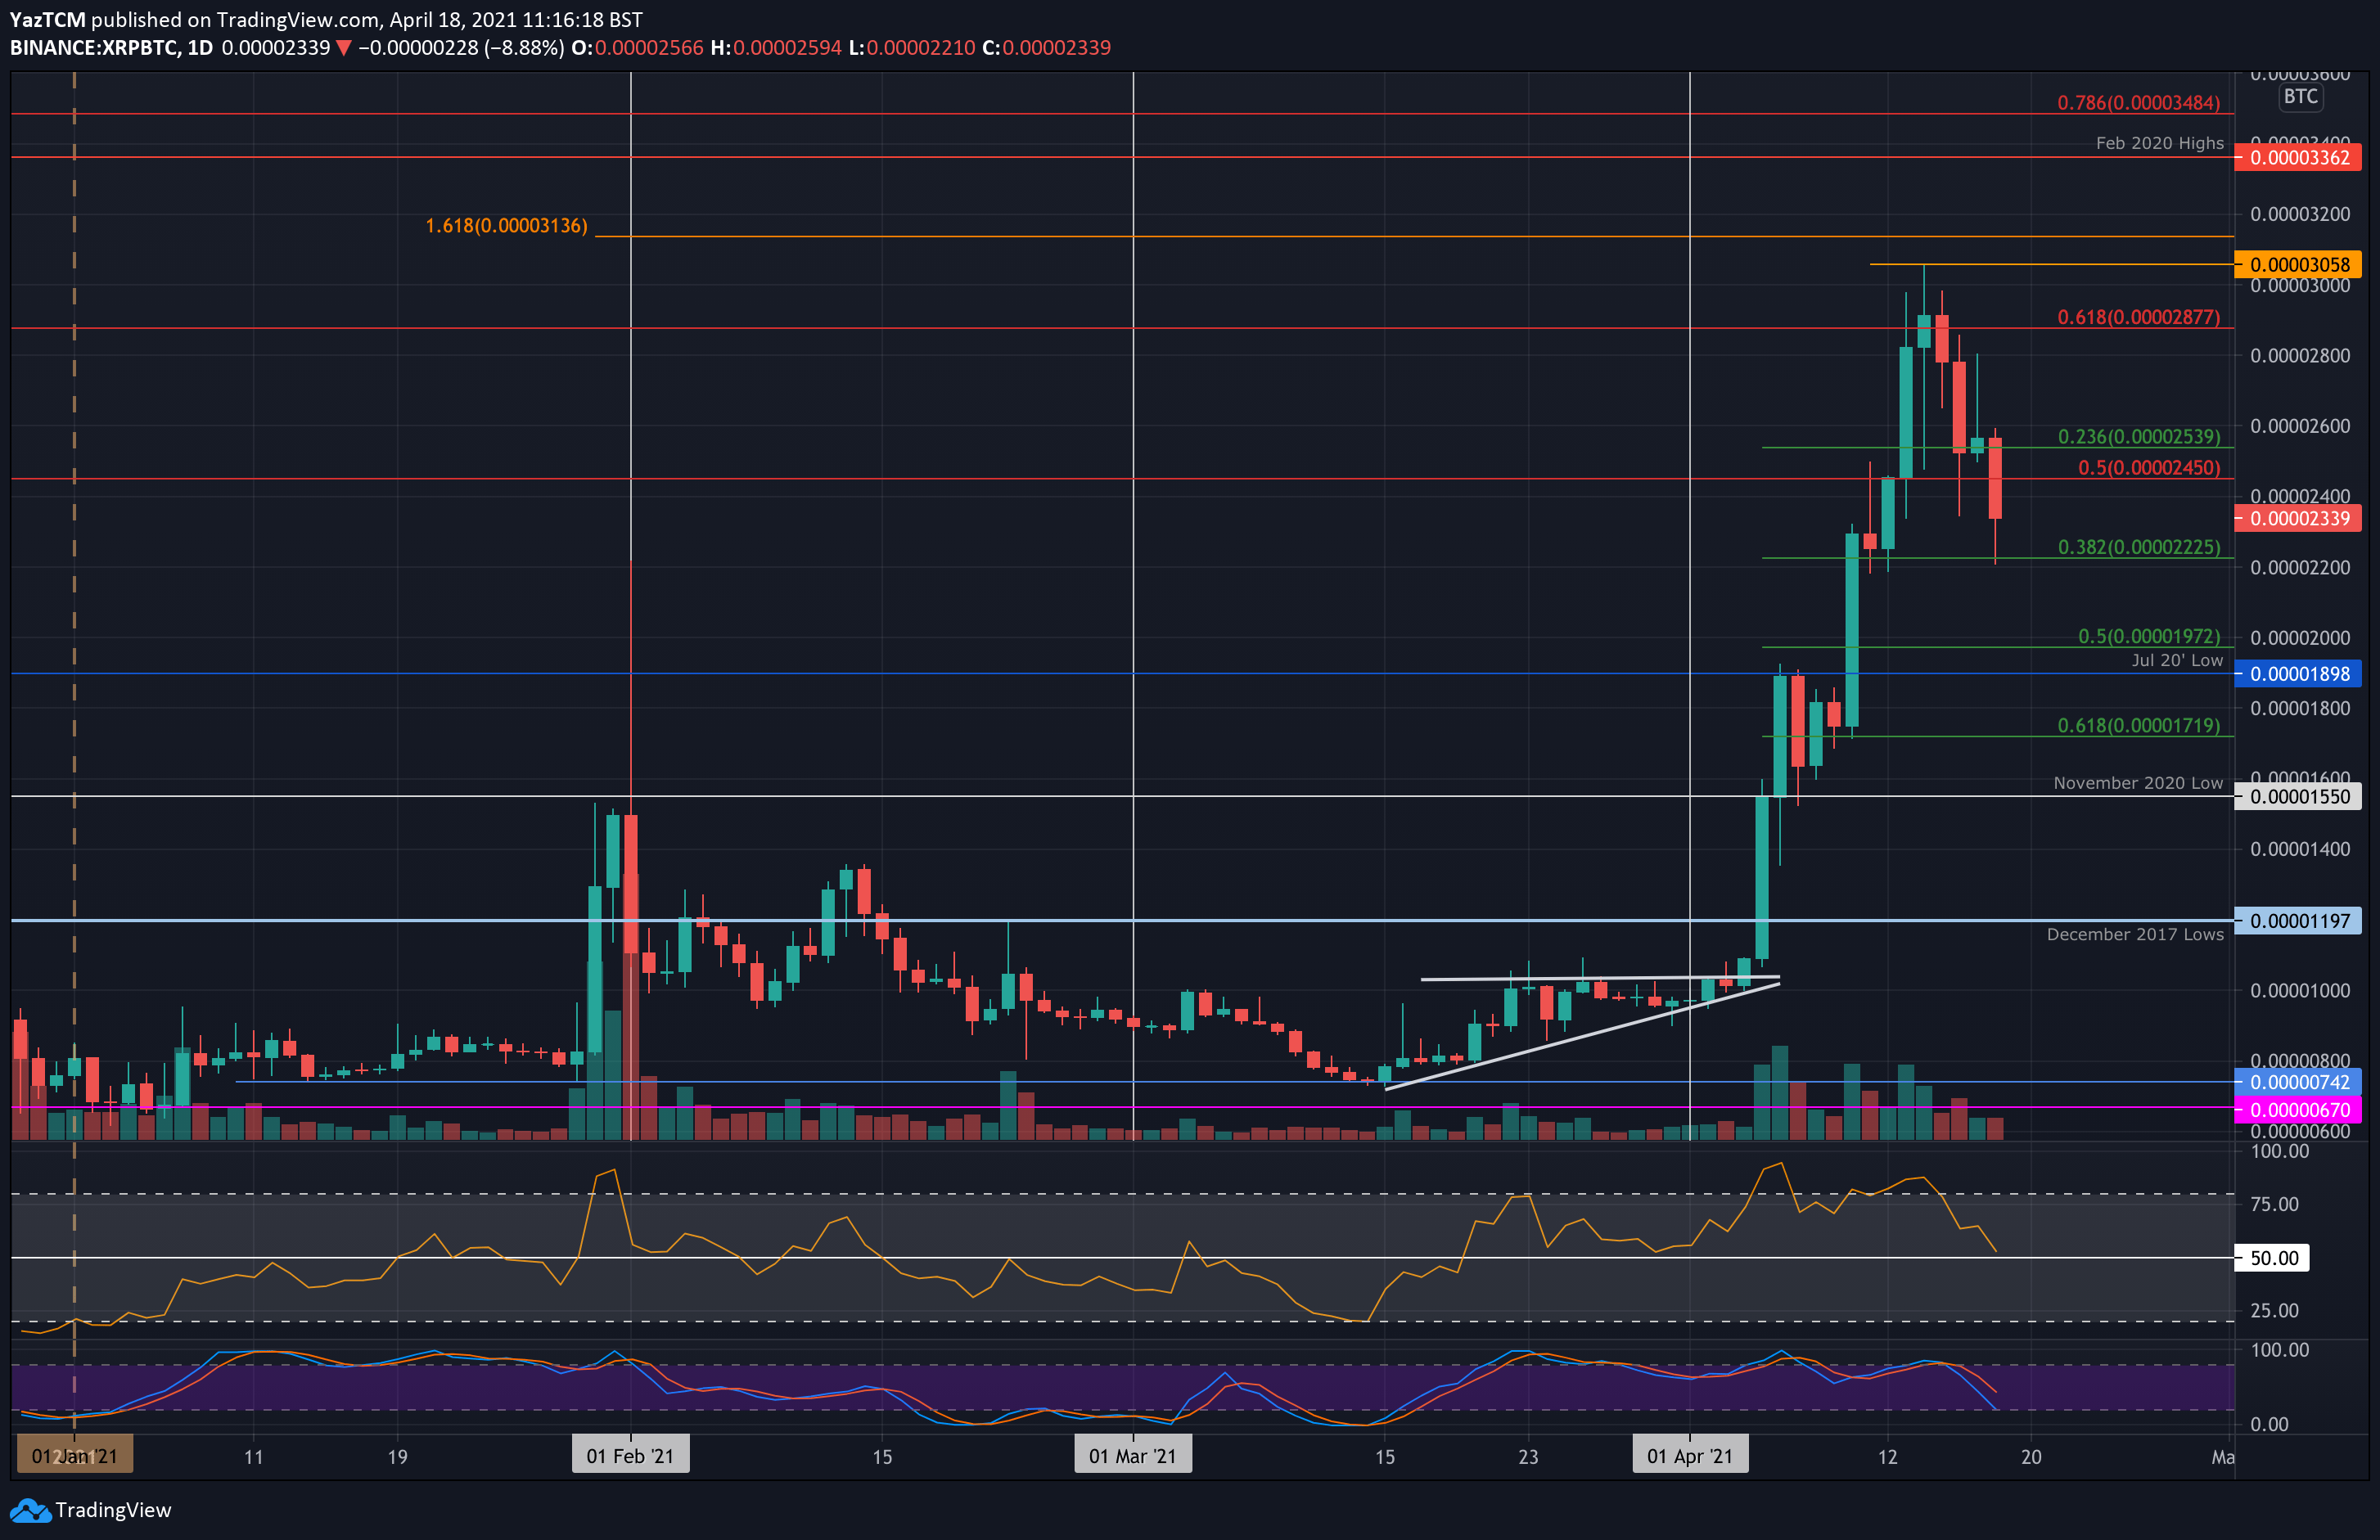
XRP/BTC: Against Bitcoin, XRP fell by a sharp 13% as it dropped from over 2550 SAT to reach as low as 2200 SAT (.382 Fib). It has since bounced higher from there as it battles to get back toward 2340 SAT.
XRP had set a new 2021 high earlier in the week at 3058 SAT. Unfortunately, it was unable to close a daily candle above 3000 SAT and has been falling lower since.
Looking ahead, the first support lies at 2200 SAT. This is followed by 2000 SAT, 1900 SAT (July 2020 low), 1800 SAT, and 1720 SAT (.618 Fib).
On the other side, the first resistance lies at 2450 SAT (bearish .5 Fib). This is followed by 2600 SAT, 2800 SAT, 3000 SAT, and 3135 SAT.