This week was undoubtedly bullish in the cryptocurrency market. The major coins saw serious increases. The same is true for small-cap cryptocurrencies, as the notion of a booming altcoin season is strengthening. Bitcoin Bitcoin is up by a strong 15.8% this week as the cryptocurrency starts to push back toward the ,000 level. It found support at the 50-day MA last week, at around ,200, and started to rebound. Throughout the course of the week, Bitcoin managed to push higher as it broke above ,000 and the 50-day MA on Monday. It continued increasing until reaching as high as ,100 today. It has since dropped slightly as it trades around ,550. Looking ahead, once Bitcoin reclaims ,000, the first level of resistance will be located at the ATH price of
Topics:
Yaz Sheikh considers the following as important: ADABTC, ADAUSD, Binance Coin (BNB) Price, Bitcoin (BTC) Price, BNBBTC, bnbusd, BTC Analysis, BTCEUR, BTCGBP, btcusd, btcusdt, Cardano (ADA) Price, DOTBTC, DOTUSD, DOTUSDT, ETH Analysis, ETHBTC, Ethereum (ETH) Price, ethusd, Price Analysis, Ripple (XRP) Price, XRP Analysis
This could be interesting, too:
Mandy Williams writes Bitcoin ETFs Record Over .6B in Outflows in the Past 2 Weeks
Dimitar Dzhondzhorov writes Millions of ADA Sold by Cardano Whales During Market Crash – Will the Decline Continue?
Chayanika Deka writes Bitcoin Whales Offload 6,813 BTC as Selling Pressure Mounts
Wayne Jones writes Bitcoin Sentiment Hits 2022 Lows as Fear & Greed Index Falls to 10
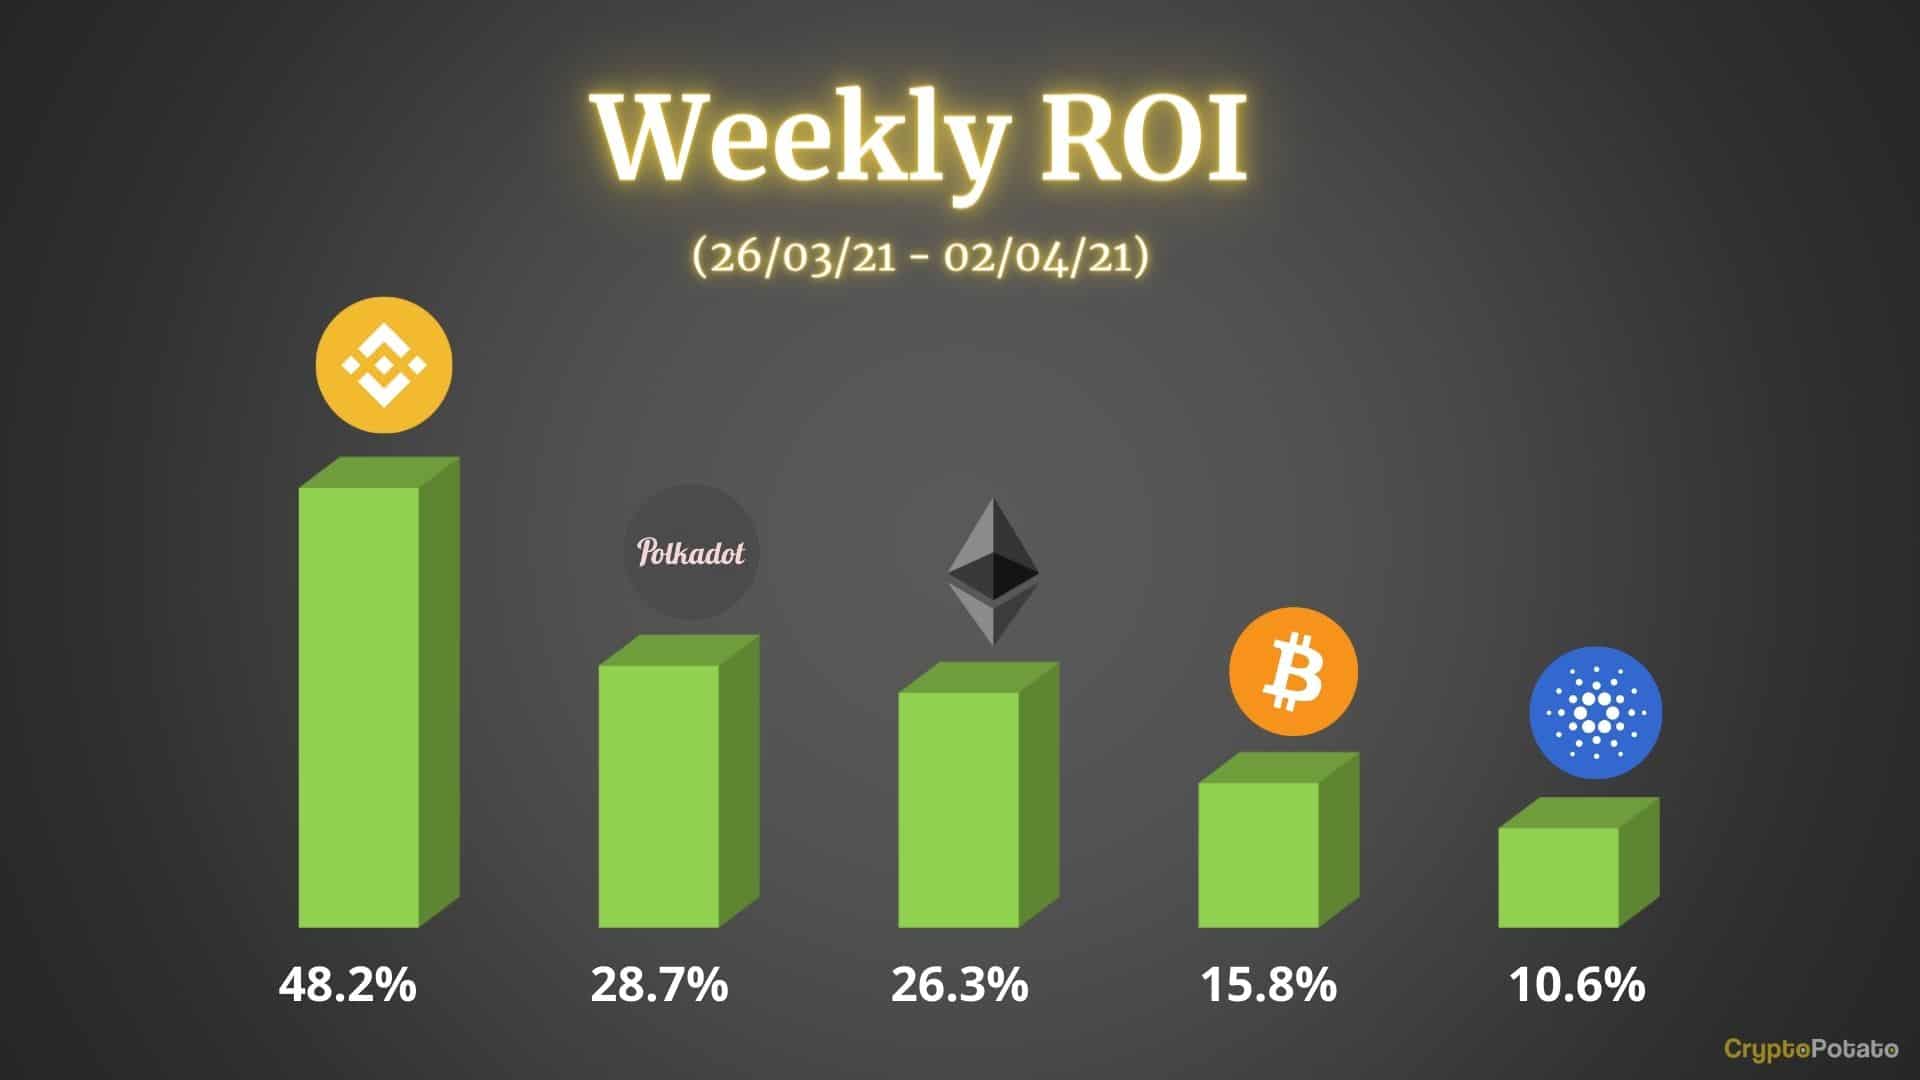
This week was undoubtedly bullish in the cryptocurrency market. The major coins saw serious increases. The same is true for small-cap cryptocurrencies, as the notion of a booming altcoin season is strengthening.
Bitcoin
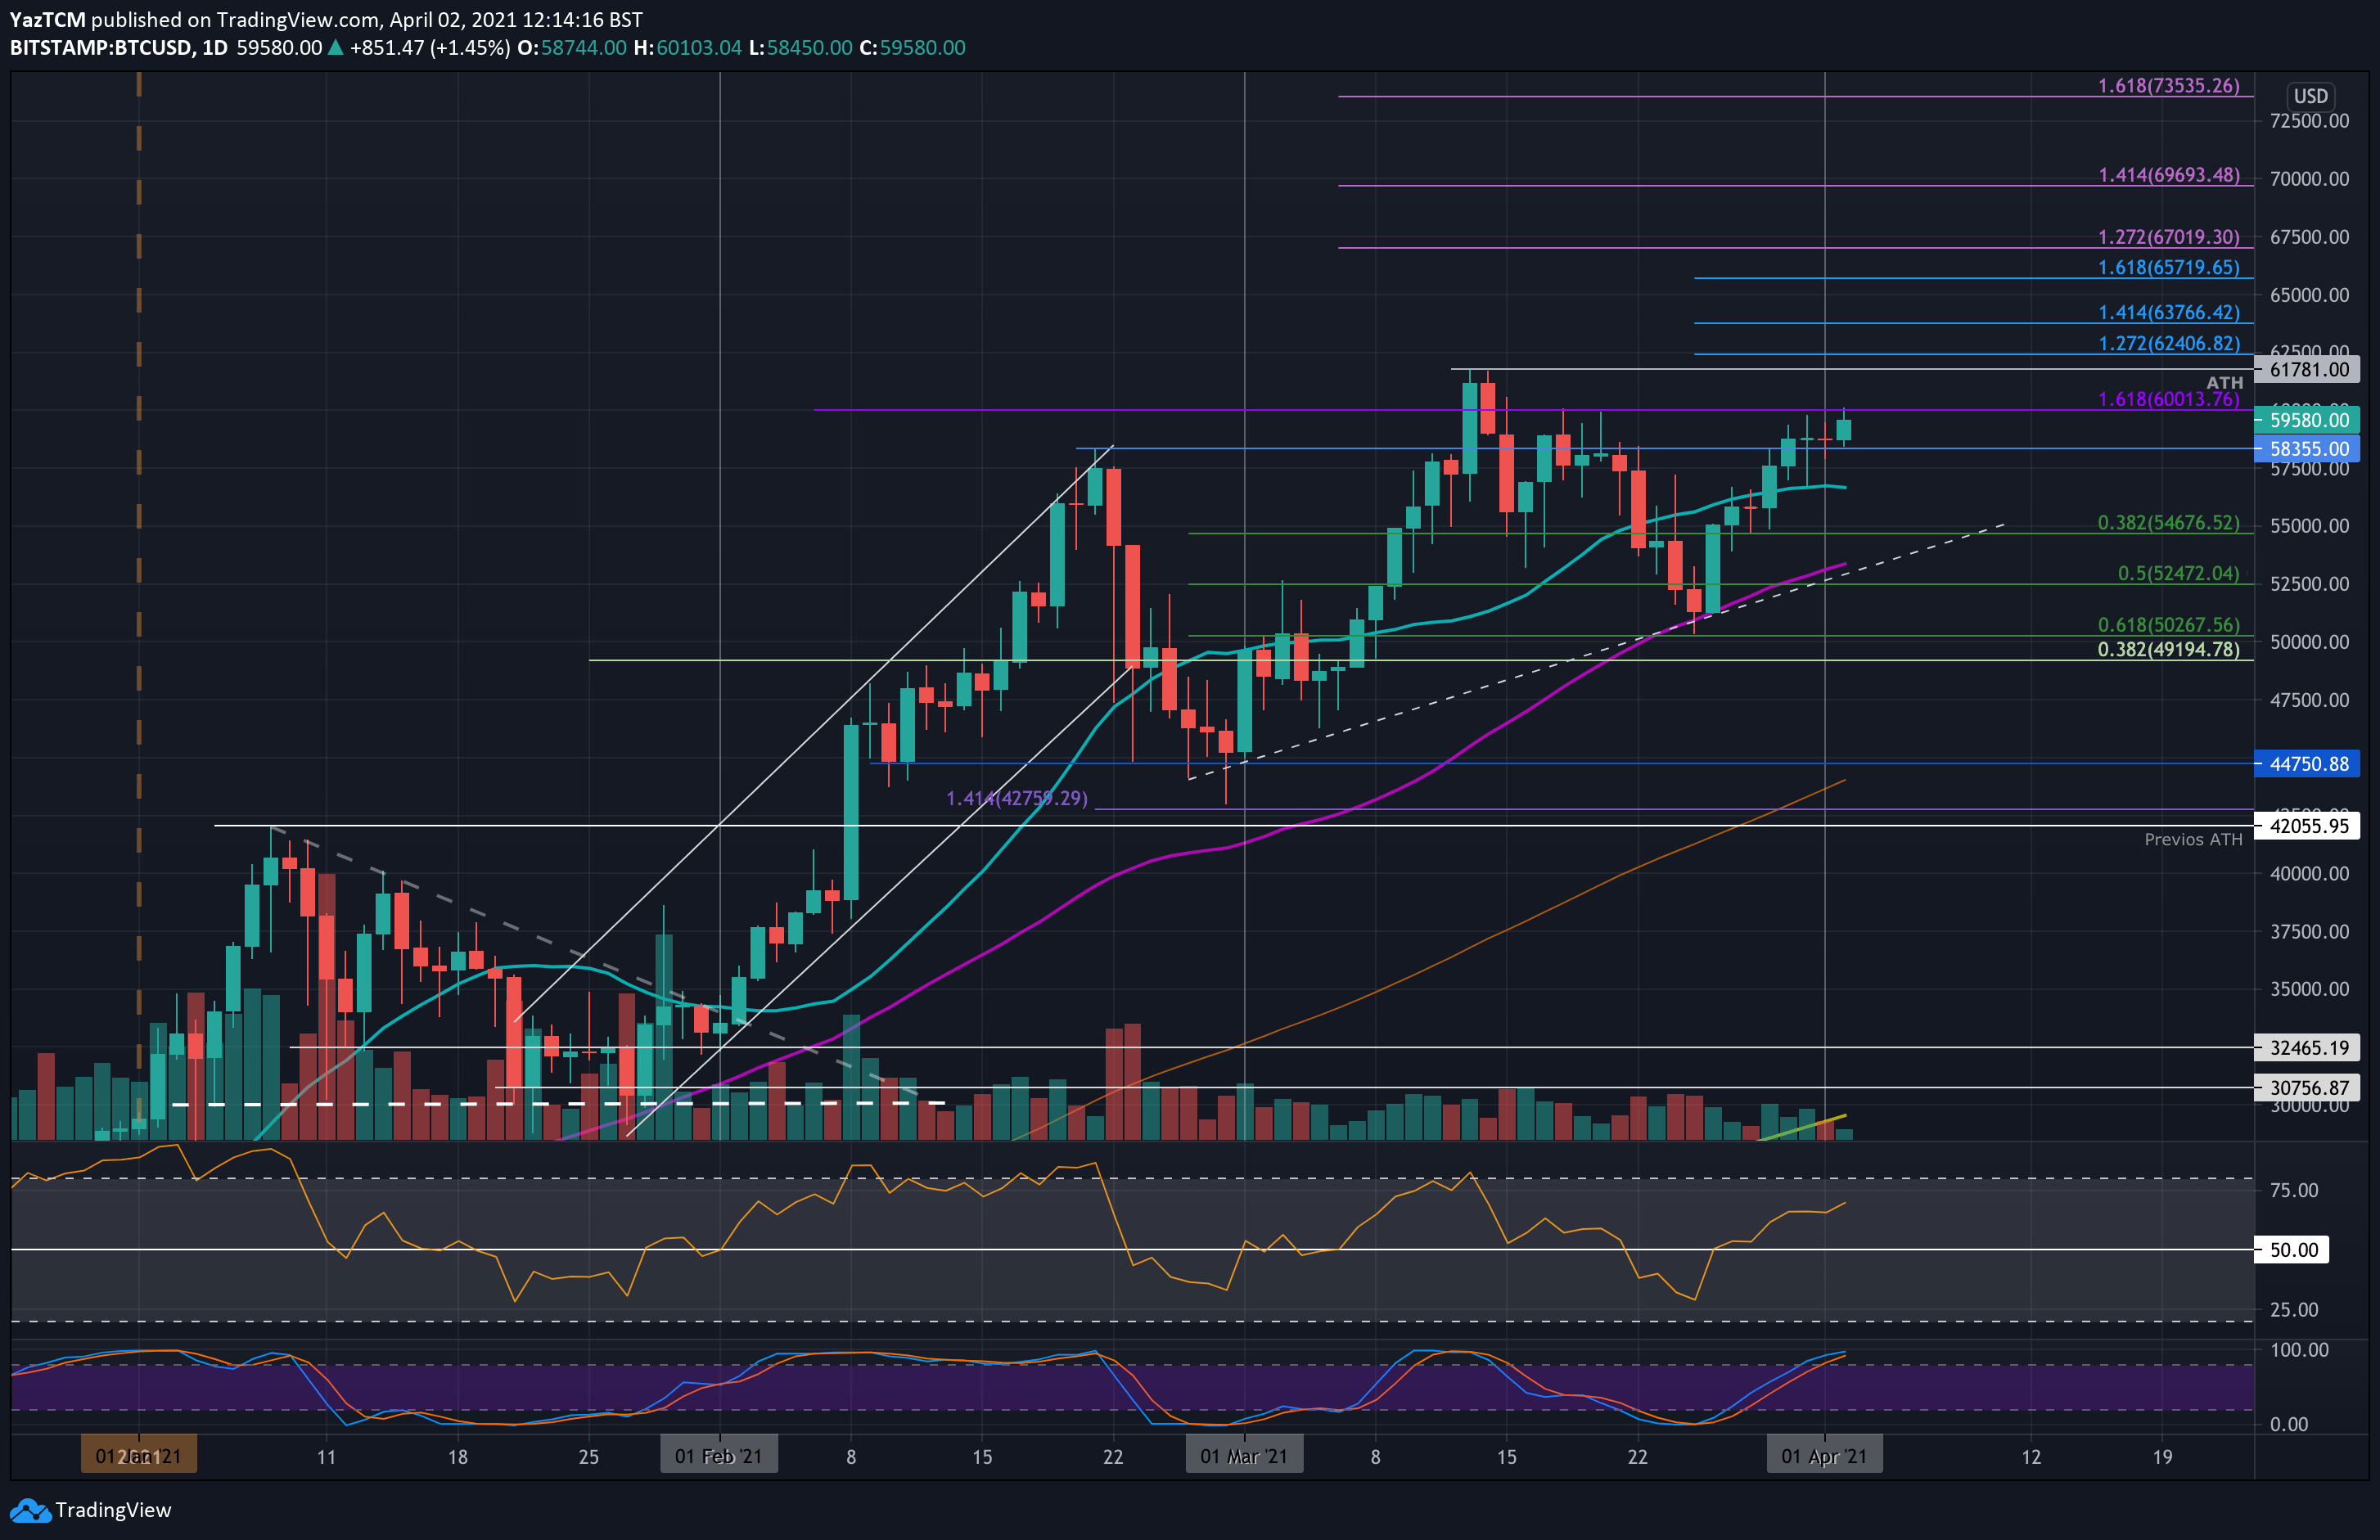
Bitcoin is up by a strong 15.8% this week as the cryptocurrency starts to push back toward the $60,000 level. It found support at the 50-day MA last week, at around $50,200, and started to rebound.
Throughout the course of the week, Bitcoin managed to push higher as it broke above $55,000 and the 50-day MA on Monday. It continued increasing until reaching as high as $60,100 today. It has since dropped slightly as it trades around $59,550.
Looking ahead, once Bitcoin reclaims $60,000, the first level of resistance will be located at the ATH price of $61,780. Beyond the ATH, resistance lies at $62,400 (1.272 Fib Extension), $63,766 (1.414 Fib Extension), $65,000, and $65,720 (1.618 Fib Extension).
On the other side, the first support lies at $58,355. This is followed by $57,500, $56,600 (20-day MA), $54,675 (.382 Fib), and $52,470 (.5 Fib).
Ethereum
Ethereum saw a stronger 26.3% price hike this week as it makes its way back toward $2000. The cryptocurrency was trading inside a short-term symmetrical triangle pattern at the beginning of the week as it rebounded from the lower boundary at around $1600.
On Monday, ETH managed to push above the 50-day MA to reach the upper boundary of the triangle. It was finally penetrated on Wednesday, and ETH continued above the March highs of $1944 yesterday. Today, it increased beyond $1960 to breach $2000, where it currently trades.
Looking ahead, the first level of resistance lies at the ATH price of $2056. This is closely followed by $2060 (1.414 Fib Extension – blue), $2100, and $2140 (1.272 Fib Extension). Added resistance lies at $2210 (1.414 Fib Extension) and $2300 (1.618 Fib Extension).
On the other side, the first level of support lies at $1960. This is followed by $1900, $1830 (.382 Fib), $1740 (50-day MA), and $1650.

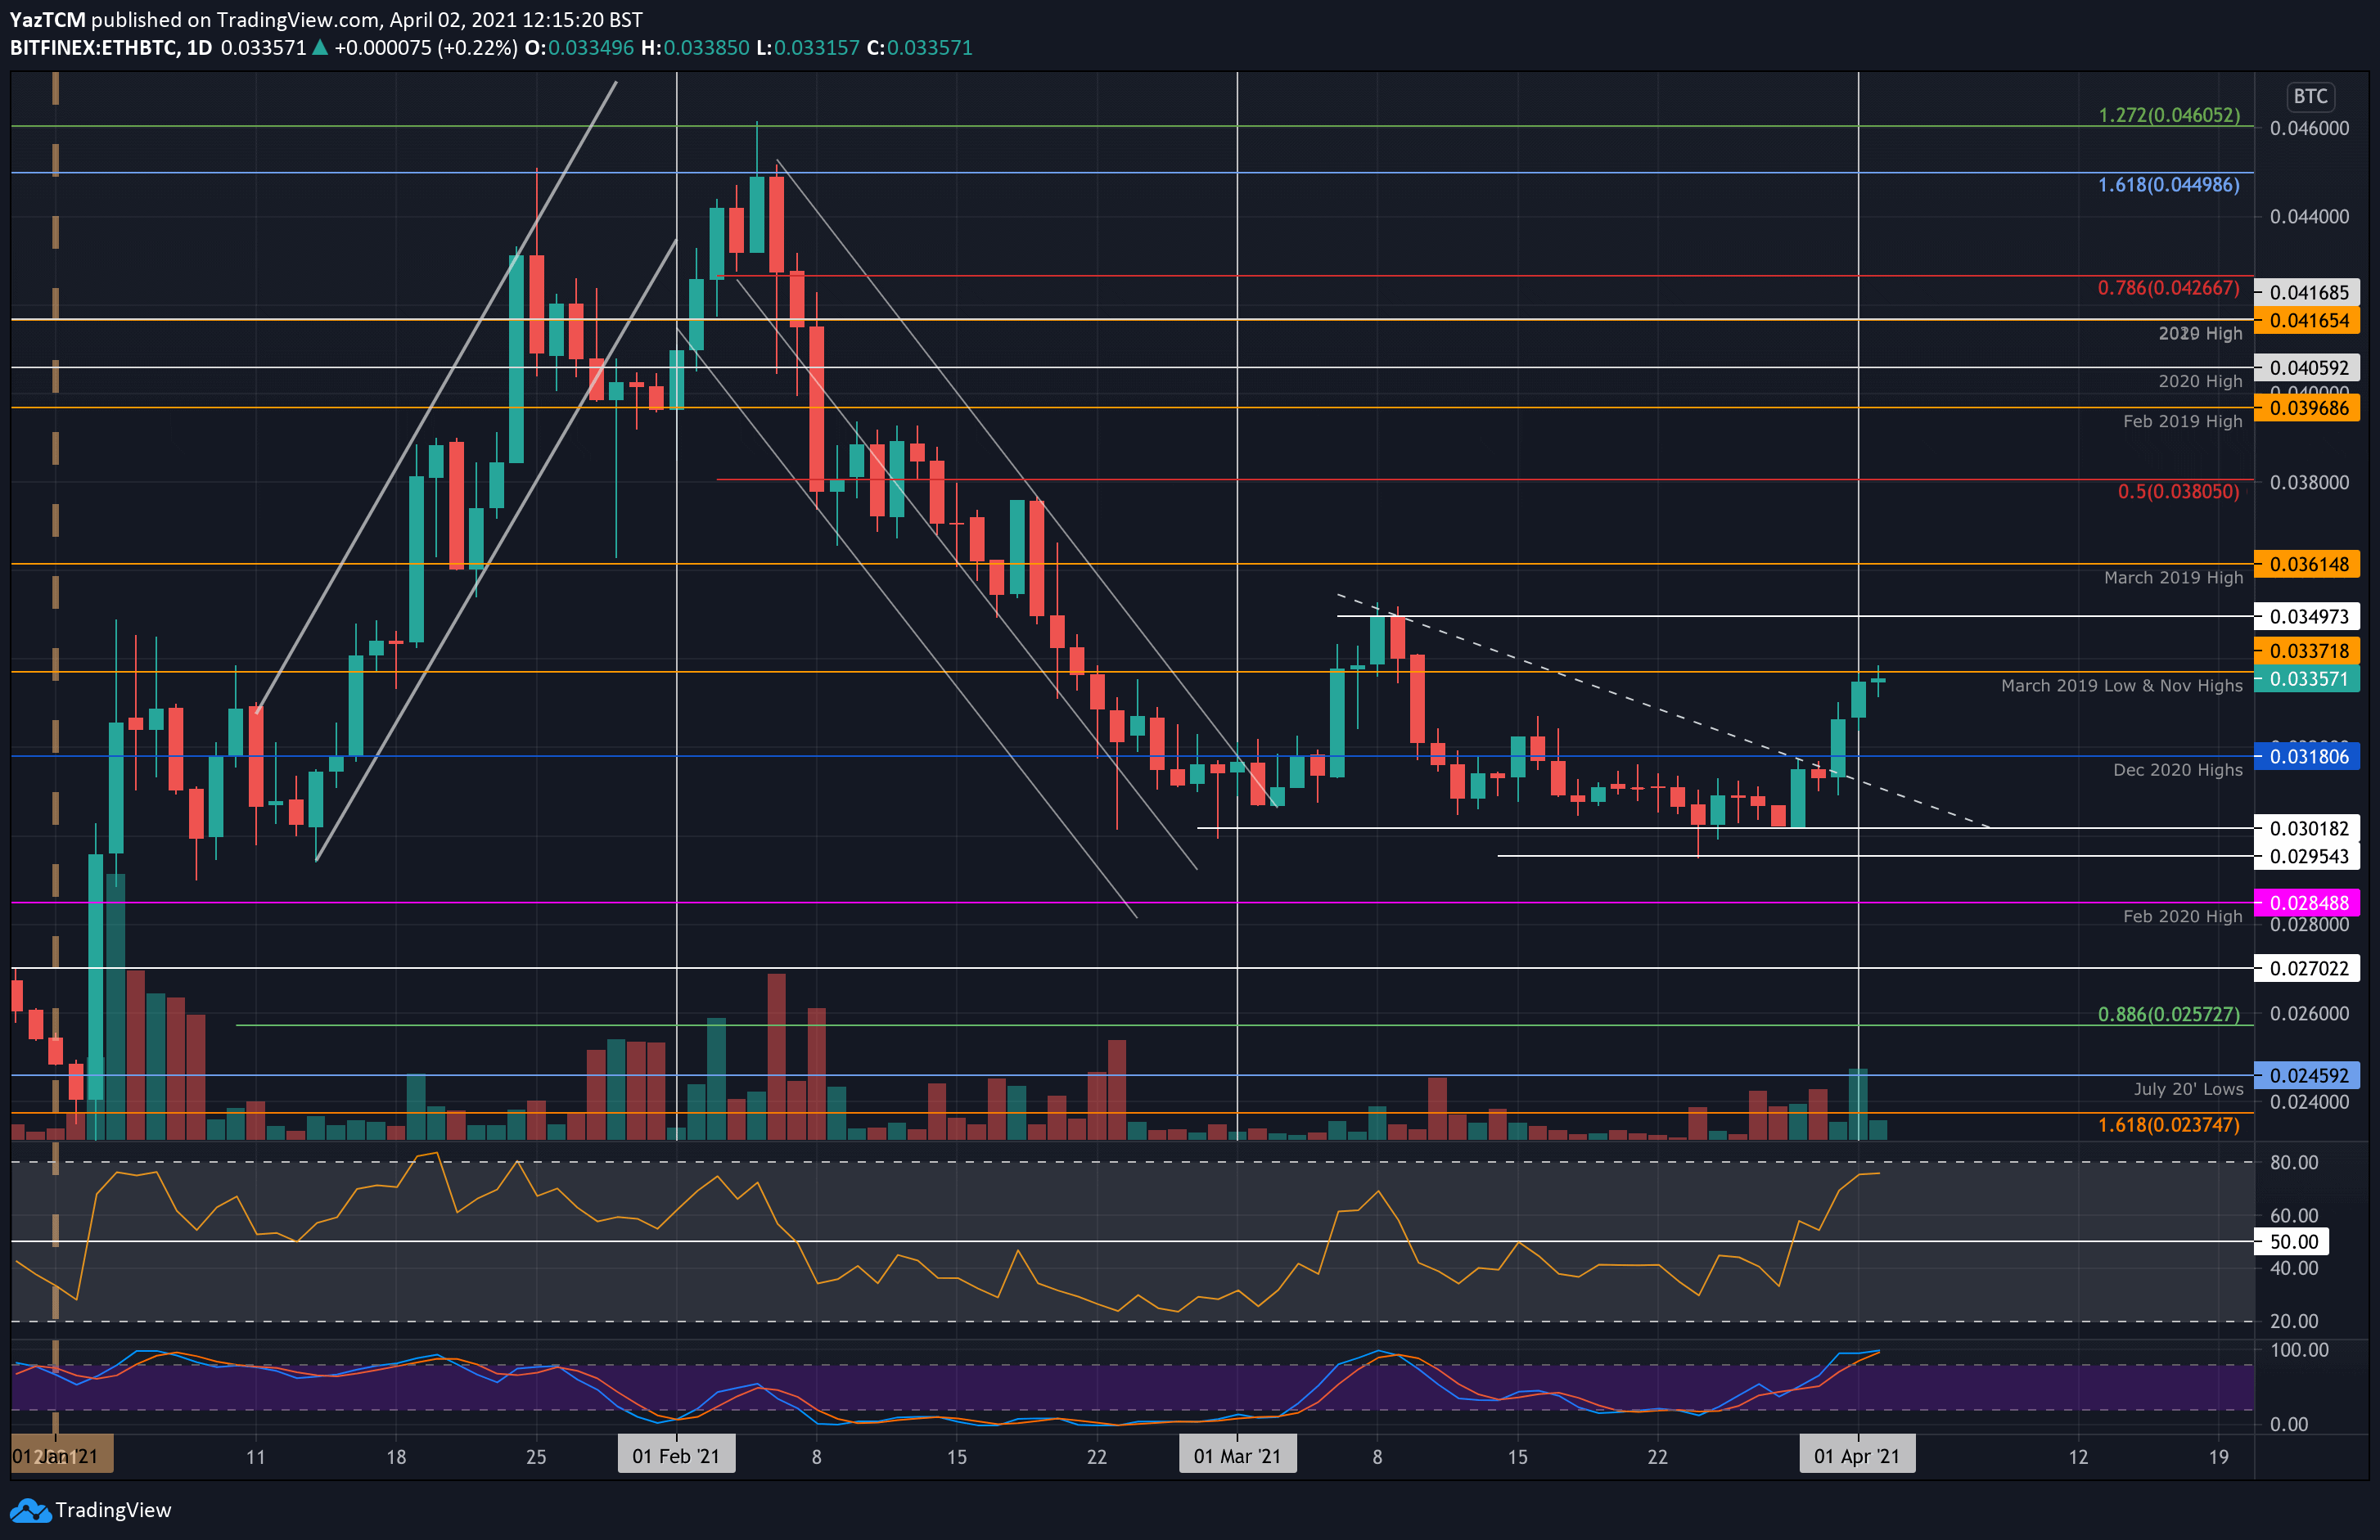
Ethereum also started to perform well against Bitcoin. For the majority of the month, ETH had been struggling against BTC but managed to find support at 0.03 BTC, forming the floor of a descending triangle pattern.
This triangle was penetrated on Wednesday when Ethereum managed to break past the December 2020 highs at 0.0318 BTC. Since then, ETH crept higher to reach the current resistance around 0.0337 BTC, provided by the November 2020 highs.
Looking ahead, once the buyers break 0.0337 BTC, the first level of resistance lies at 0.035 BTC (March 2021 resistance). This is followed by 0.0361 BTC (March 2019 highs), 0.0385 BTC (bearish .5 Fib Retracement), and 0.0396 BTC (Feb 2019 Highs).
On the other side, the first support lies at 0.033 BTC. This is followed by 0.0318 BTC (December 2020 Highs), 0.03 BTC, and 0.0295 BTC.
Binance Coin
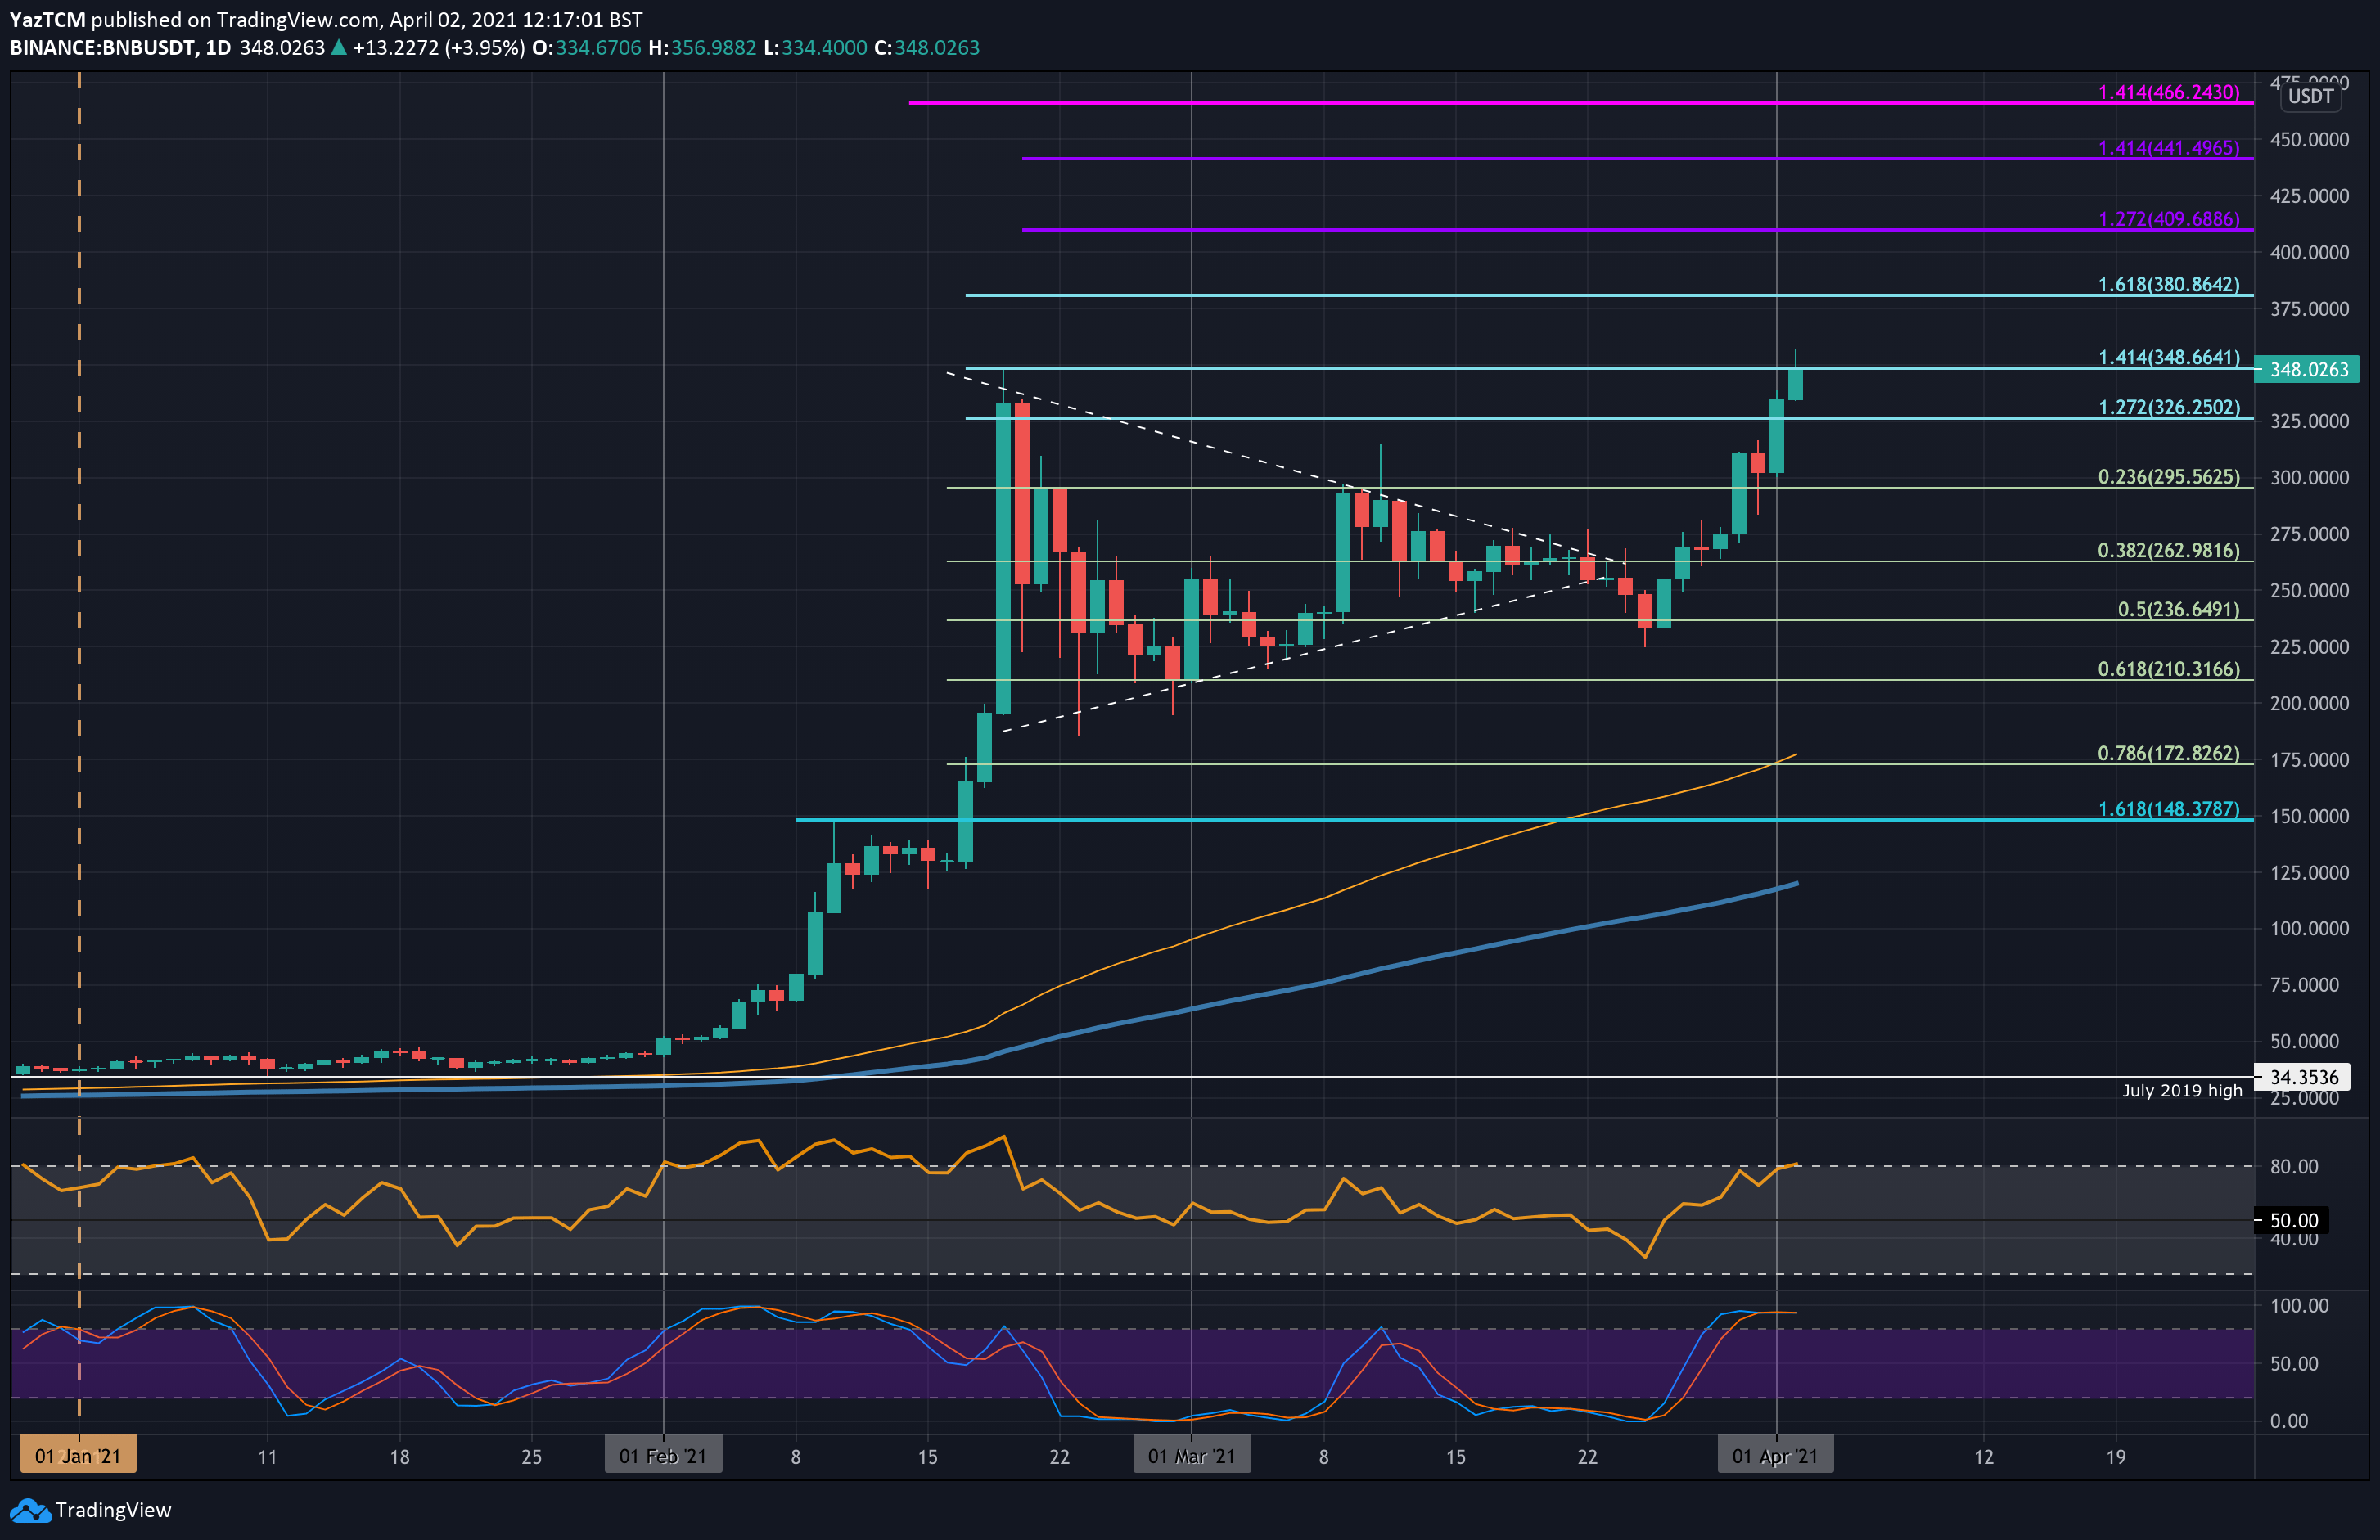
BNB is up by a whopping total of 48.2% over the past week as it currently battles the $348.66 resistance. It created a fresh ATH price today of $357 but seems is showing some weakness at a 1.414 Fib Extension, where it currently trades.
The coin rebounded from $235 at the start of the week and had been pushing higher ever since. It managed to create a fresh high-day closing price on Tuesday and continued upward from there to make the new ATH today.
Looking ahead, once the buyers break $348 and $350, the first level of strong resistance lies at $380 (1.618 Fib Extension – blue). This is followed by $400, $410, $425, and $440 (1.414 Fib Extension).
On the other side, the first support lies at $326. This is followed by $300 (.236 Fib), $263 (.382 Fib), $250, and $236.65 (.5 Fib).
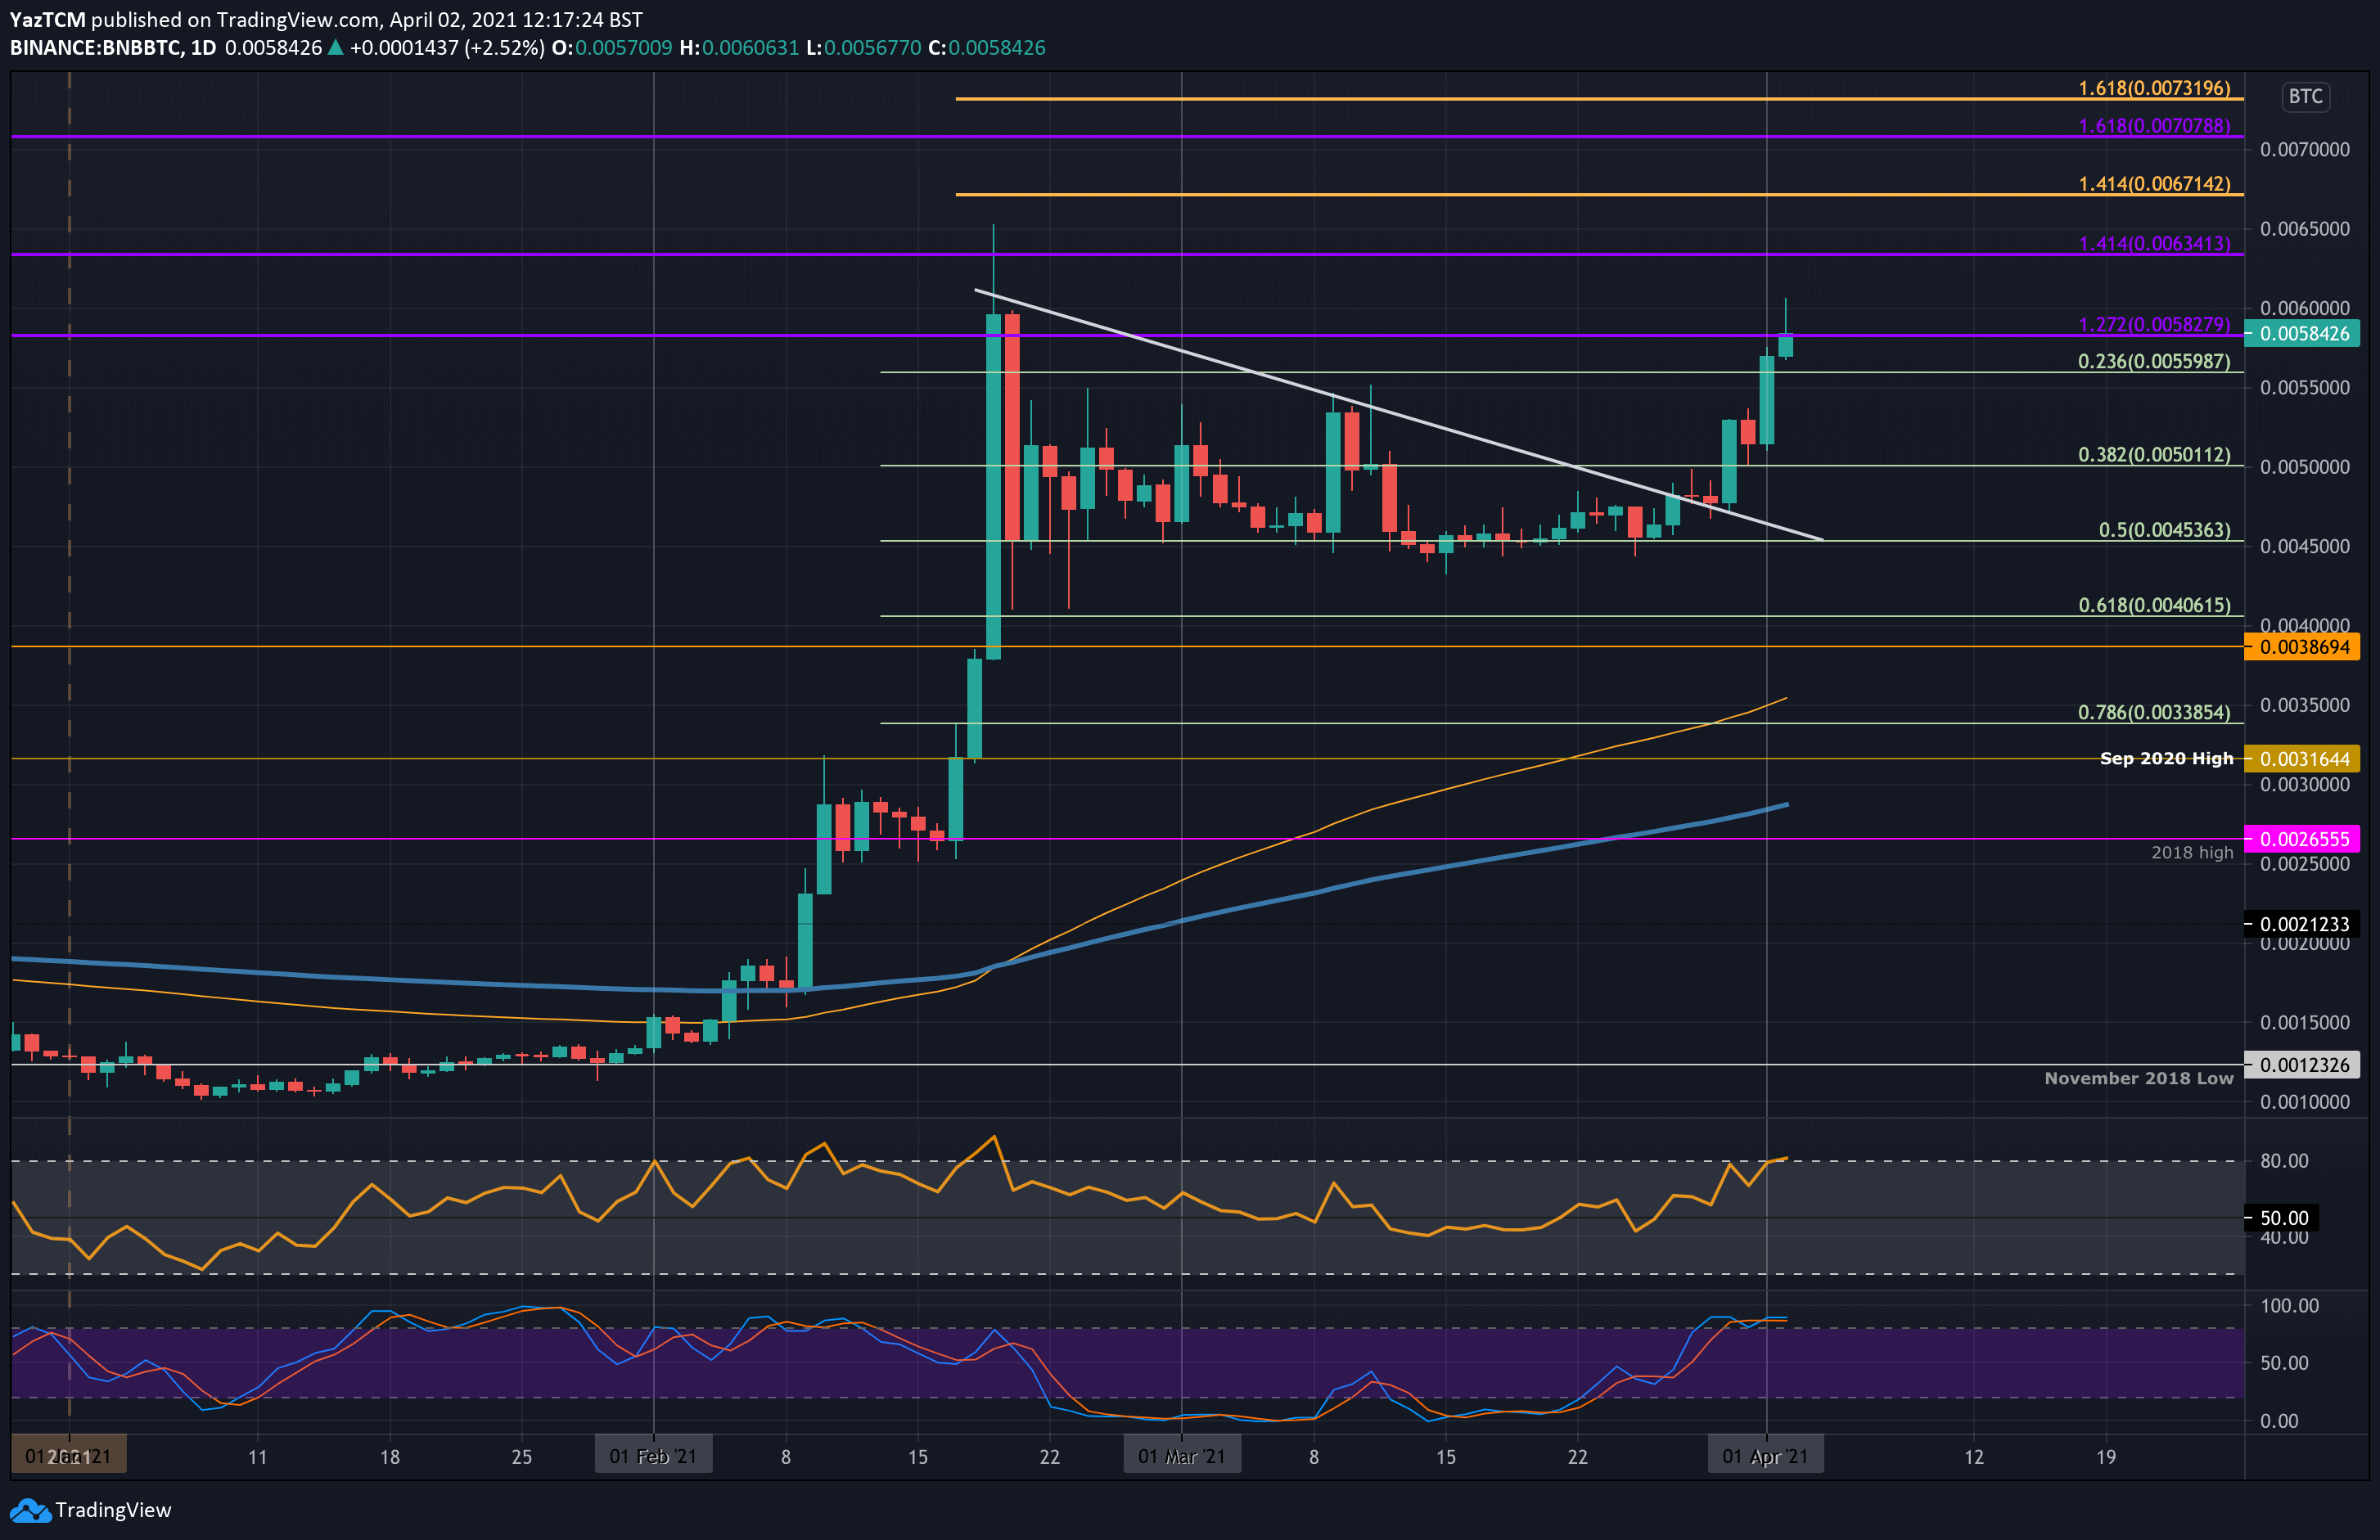
Binance Coin is also performing well against Bitcoin but is still yet to create fresh ATHs. At the start of the week, BNB was trading inside a descending triangle pattern with the floor of the triangle at 0.00453 BTC (.5 Fib).
The coin finally broke toward the upside of the consolidation pattern on Tuesday and managed to pass the March 2020 high of 0.0055 BTC yesterday. Today, BNB pushed as high as 0.00606 BTC but is currently facing resistance at 0.00582 BTC.
Moving forward, once 0.00582 BTC is penetrated, the first resistance lies at 0.006 BTC. This is followed by 0.00634 BTC (1.414 Fib Extension), 0.0065 BTC (ATH Price), and 0.00671 BTC.
On the other side, the first support lies at 0.0056 BTC (.236 Fib). This is followed by 0.005 BTC (.382 Fib), 0.00453 BTC (.5 Fib), and 0.00406 BTC (.618 Fib).
Cardano
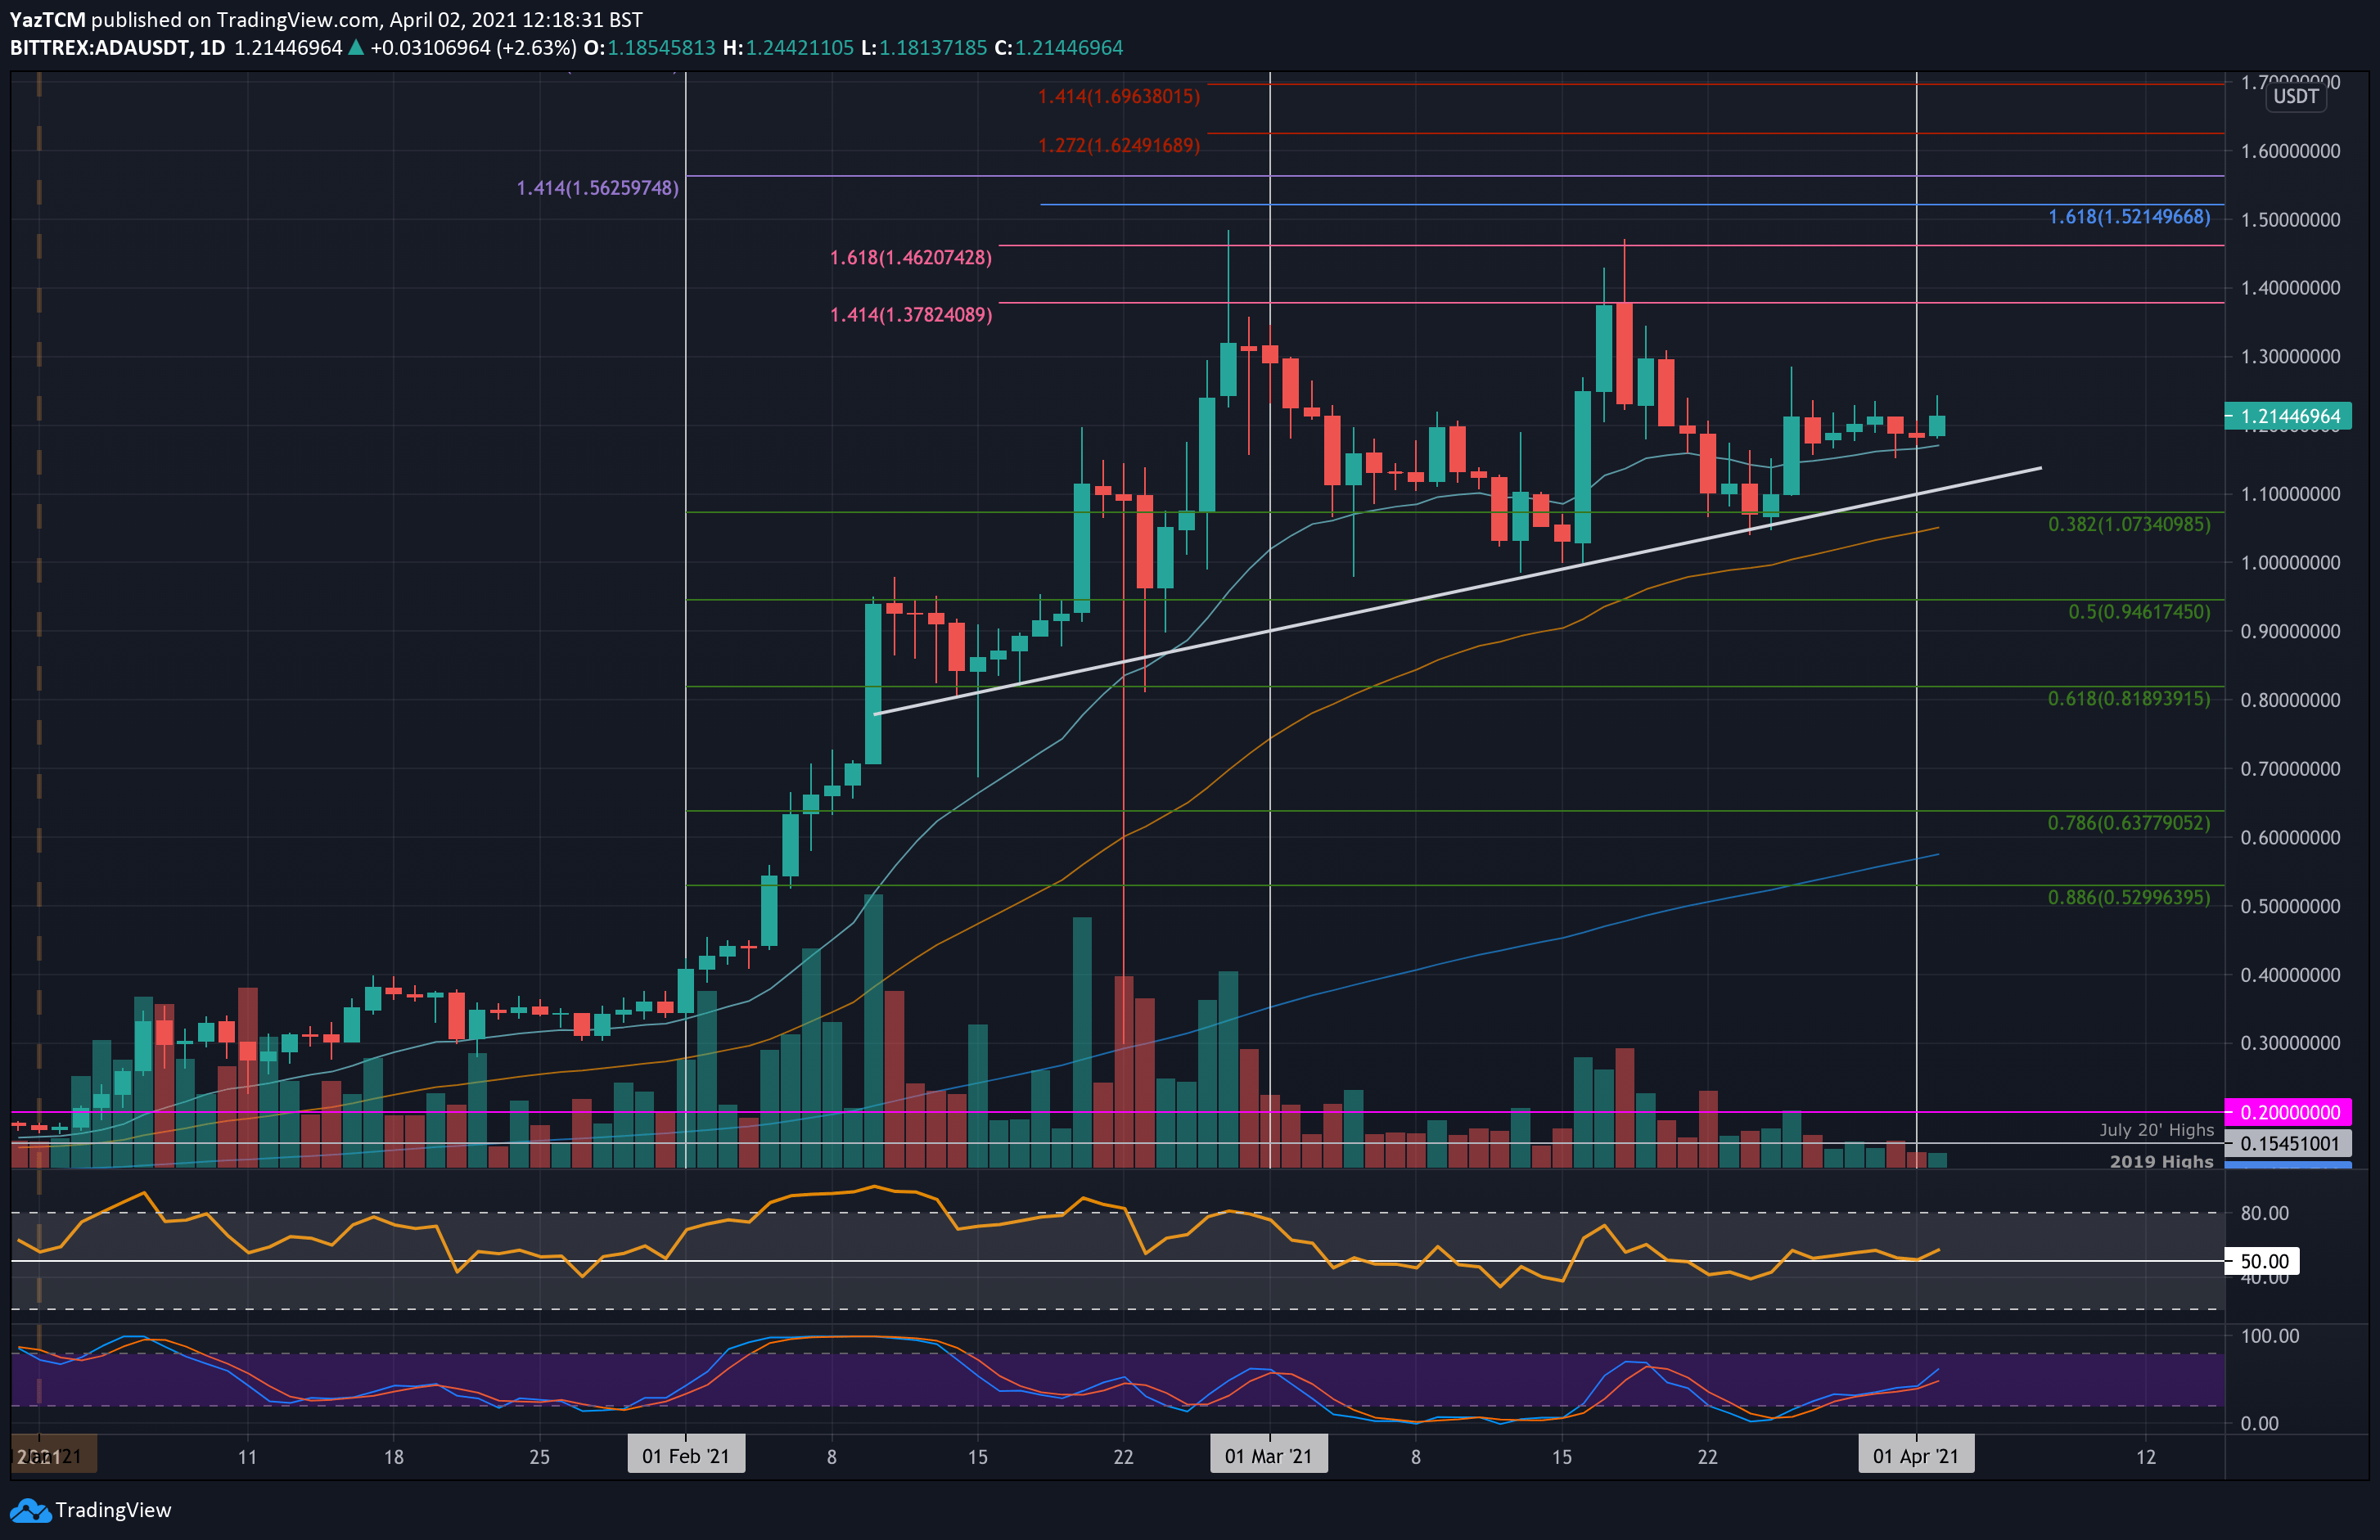
ADA saw a respectable 10.6% price hike this week as it currently trades at $1.21. The cryptocurrency rebounded from an ascending trend line at around $1.05 at the beginning of the week and pushed higher over the weekend to reach as high as $1.28.
However, throughout the course of the week, ADA has struggled to produce a closing candle above $1.22 and has traded inside a narrow range between $1.22 and $1.16 (20-day MA).
Looking ahead, if the buyers can create a daily closing candle above $1.22, the first resistance lies at $1.30. This is followed by $1.37 (1.414 Fib Extension), $1.46 (1.618 Fib Extension & March high), and $1.52.
On the other side, the first support lies at $1.16 (20-day MA). This is followed by $1.10 (ascending trend line), $1.00 (50-day MA), and $0.95 (.5 Fib).
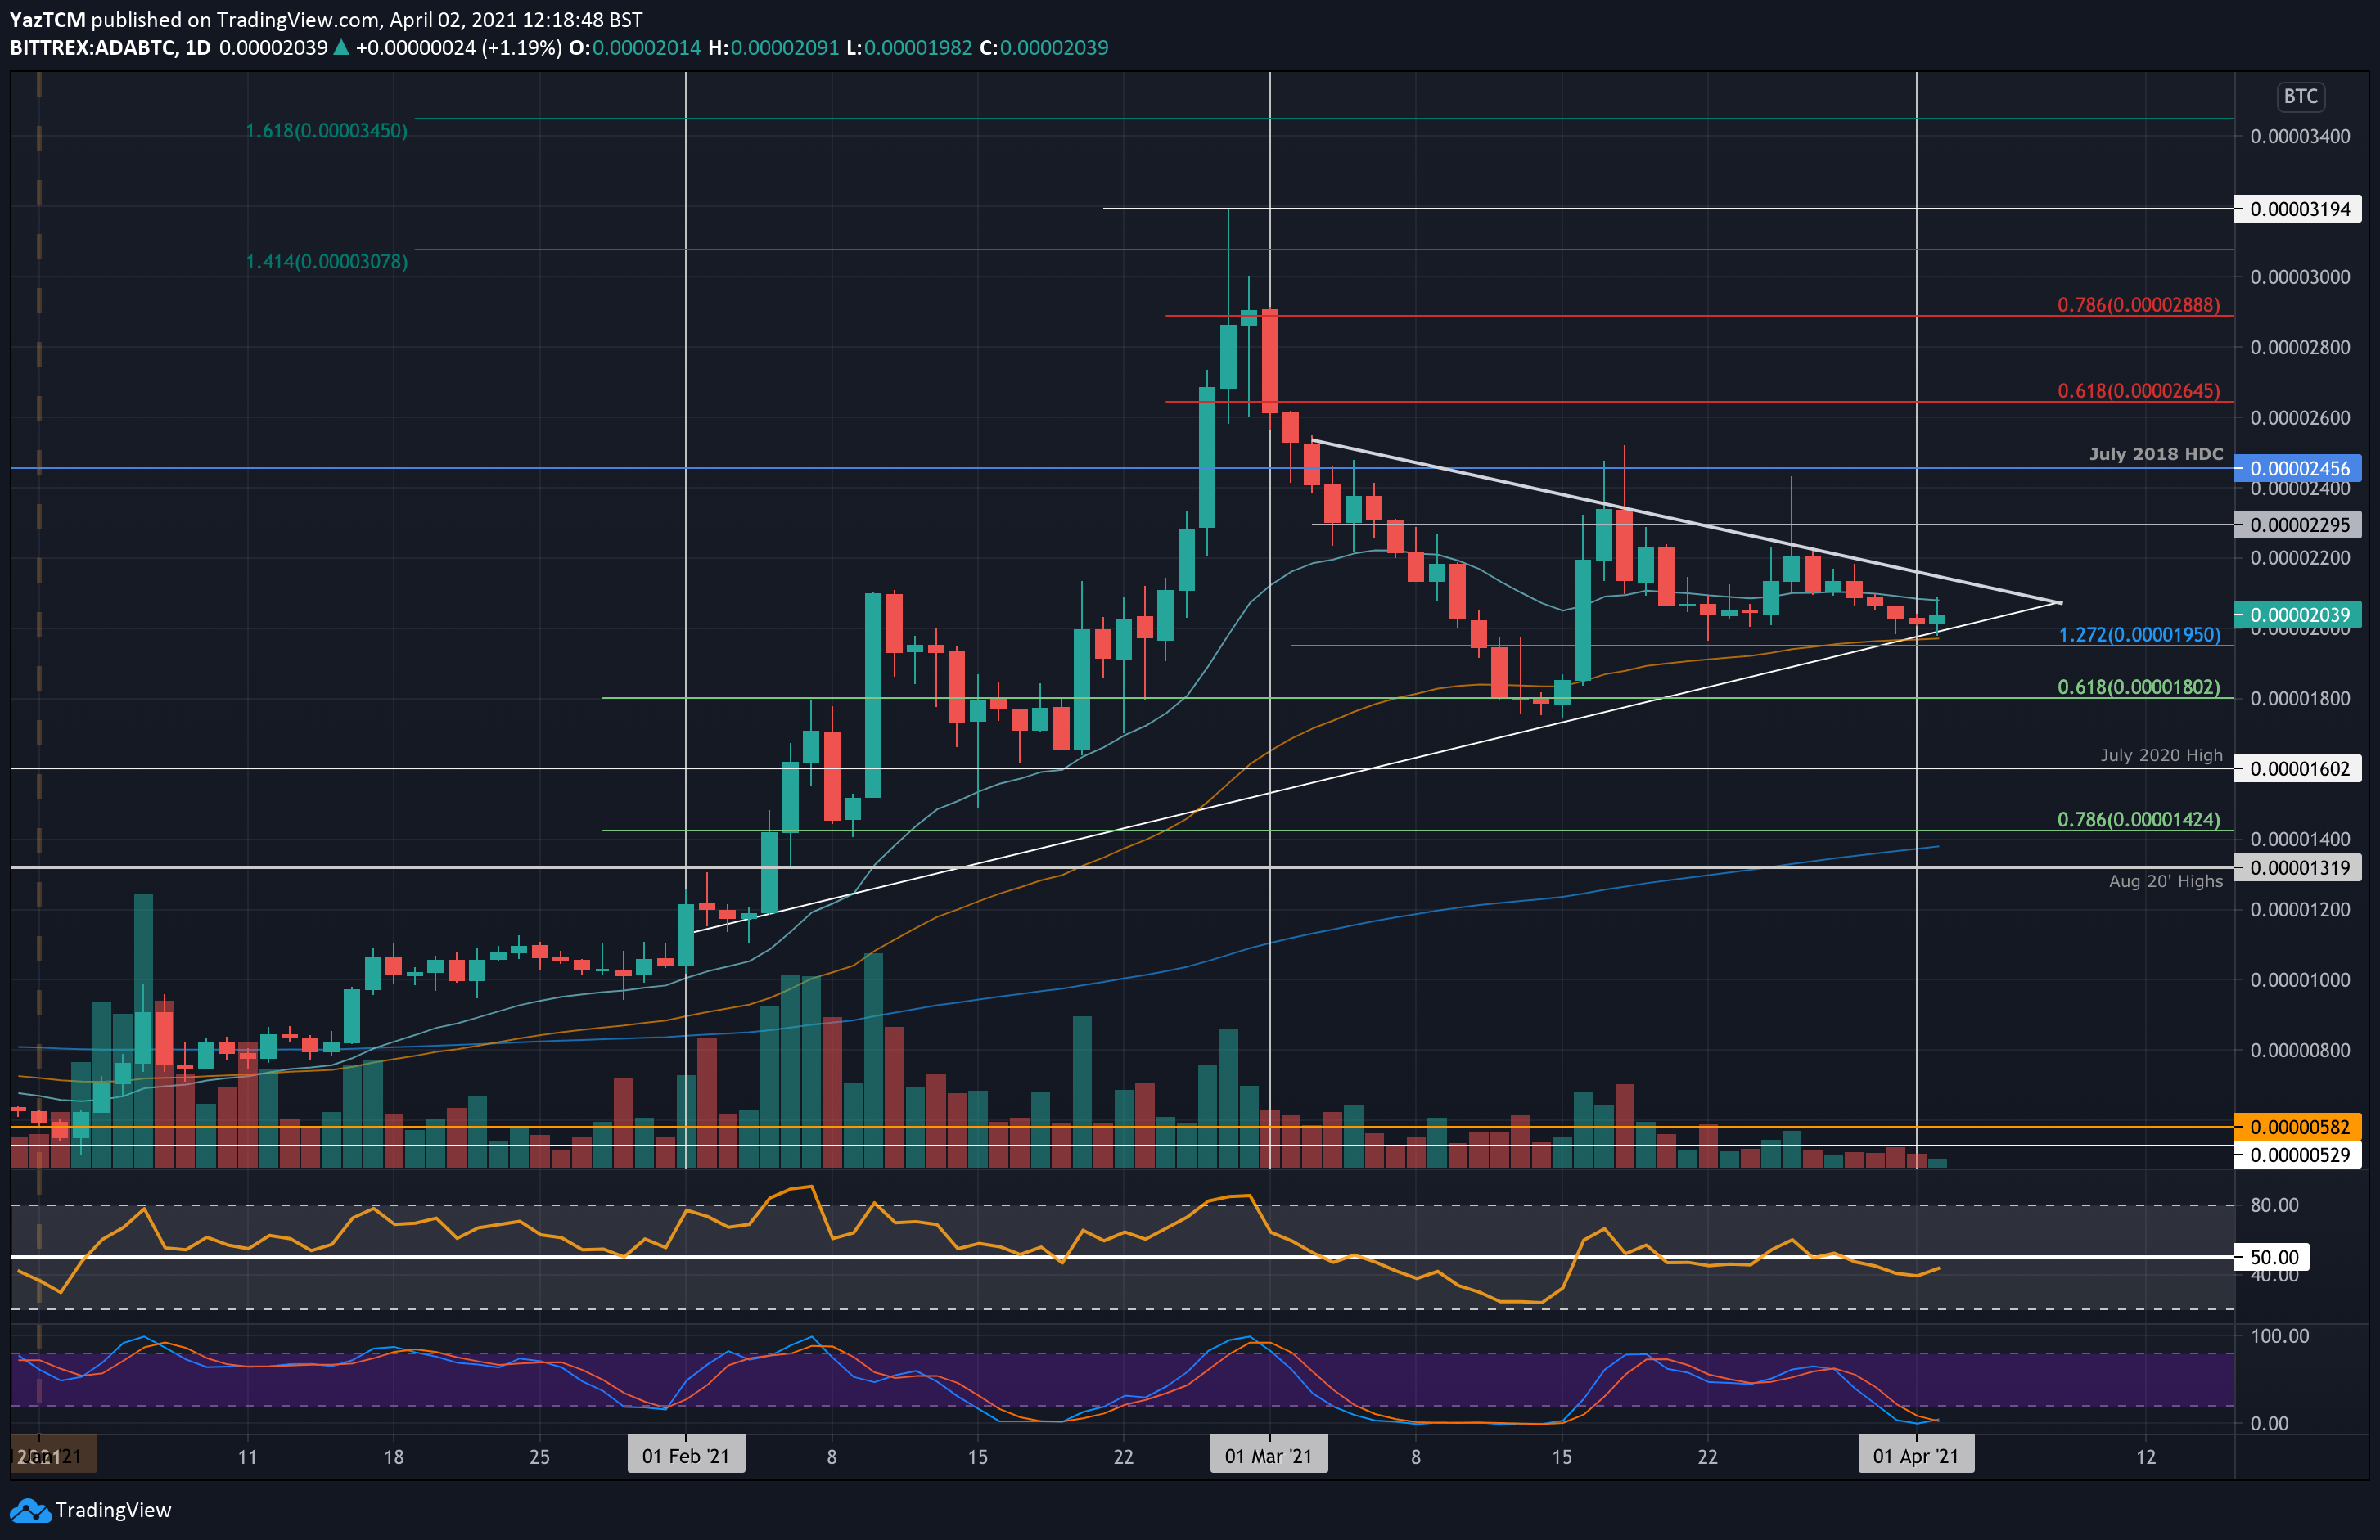
Against Bitcoin, Cardano fell slightly as it battles to stay above 2000 SAT. The cryptocurrency has been trading inside a symmetrical triangle pattern for the entire period of March as it fails to break the resistance at the upper boundary of the triangle.
Moving forward, the first level of resistance lies at the upper boundary of the triangle, around 2150 SAT. This is followed by 2300 SAT, 2455 SAT (July 2018 High-day closing price), and 2645 SAT (bearish .618 Fib).
On the other side, the first support lies at the lower boundary of the triangle at 2000 SAT. This is followed by 1950 SAT (downside 1.272 Fib Extension), 1800 SAT (.618 Fib), and 1600 SAT (July 2020 High).
Polkadot
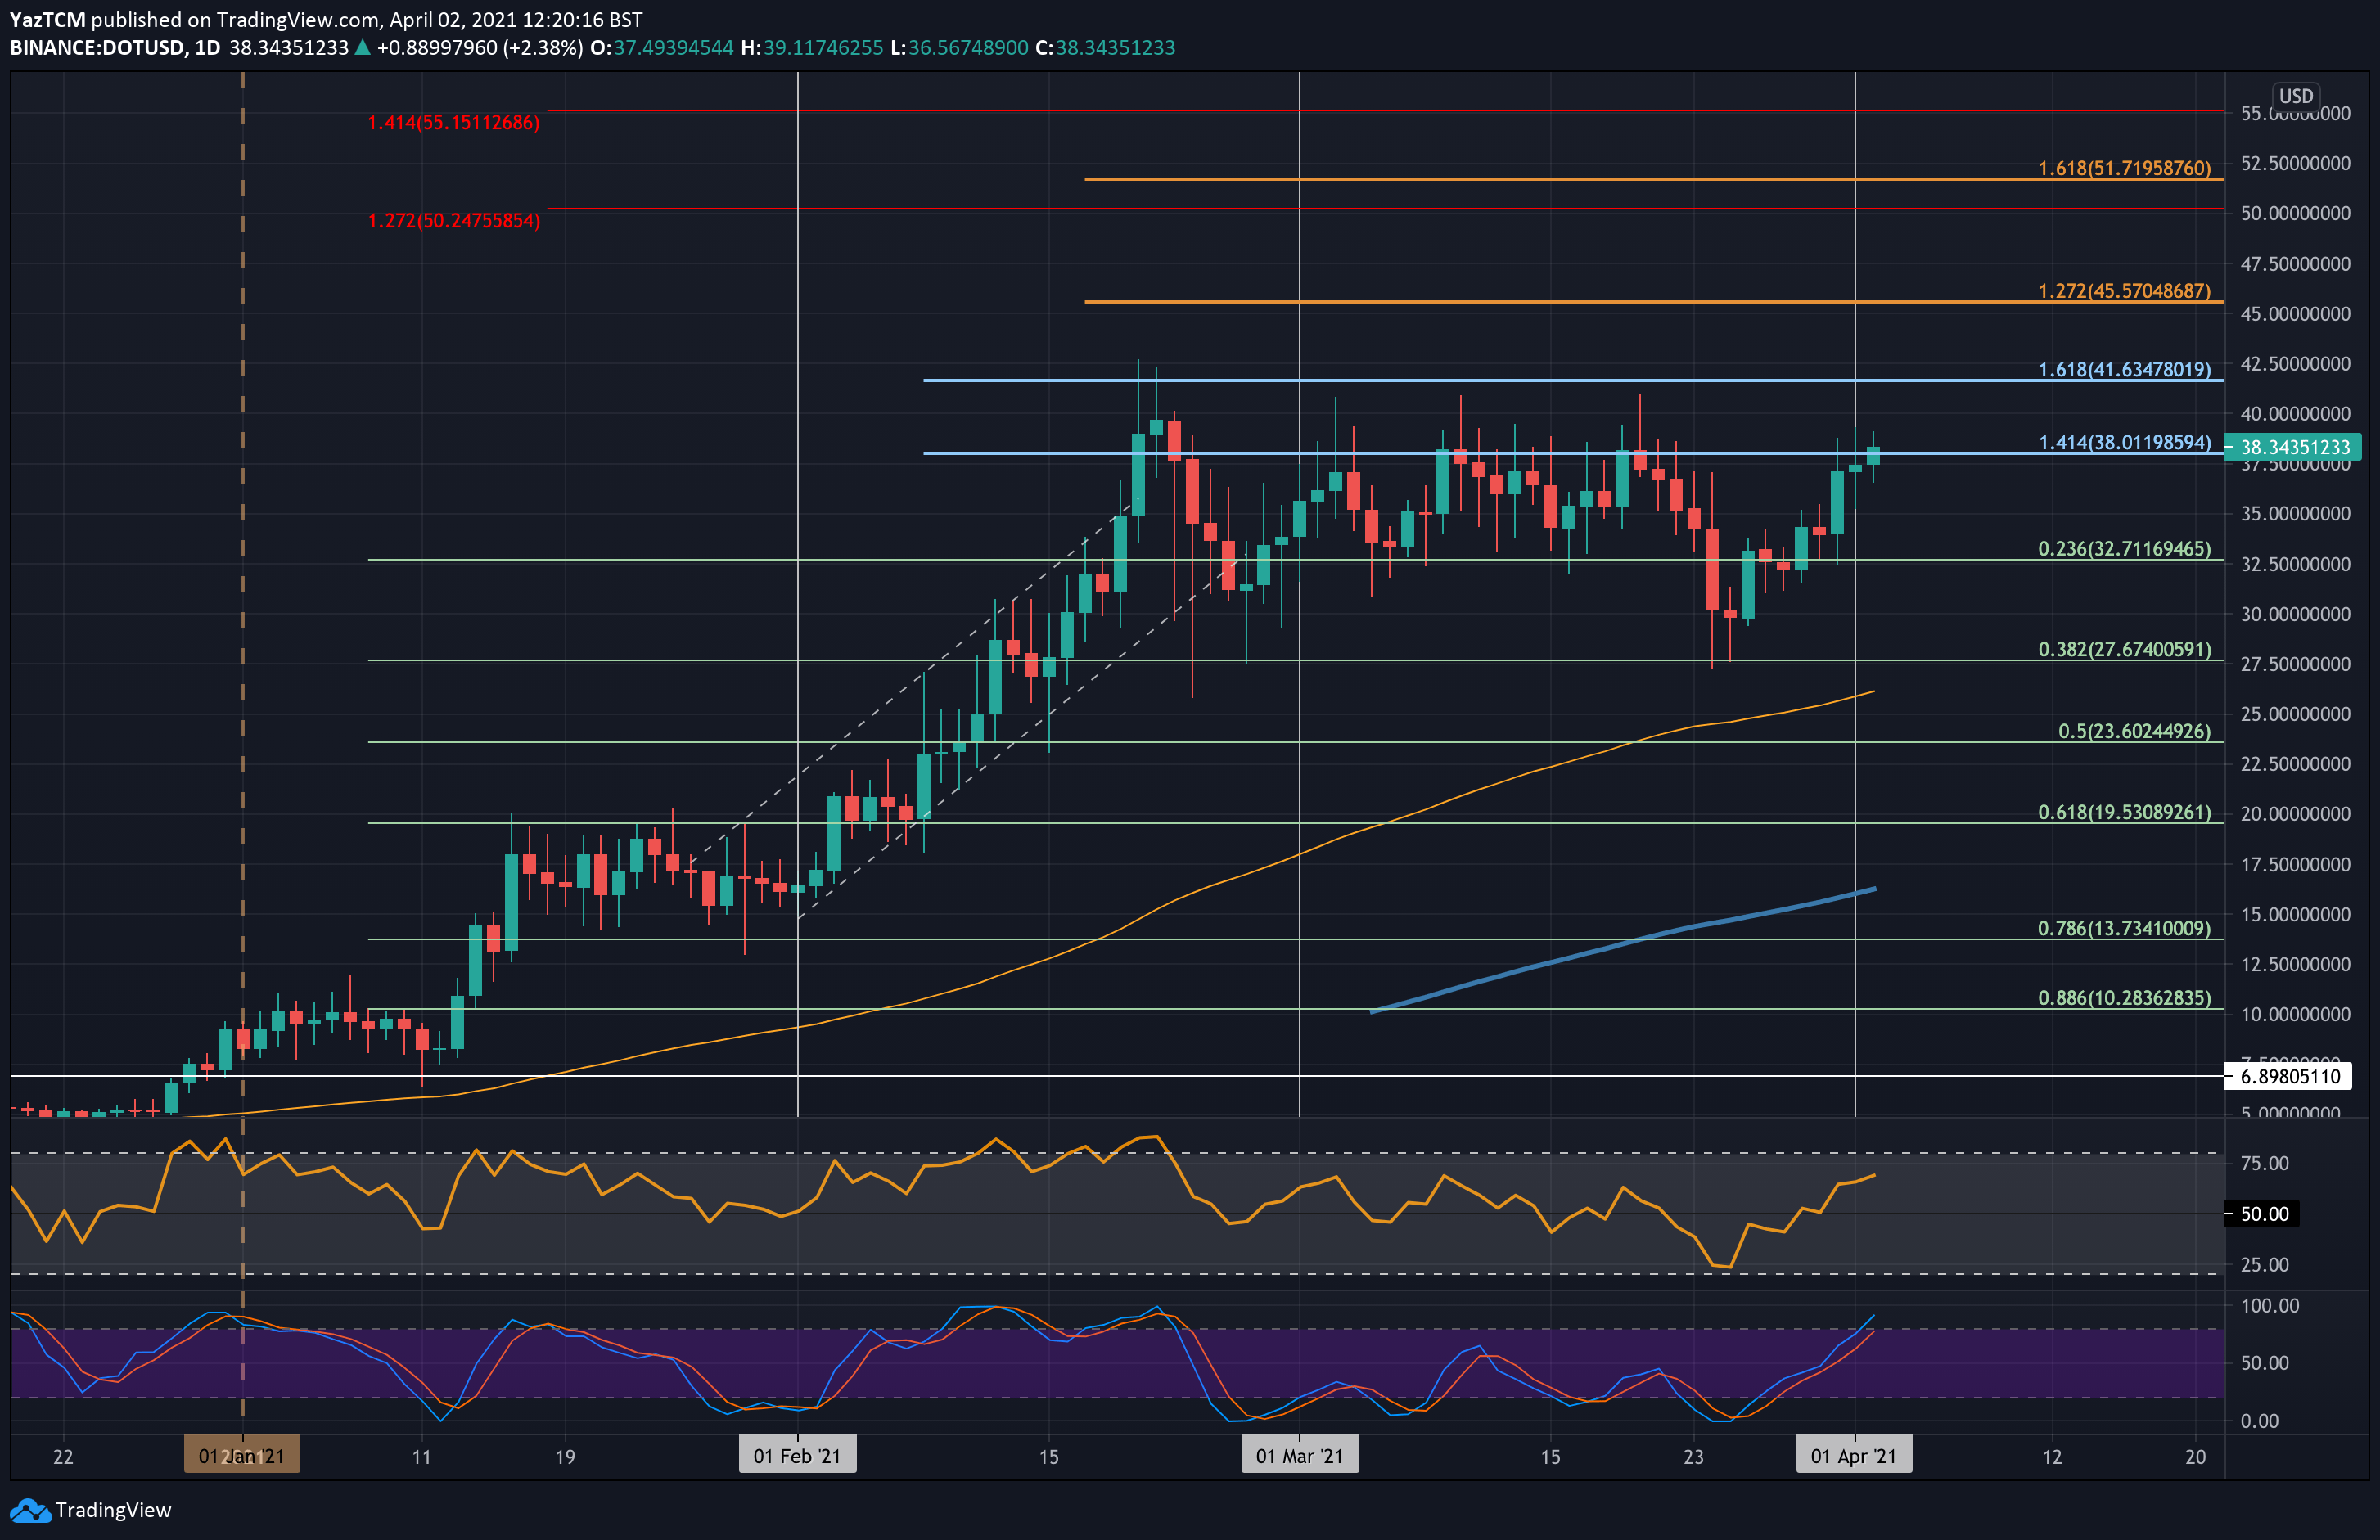
DOT saw an exciting week in which it managed to increase by 28.7% to reach the current $38.35 level. The cryptocurrency had found support at $30 at the beginning of the week after rebounding from support at $27.67 (.382 Fib) last Thursday.
Throughout the week, DOT started to grind higher until reaching the resistance at $38.35 today. The cryptocurrency had struggled to produce a daily closing candle above $38 throughout the entire period of March, and a closing candle above this would signal that DOT is ready to head back to the ATH prices.
Looking ahead, the first resistance above $38.35 lies at $40. This is closely followed by $42.50 (ATH price), $45.57 (1.272 Fib Extension), $47.50, and $50.
On the other side, the first support lies at $35. This is followed by $32.70 (.236 Fib), $30, and $27.67 (.382 Fib).
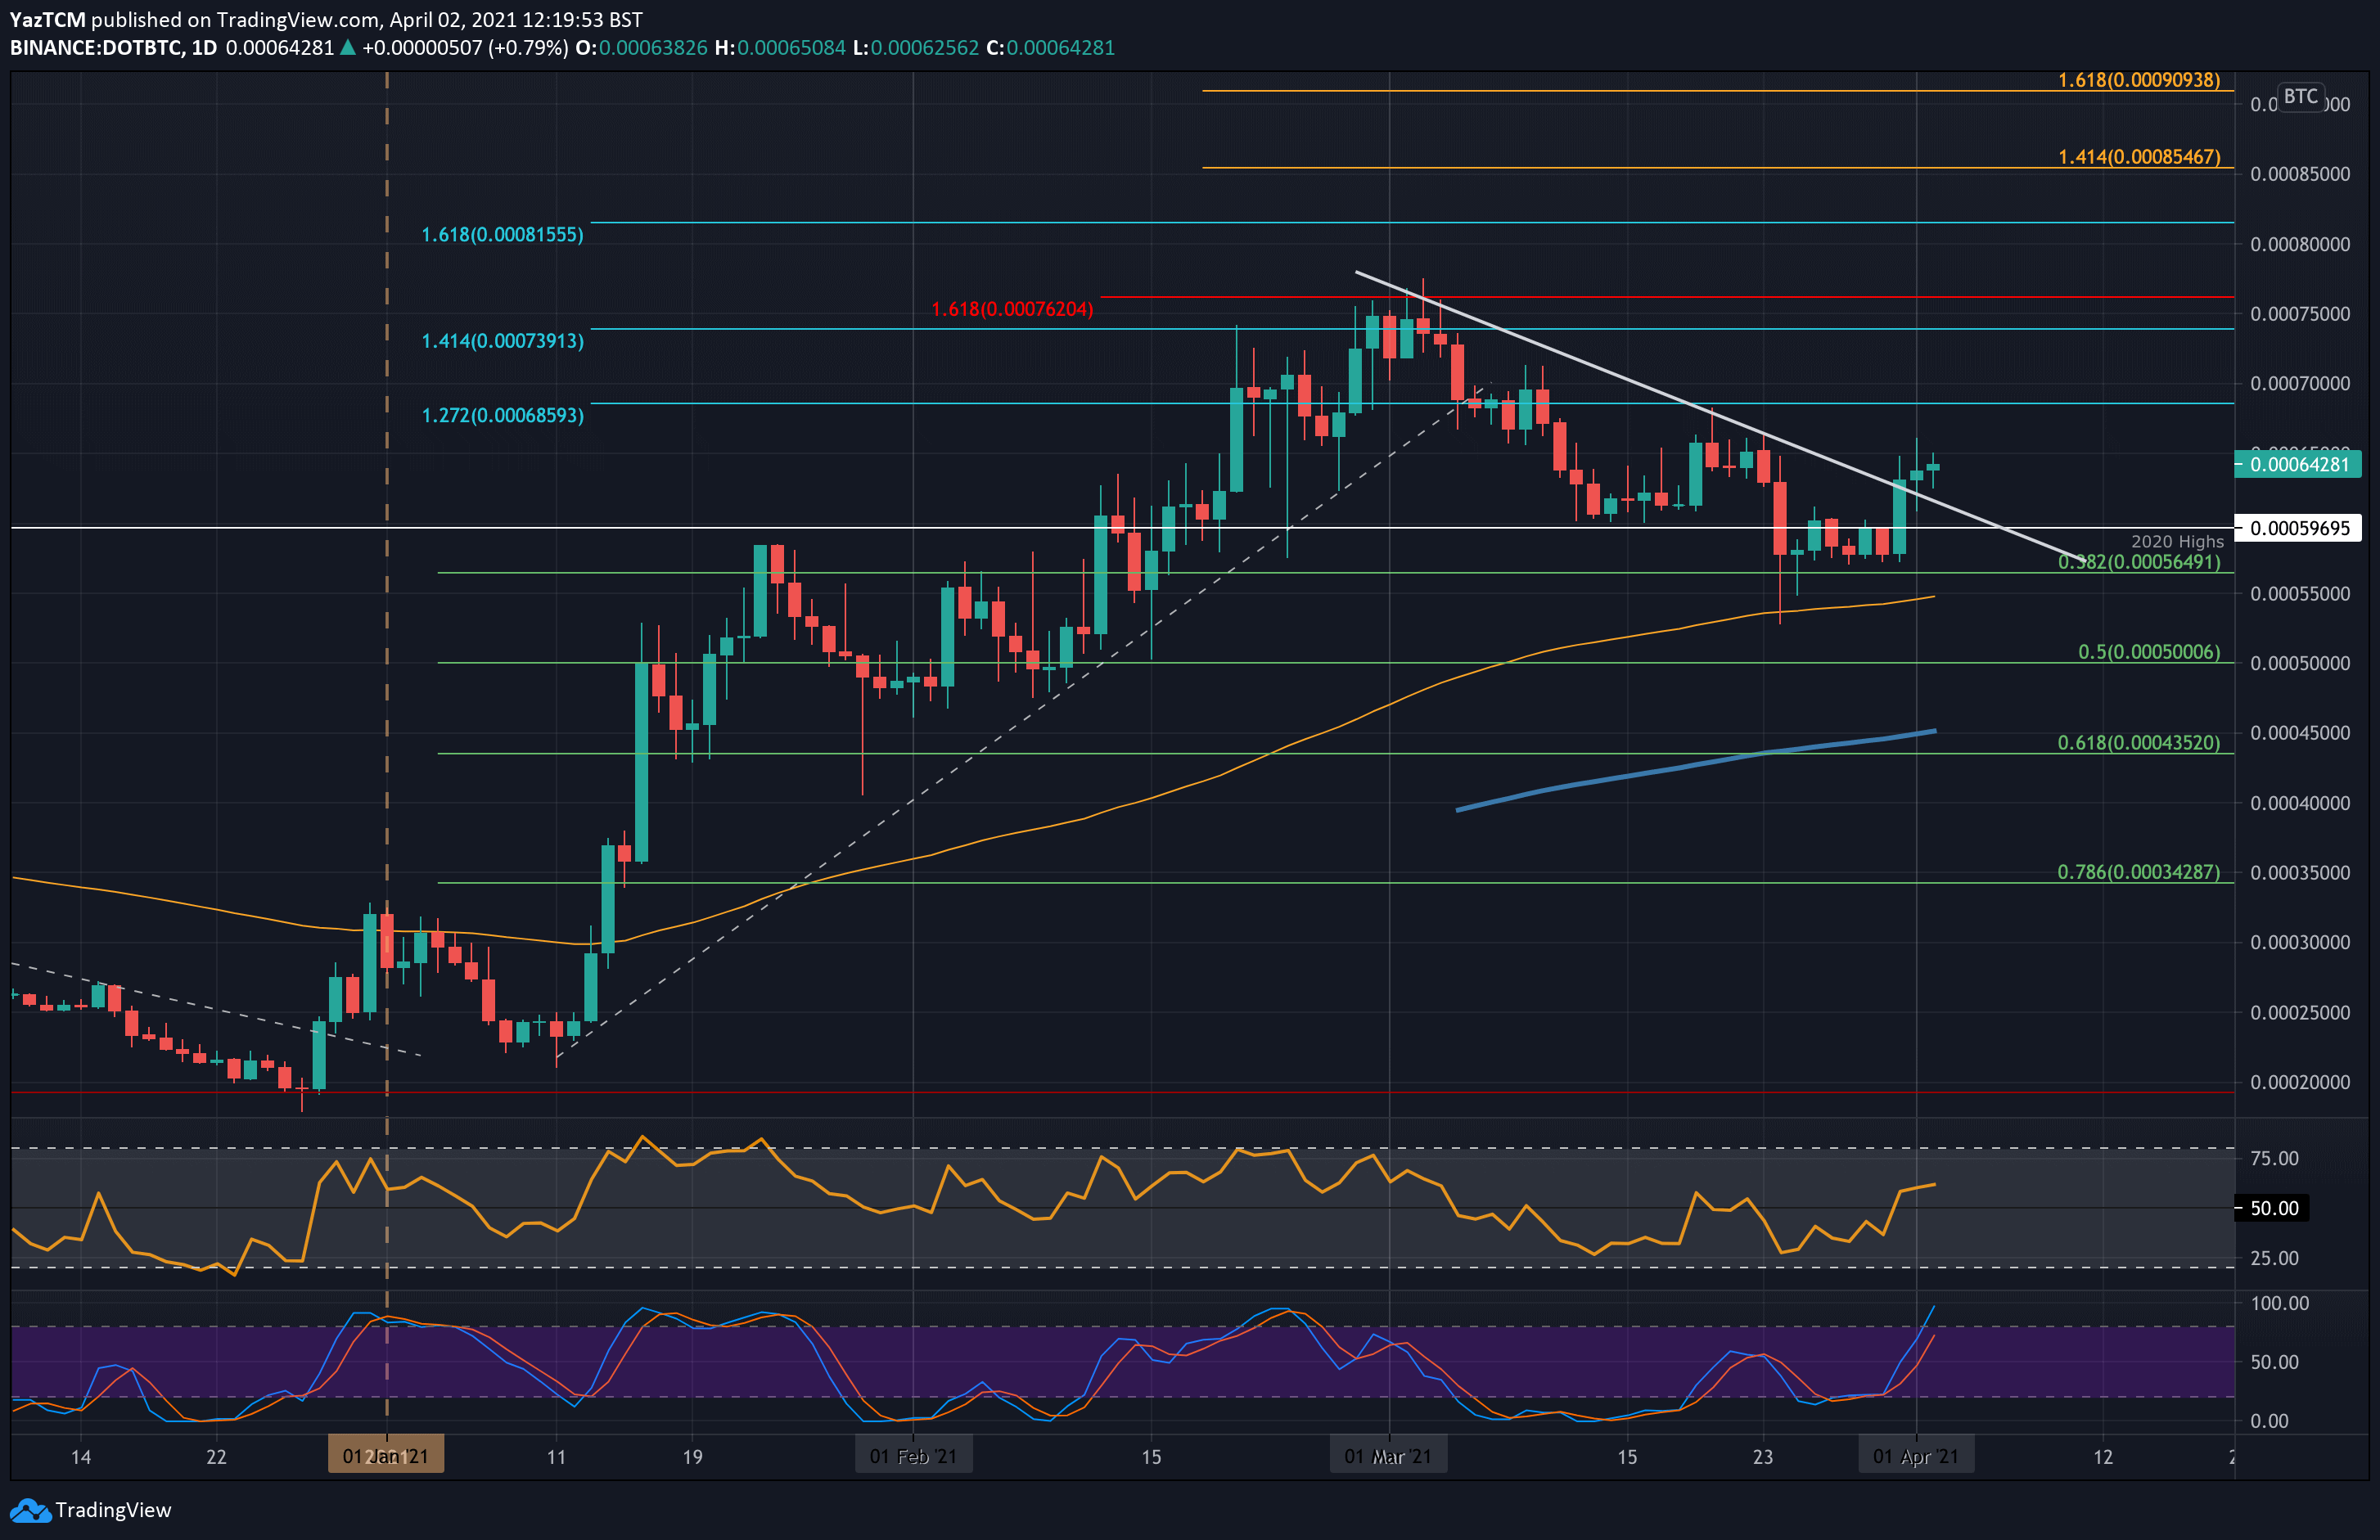
Polkadot is showing some promise against Bitcoin as it managed to break above a descending trend line that had suppressed the market during the entire period of March. The coin had found support at 0.00057 BTC during the week and pushed higher on Wednesday to break above the 2020 highs at 0.0006 BTC and push above the descending trend line.
Since the break, DOT has slowly pushed higher a little but is yet to close a daily candle above 0.00065 BTC.
Moving forward, once DOT clears 0.00065 BTC, the first resistance lies at 0.000685 BTC (1.272 Fib Extension). This is followed by 0.0007 BTC, 0.00762 BTC, and 0.0008 BTC.
On the other side, the first support lies at 0.0006 BTC (2020 highs). This is followed by 0.00057 BTC, 0.00055 BTC (100-days EMA), and 0.0005 BTC (.5 Fib).