Bitcoin Bitcoin moved sideways over the last week of trading as it sits at ,500. At the start of the week, the cryptocurrency made multiple attempts to break the ,000 level but failed on each attempt. It then went on to establish support at ,000. However, this support was penetrated on Wednesday as BTC plummeted as low as ,440. Luckily, the buyers regrouped at this low and managed to allow BTC to rebound above ,000 yesterday. Today, BTC continued higher to break resistance at ,355 to reach as high as ,500, where it currently trades. Looking ahead, the first level of strong resistance lies at ,000. This is followed by the ATH price at ,780. Beyond the ATH, additional resistance is found at ,400 (1.272 Fib Extension), ,766 (1.414 Fib
Topics:
Yaz Sheikh considers the following as important: ADABTC, ADAUSD, Binance Coin (BNB) Price, Bitcoin (BTC) Price, BNBBTC, bnbusd, BTC Analysis, BTCEUR, BTCGBP, btcusd, btcusdt, Cardano (ADA) Price, ETH Analysis, ETHBTC, Ethereum (ETH) Price, ethusd, Price Analysis, Ripple (XRP) Price, XRP Analysis, xrpbtc, xrpusd
This could be interesting, too:
Mandy Williams writes Bitcoin ETFs Record Over .6B in Outflows in the Past 2 Weeks
Dimitar Dzhondzhorov writes Millions of ADA Sold by Cardano Whales During Market Crash – Will the Decline Continue?
Chayanika Deka writes Bitcoin Whales Offload 6,813 BTC as Selling Pressure Mounts
Wayne Jones writes Bitcoin Sentiment Hits 2022 Lows as Fear & Greed Index Falls to 10
Bitcoin
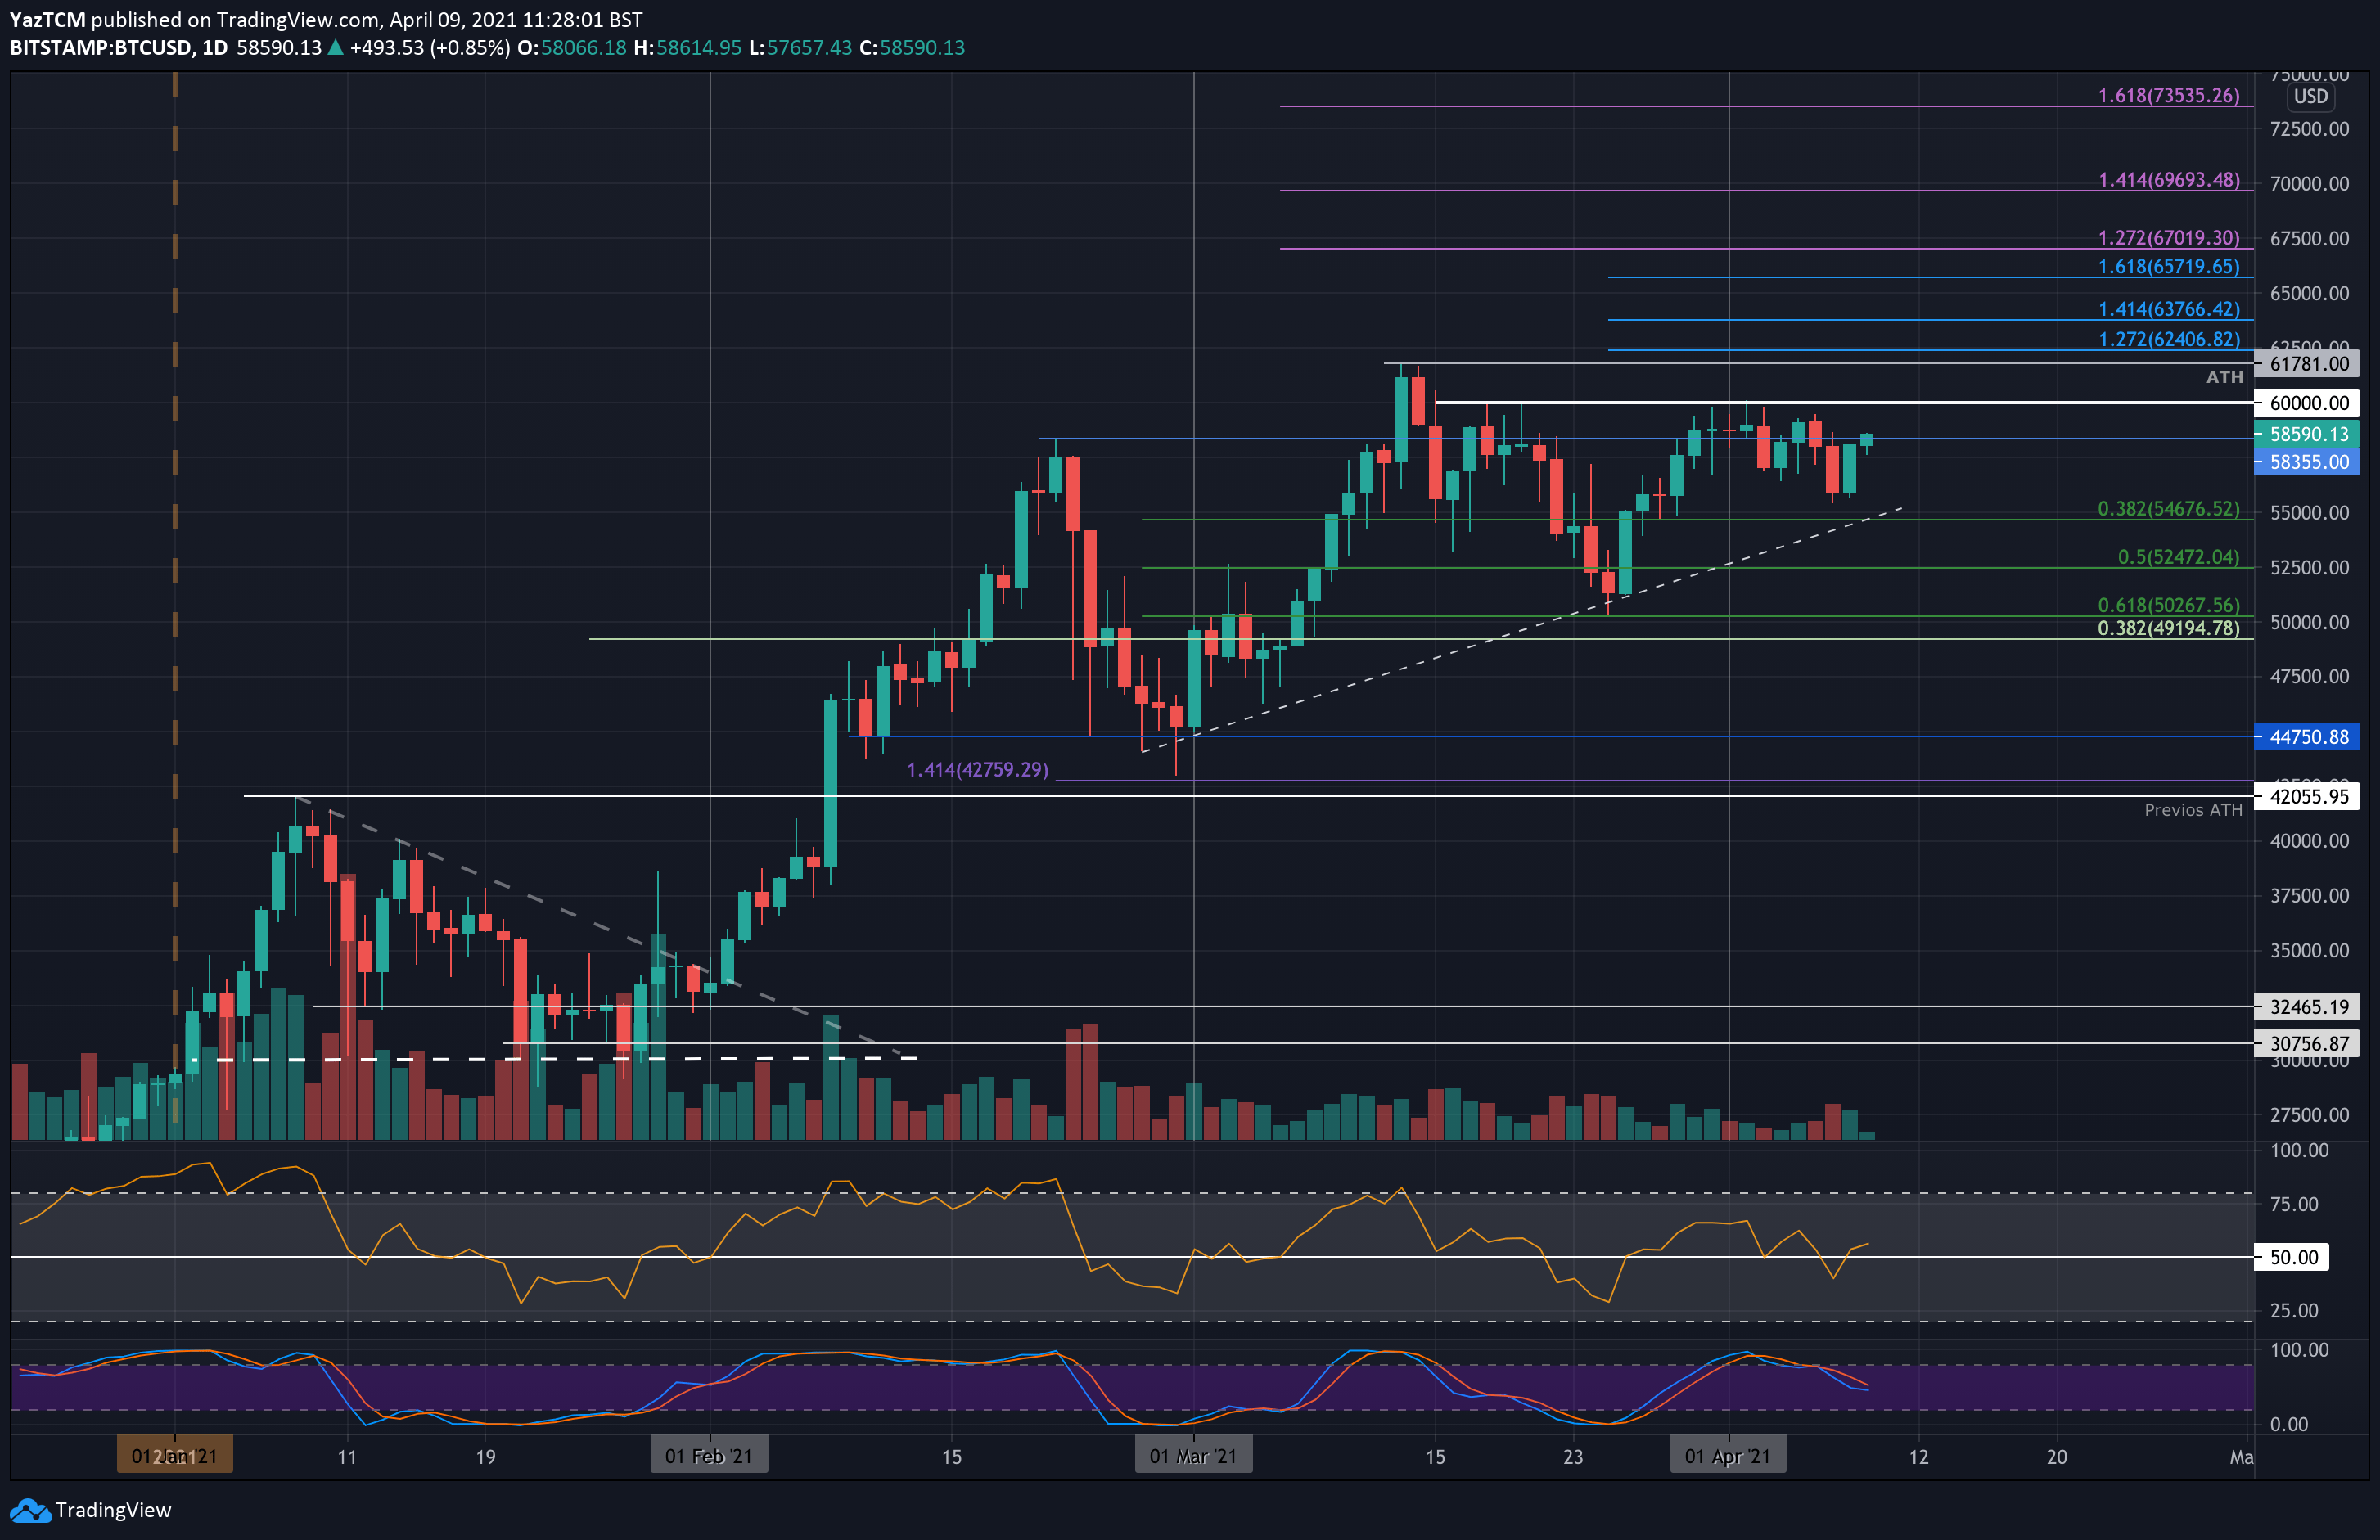
Bitcoin moved sideways over the last week of trading as it sits at $58,500. At the start of the week, the cryptocurrency made multiple attempts to break the $60,000 level but failed on each attempt. It then went on to establish support at $57,000. However, this support was penetrated on Wednesday as BTC plummeted as low as $55,440.
Luckily, the buyers regrouped at this low and managed to allow BTC to rebound above $58,000 yesterday. Today, BTC continued higher to break resistance at $58,355 to reach as high as $58,500, where it currently trades.
Looking ahead, the first level of strong resistance lies at $60,000. This is followed by the ATH price at $61,780. Beyond the ATH, additional resistance is found at $62,400 (1.272 Fib Extension), $63,766 (1.414 Fib Extension), 465,000, and $65,720 (1.618 Fib Extension).
On the other side, the first support lies at $58,000. This is followed by $57,000, $52,675 (.382 Fib), $52,470 (.5 Fib), and $50,267 (.618 Fib).
Ethereum
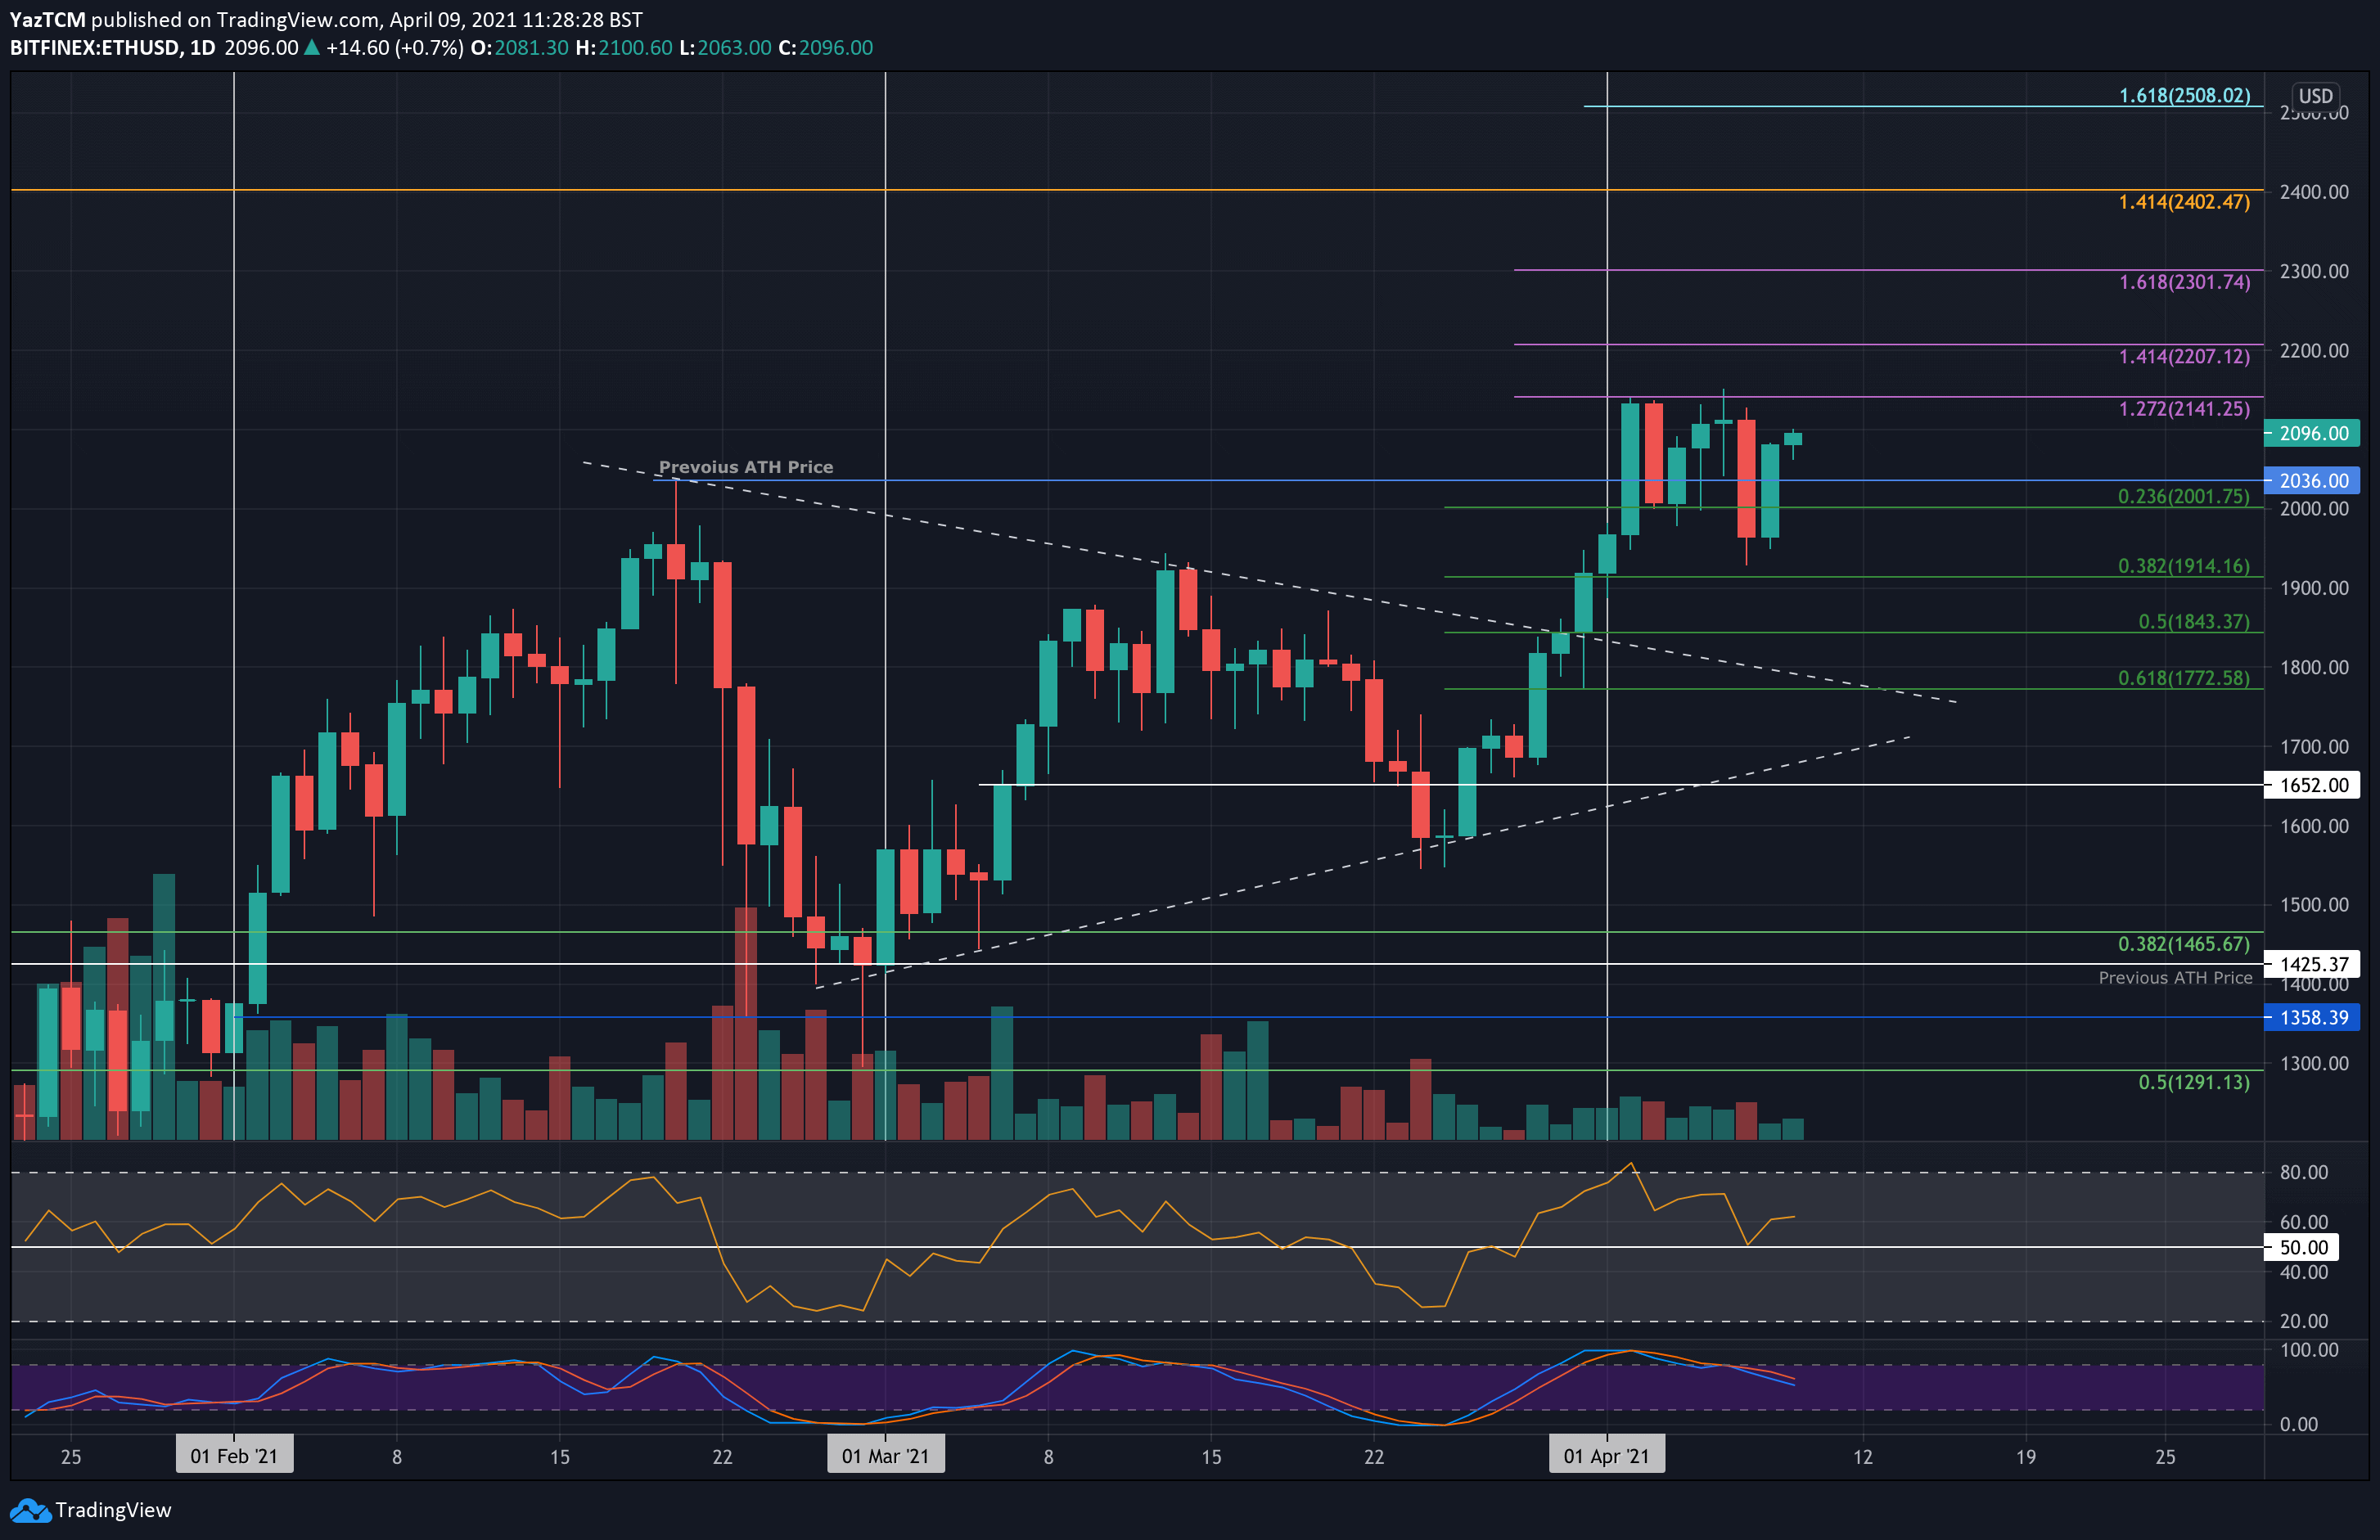
Ethereum saw a strong 6% price hike over the past seven days as it set a new ATH price at $2151 on Tuesday. The cryptocurrency started the week by surging into resistance at $2141 (1.272 Fib Extension). Unfortunately, it was unable to overcome this resistance throughout the week and ended up plummeting back beneath $2,000 on Wednesday to reach as low as $1930.
The bulls quickly rebounded yesterday to bring the price above $2,000 again and are now battling to break beyond $2100 today.
Looking ahead, the first level of resistance lies at $2141 (1.272 Fib Extension). This is followed by $2207 (1.414 Fib Extension), $2300 (1.618 Fib Extension), and $2400.
On the other side, the first support lies at $2036 (previous ATH price). This is followed by $2000 (.236 Fib), $1930 (weekly low), $1914 (.382 Fib), and $1843 (.5 Fib).
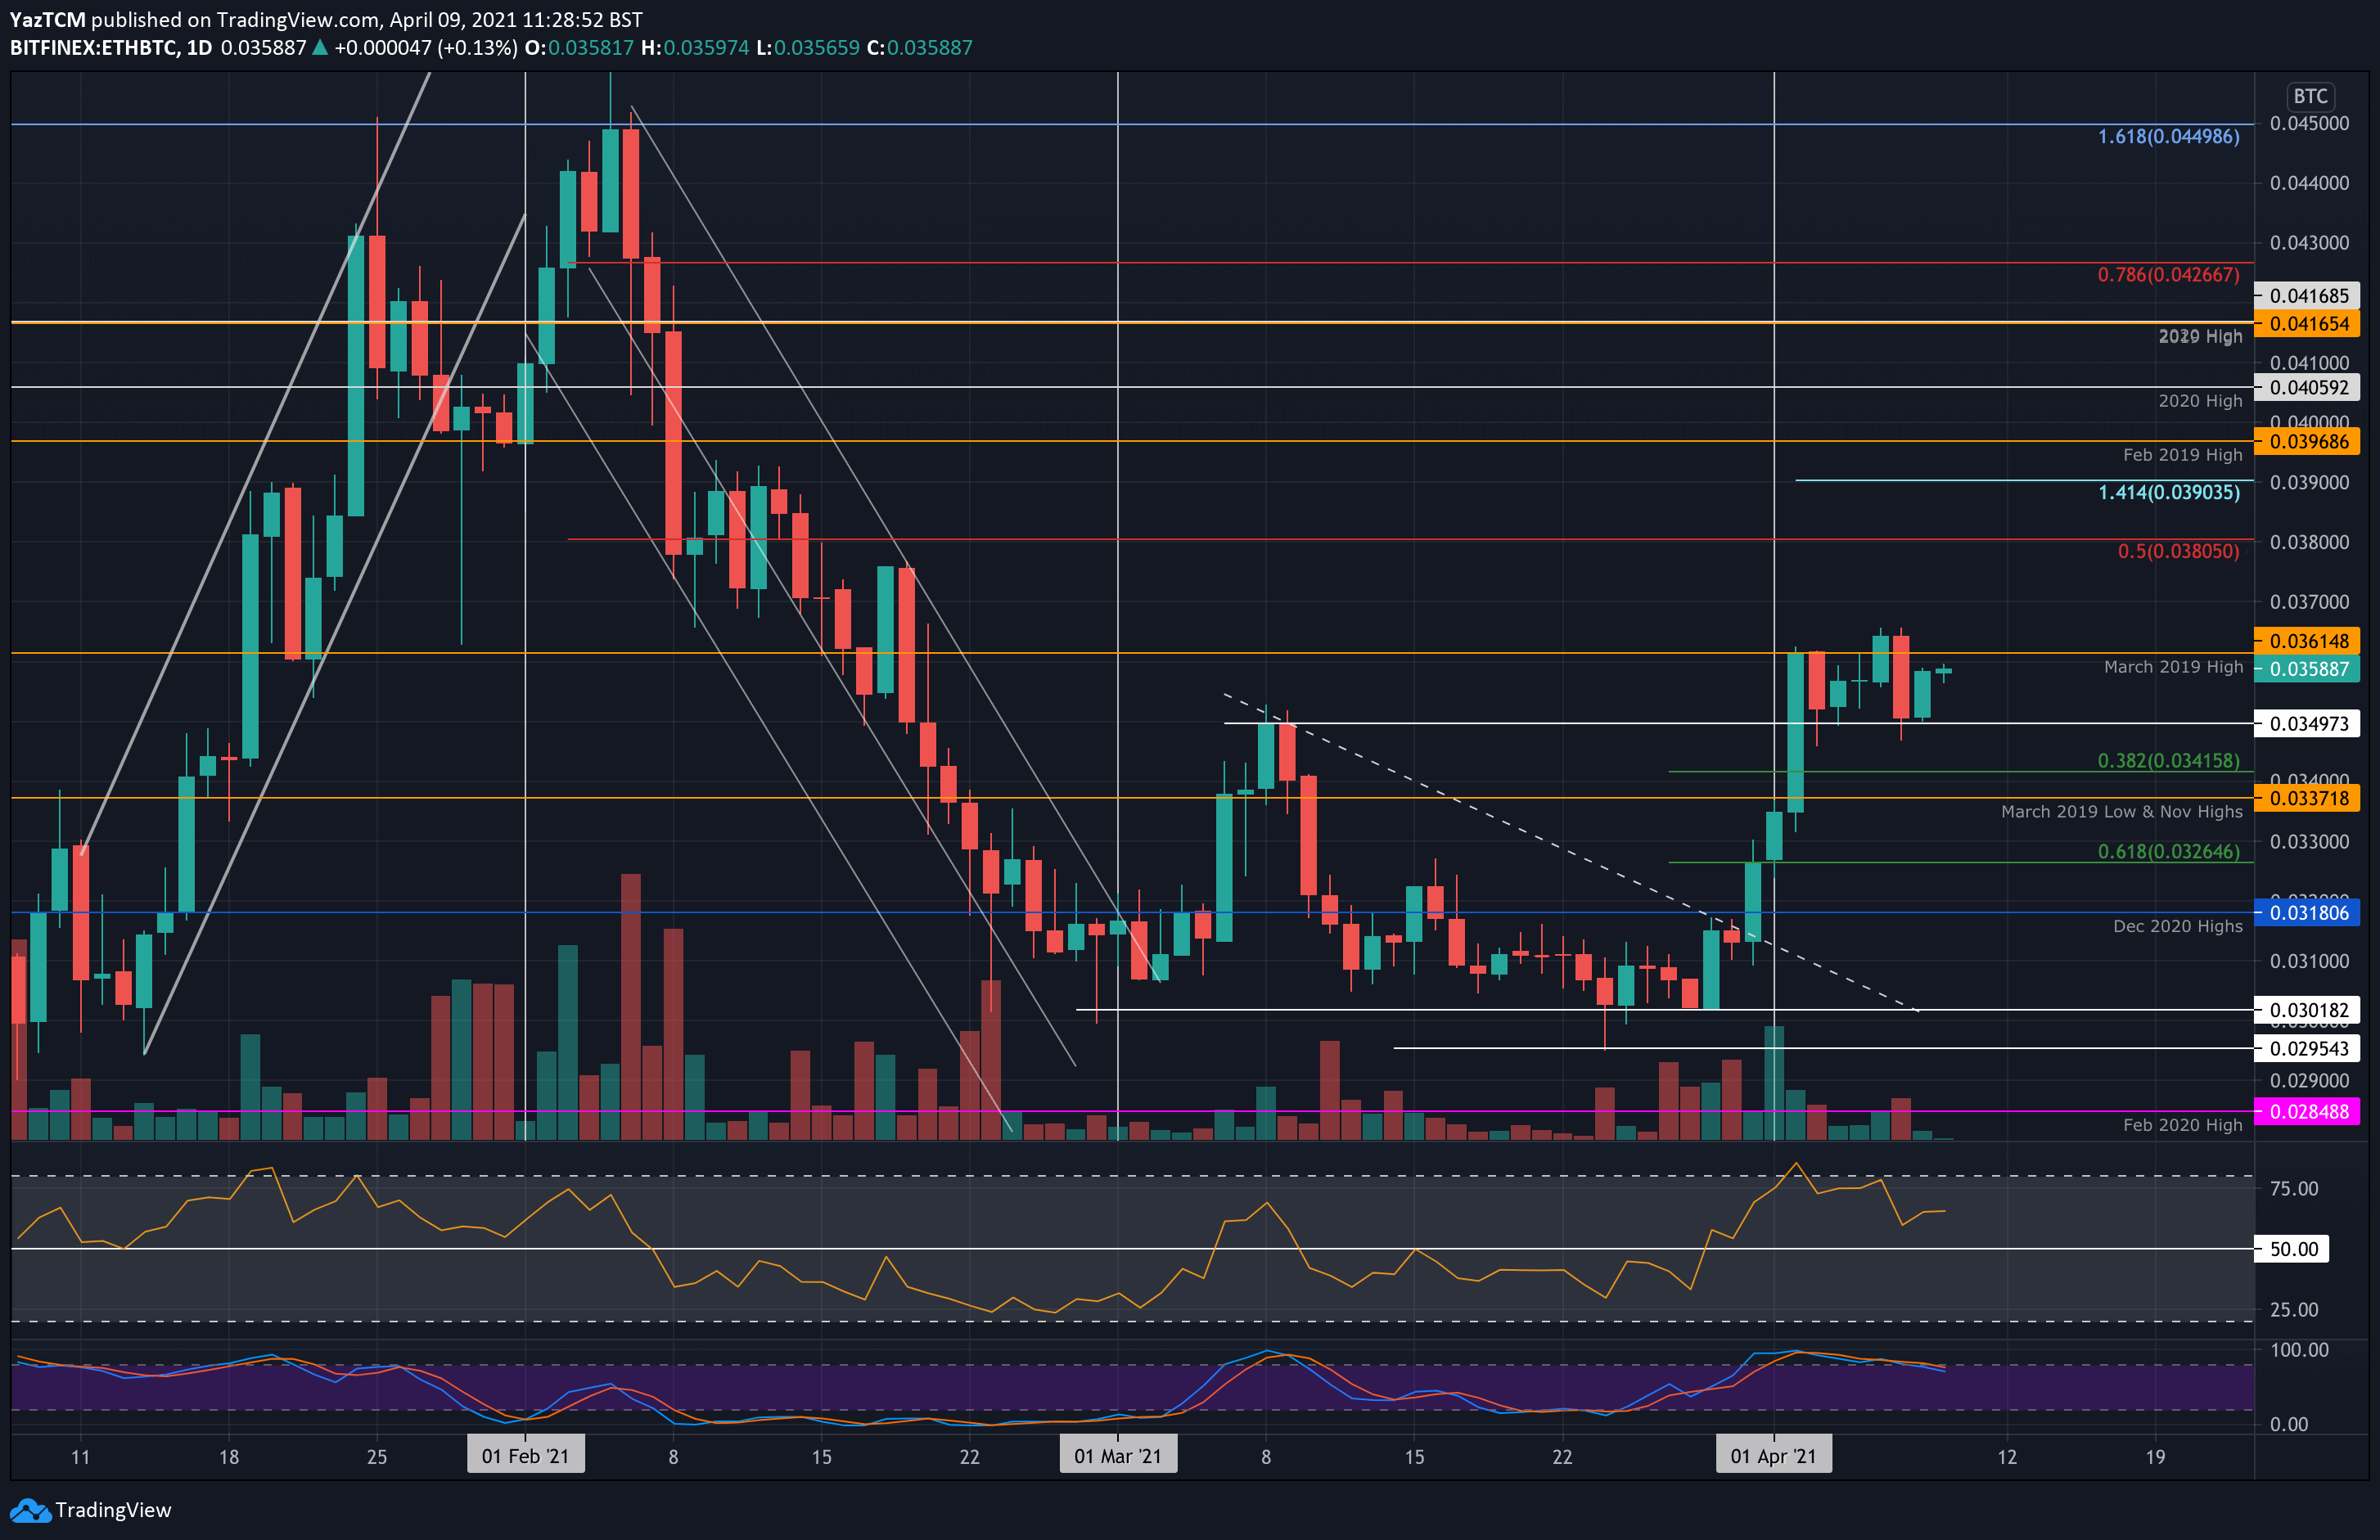
ETH is also performing relatively well against Bitcoin this week as it establishes a range between the March 2019 high at 0.0361 BTC and 0.0349 BTC. The coin did briefly spike above this range during the week to reach as high as 0.0365 BTC, but the market drop on Wednesday pushed it back into the established range.
Yesterday, ETH rebounded from the lower boundary of the range at 0.0349 BTC and is now trading at 0.0358 BTC as it makes its way back toward the March 2019 highs.
Looking ahead, the first resistance lies at 0.0361 BTC (March 2019 high). This is followed by 0.0365 BTC, 0.037 BTC, 0.038 BTC (bearish .5 Fib), and 0.039 BTC (1.414 Fib Extension).
On the other side, the first support lies at 0.0349 BTC. This is followed by 0.0341 BTC (.382 Fib), 0.0337 BTC (Nov 2020 highs), 0.0326 BTC (.618 Fib), and 0.0318 BTC.
Ripple
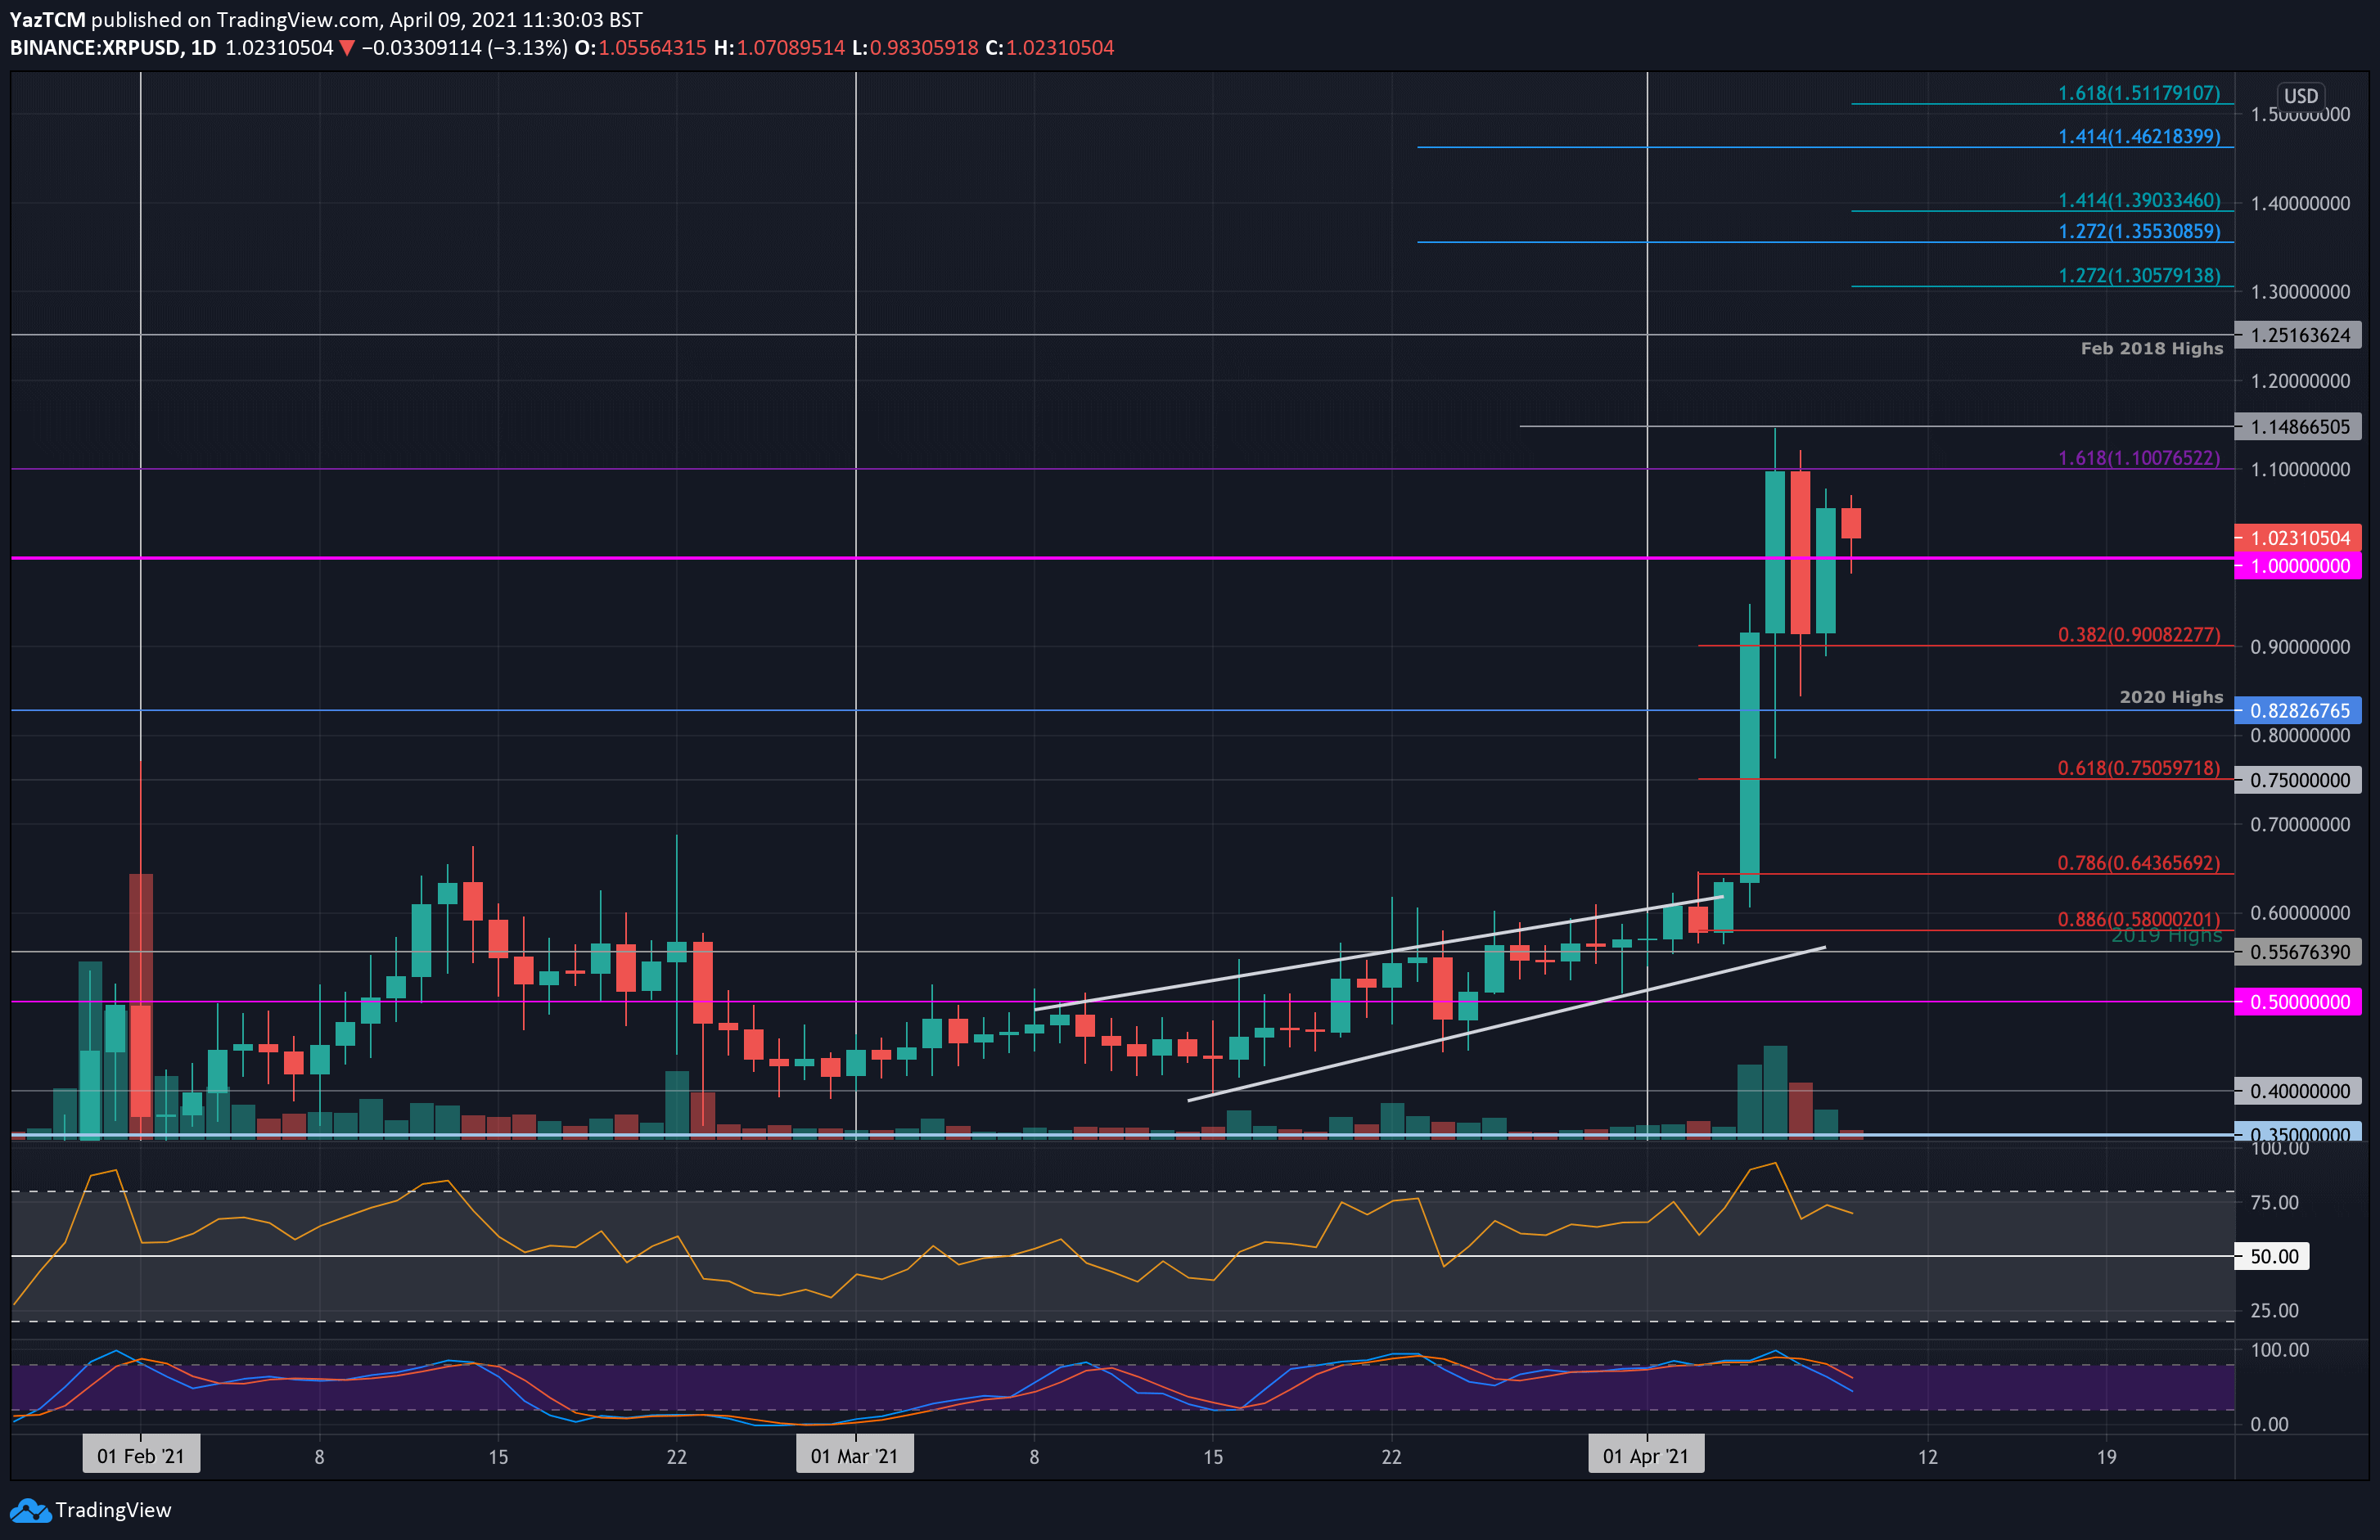
Ripple is the highest performing top-10 ranked asset this week as it exploded by a total of 80%. The cryptocurrency started the week around the 2019 highs of $0.55 as it started to surge higher.
On Monday, XRP exploded upward to reach as high as $0.9. It managed to break beyond $1.00 on Tuesday to reach as high as $1.14. Unfortunately, it was unable to break above $1.10 (1.618 Fib ExtensioN) and ended up falling lower from there on Wednesday to reach the support at $0.9 (.382 Fib).
It has since rebounded from this support as it trades above $1.00 today at $1.02.
Looking ahead, the first resistance lies at $1.10 (1.618 Fib Extension). This is followed by $1.14, $1.25 (Feb 2018 Highs), $1.30, and $1.35 (1.272 Fib Extension – blue).
On the other side, the first support lies at $1.00. This is followed by $0.9 (.382 Fib), $0.828 (2020 Highs), $0.75 (.618 Fib), and $0.7.
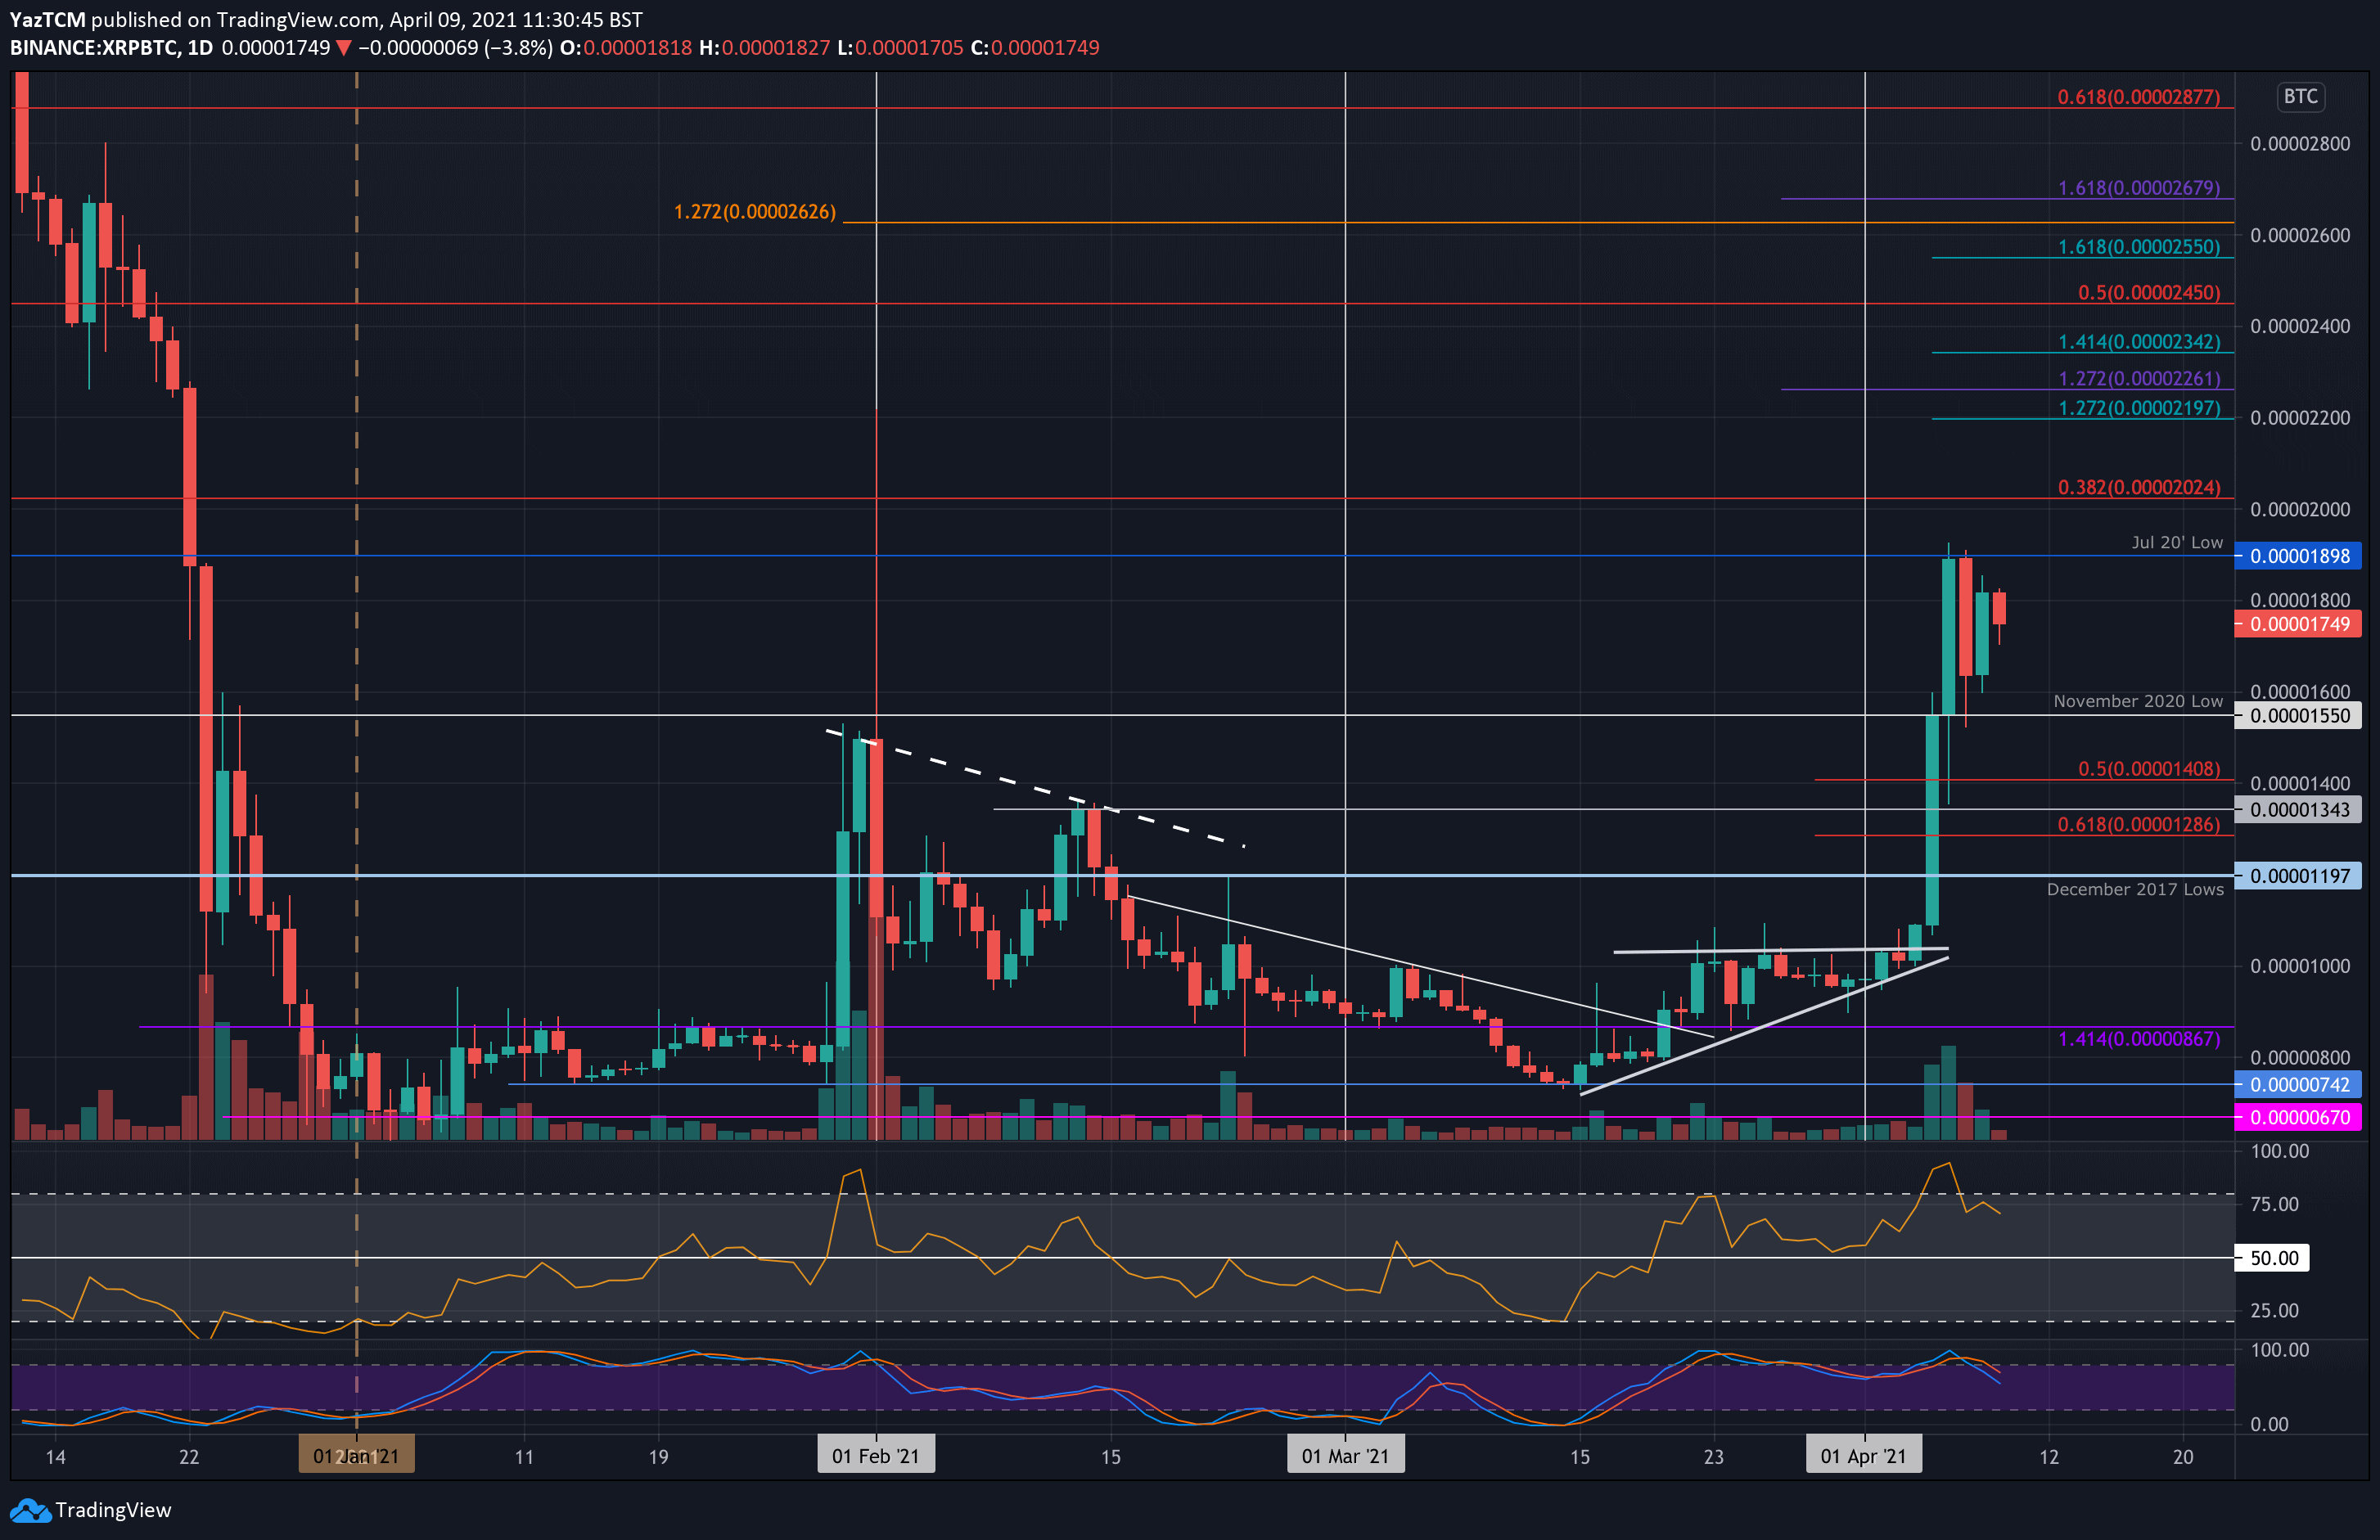
Against Bitcoin, XRP started to climb higher from 1000 SAT at the start of the week as it exploded higher to reach 1550 SAT by Monday. On Tuesday, XRP pushed further to reach the July 2020 lows at 1900 SAT. It has since dropped slightly from this high as it trades at 1750 SAT.
Looking ahead, the first level of resistance lies at 1900 SAT (July 20 low). This is followed by 2025 SAT (bearish .382 Fib), 2200 SAT (1.272 Fib Extension), 2340 SAT (1.414 Fib Extnesion), and 2450 SAT (bearish .5 Fib).
On the other side, the first support lies at 1550 SAT (November 2020 low). This is followed by 1400 SAT (.5 Fib), 1343 SAT, 1286 SAT (.618 Fib), and 1200 SAT (Dec 2017 lows).
Binance Coin
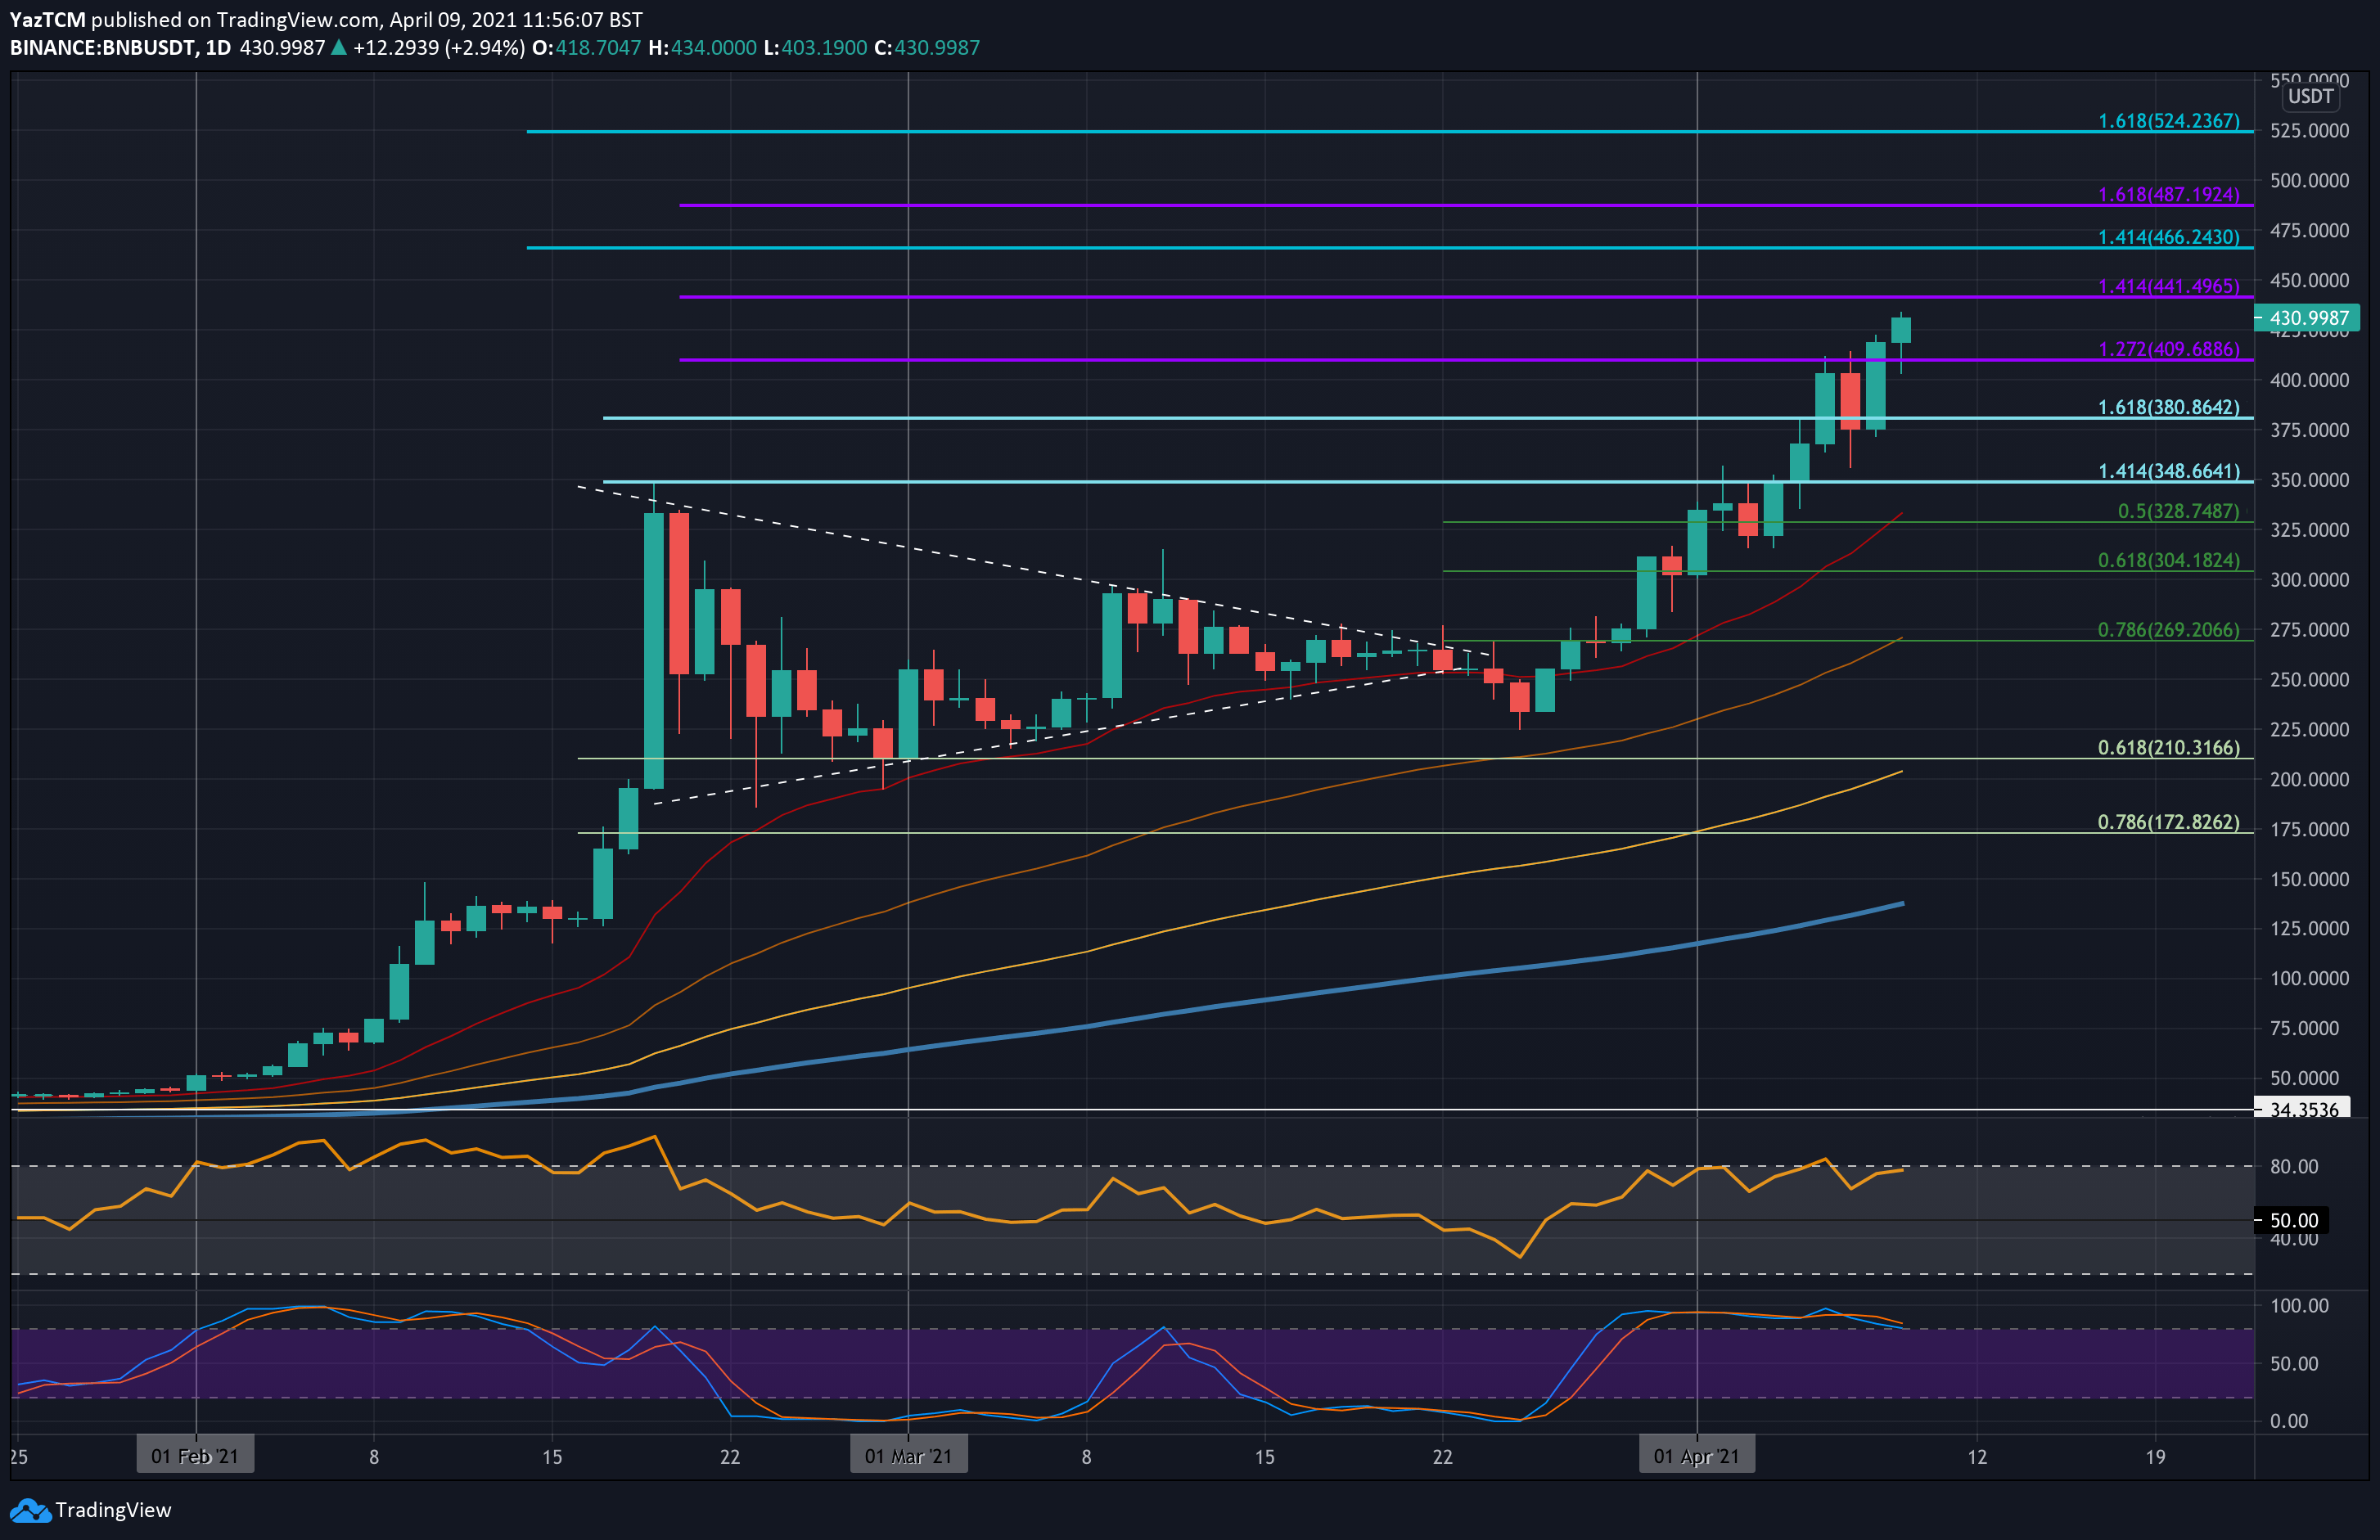
BNB is also up by an impressive 28% over the past week as it currently trades at $430. The cryptocurrency started the week beneath $325 as it started to push higher into resistance at $350 (1.414 Fib Extension).
This resistance was broken on Monday to reach as high as $380 as BNB started to set new ATH prices. Yesterday, BMB cleared the $400 resistance to reach the current $430 level today.
Looking ahead, the first resistance lies at $441.50 (1.414 Fib Extension – purple). This is followed by $450, $466 (1.414 Fib Extension – blue), $487 (1.618 Fib Extension – purple), and $500.
On the other side, the first support lies at $410. This is followed by $400, $380, $350, $328.75 (.5 Fib), and $305 (.618 Fib).
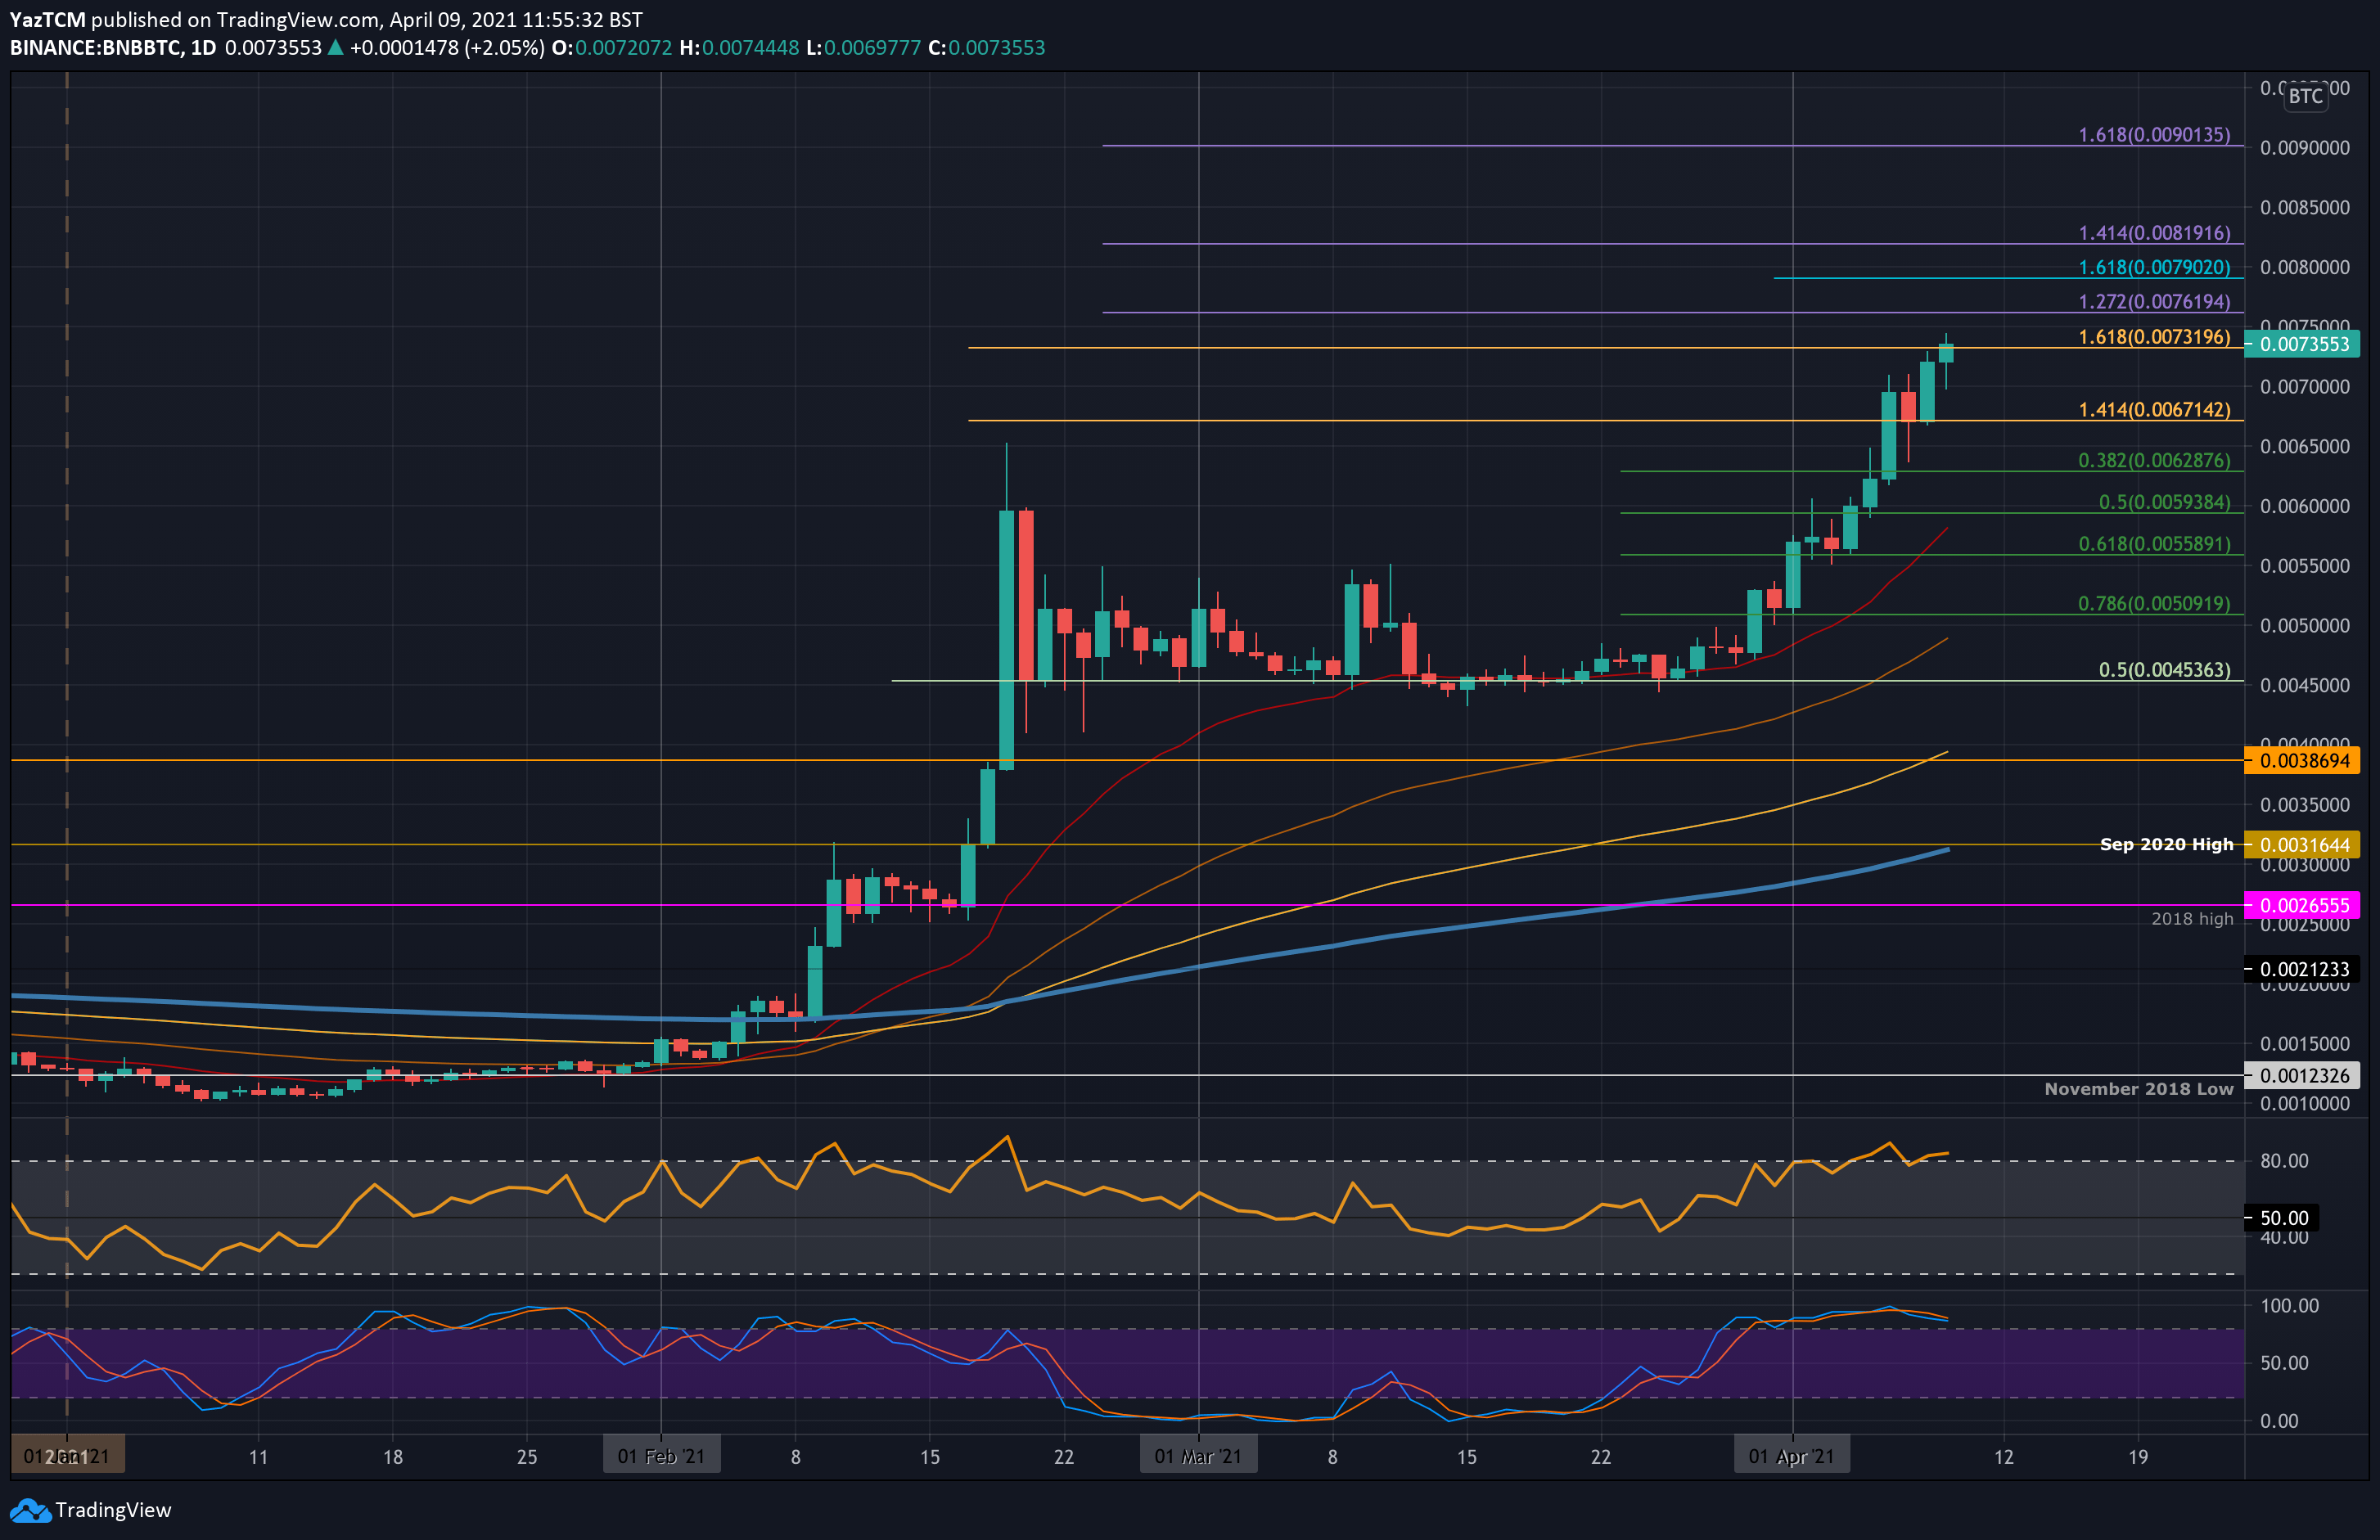
Against Bitcoin, BNB started to push higher from 0.0055 BTC at the start of the week. The cryptocurrency continues to drive higher during the course of the week to reach the current resistance at 0.00731 BTC today (1.618 Fib Extension).
Looking ahed, the first resistance lies at 0.00761 BTC (1.272 Fib Extension – purple), 0.079 BTC (1.618 Fib Extension), 0.00819 BTC (1.414 Fib Extension – purple), and 0.0085 BTC.
On the other side, the first support lies at 0.007 BTC. This is followed by 0.0067 BTC, 0.00628 BTC (.382 Fib), 0.00593 BTC (.5 Fib), and 0.00559 BTC (.618 Fib).
Cardano
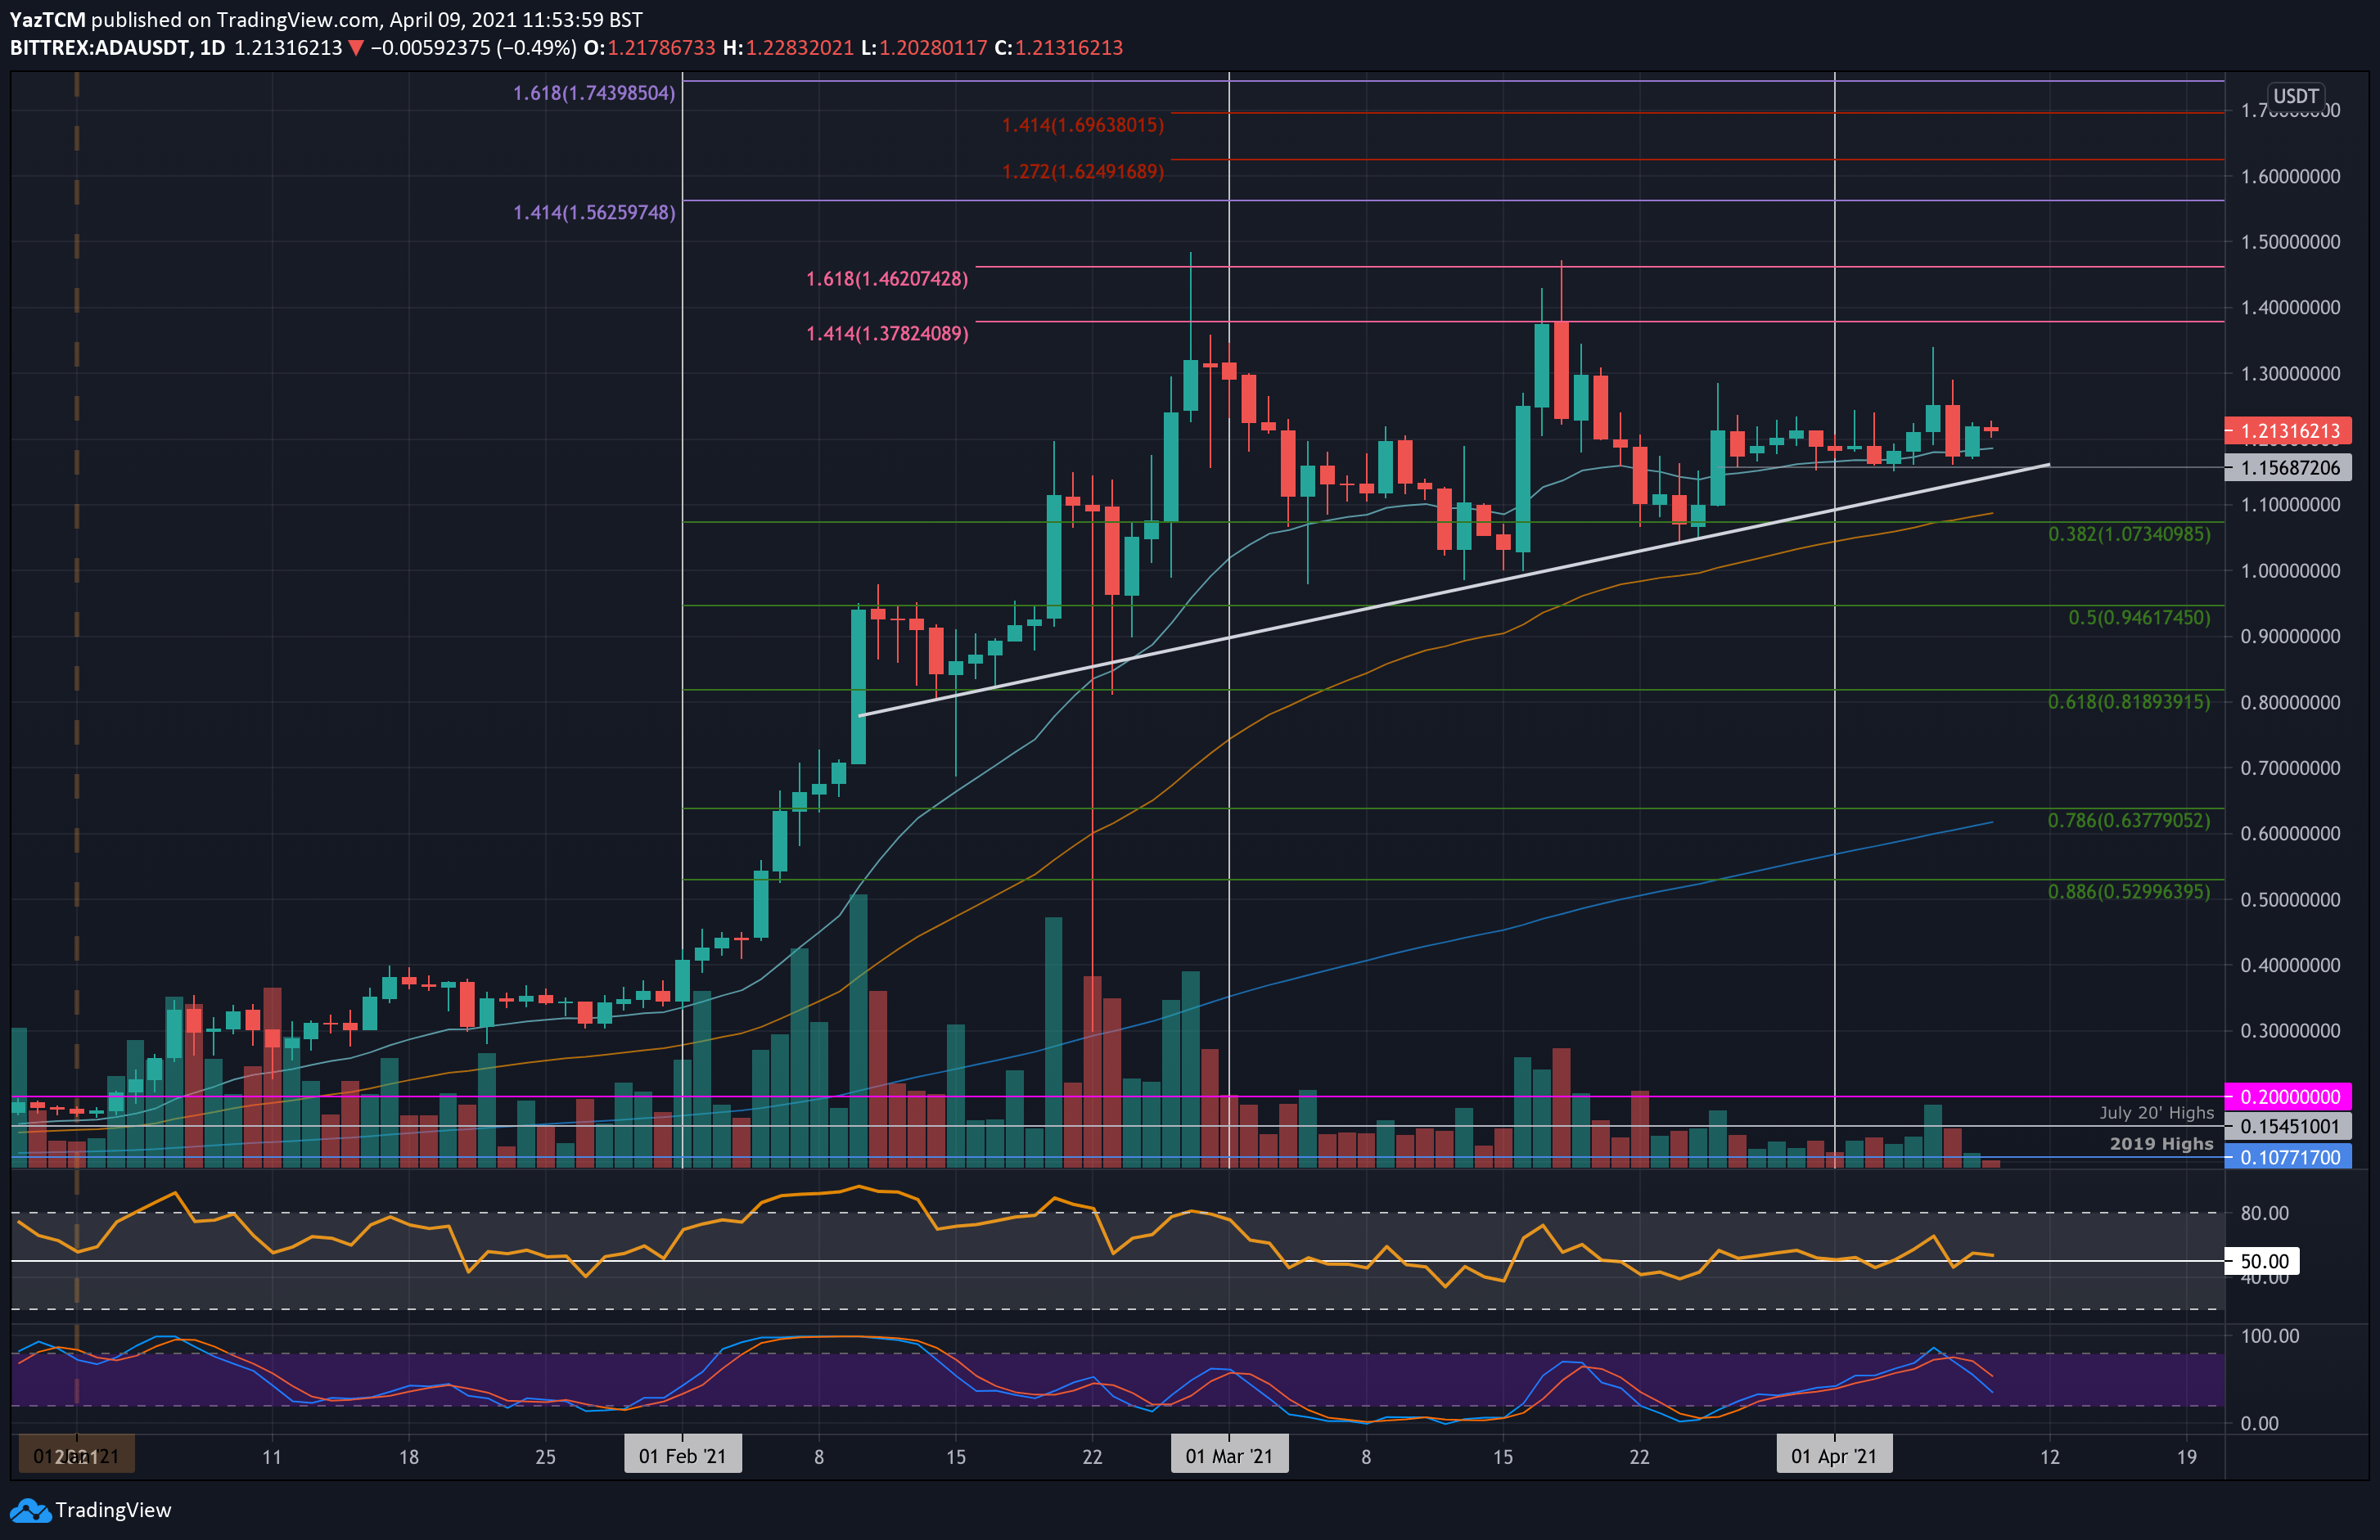
Cardano pretty much moved sideways this week, only managing a small 2.5% price hike over the period as it currently trades at $1.22. The cryptocurrency has established strong support in April at the $1.15 level and even managed to spike as high as $1.35 during the course of the week.
However, on Wednesday, the price increase was reversed as ADA dropped back into the support at $1.15 again. It has since bounced from there as it now trades around $1.21.
Looking ahead, the first level of strong resistance lies at $1.25. This is followed by $1.30, $1.37 (1.414 Fib Extension), $1.46 (1.618 Fib Extension), and $1.60.
On the other side, the first support lies at $1.15. This is followed by $1.07 (.382 Fib), $1.00, and $0.95 (.5 Fib).
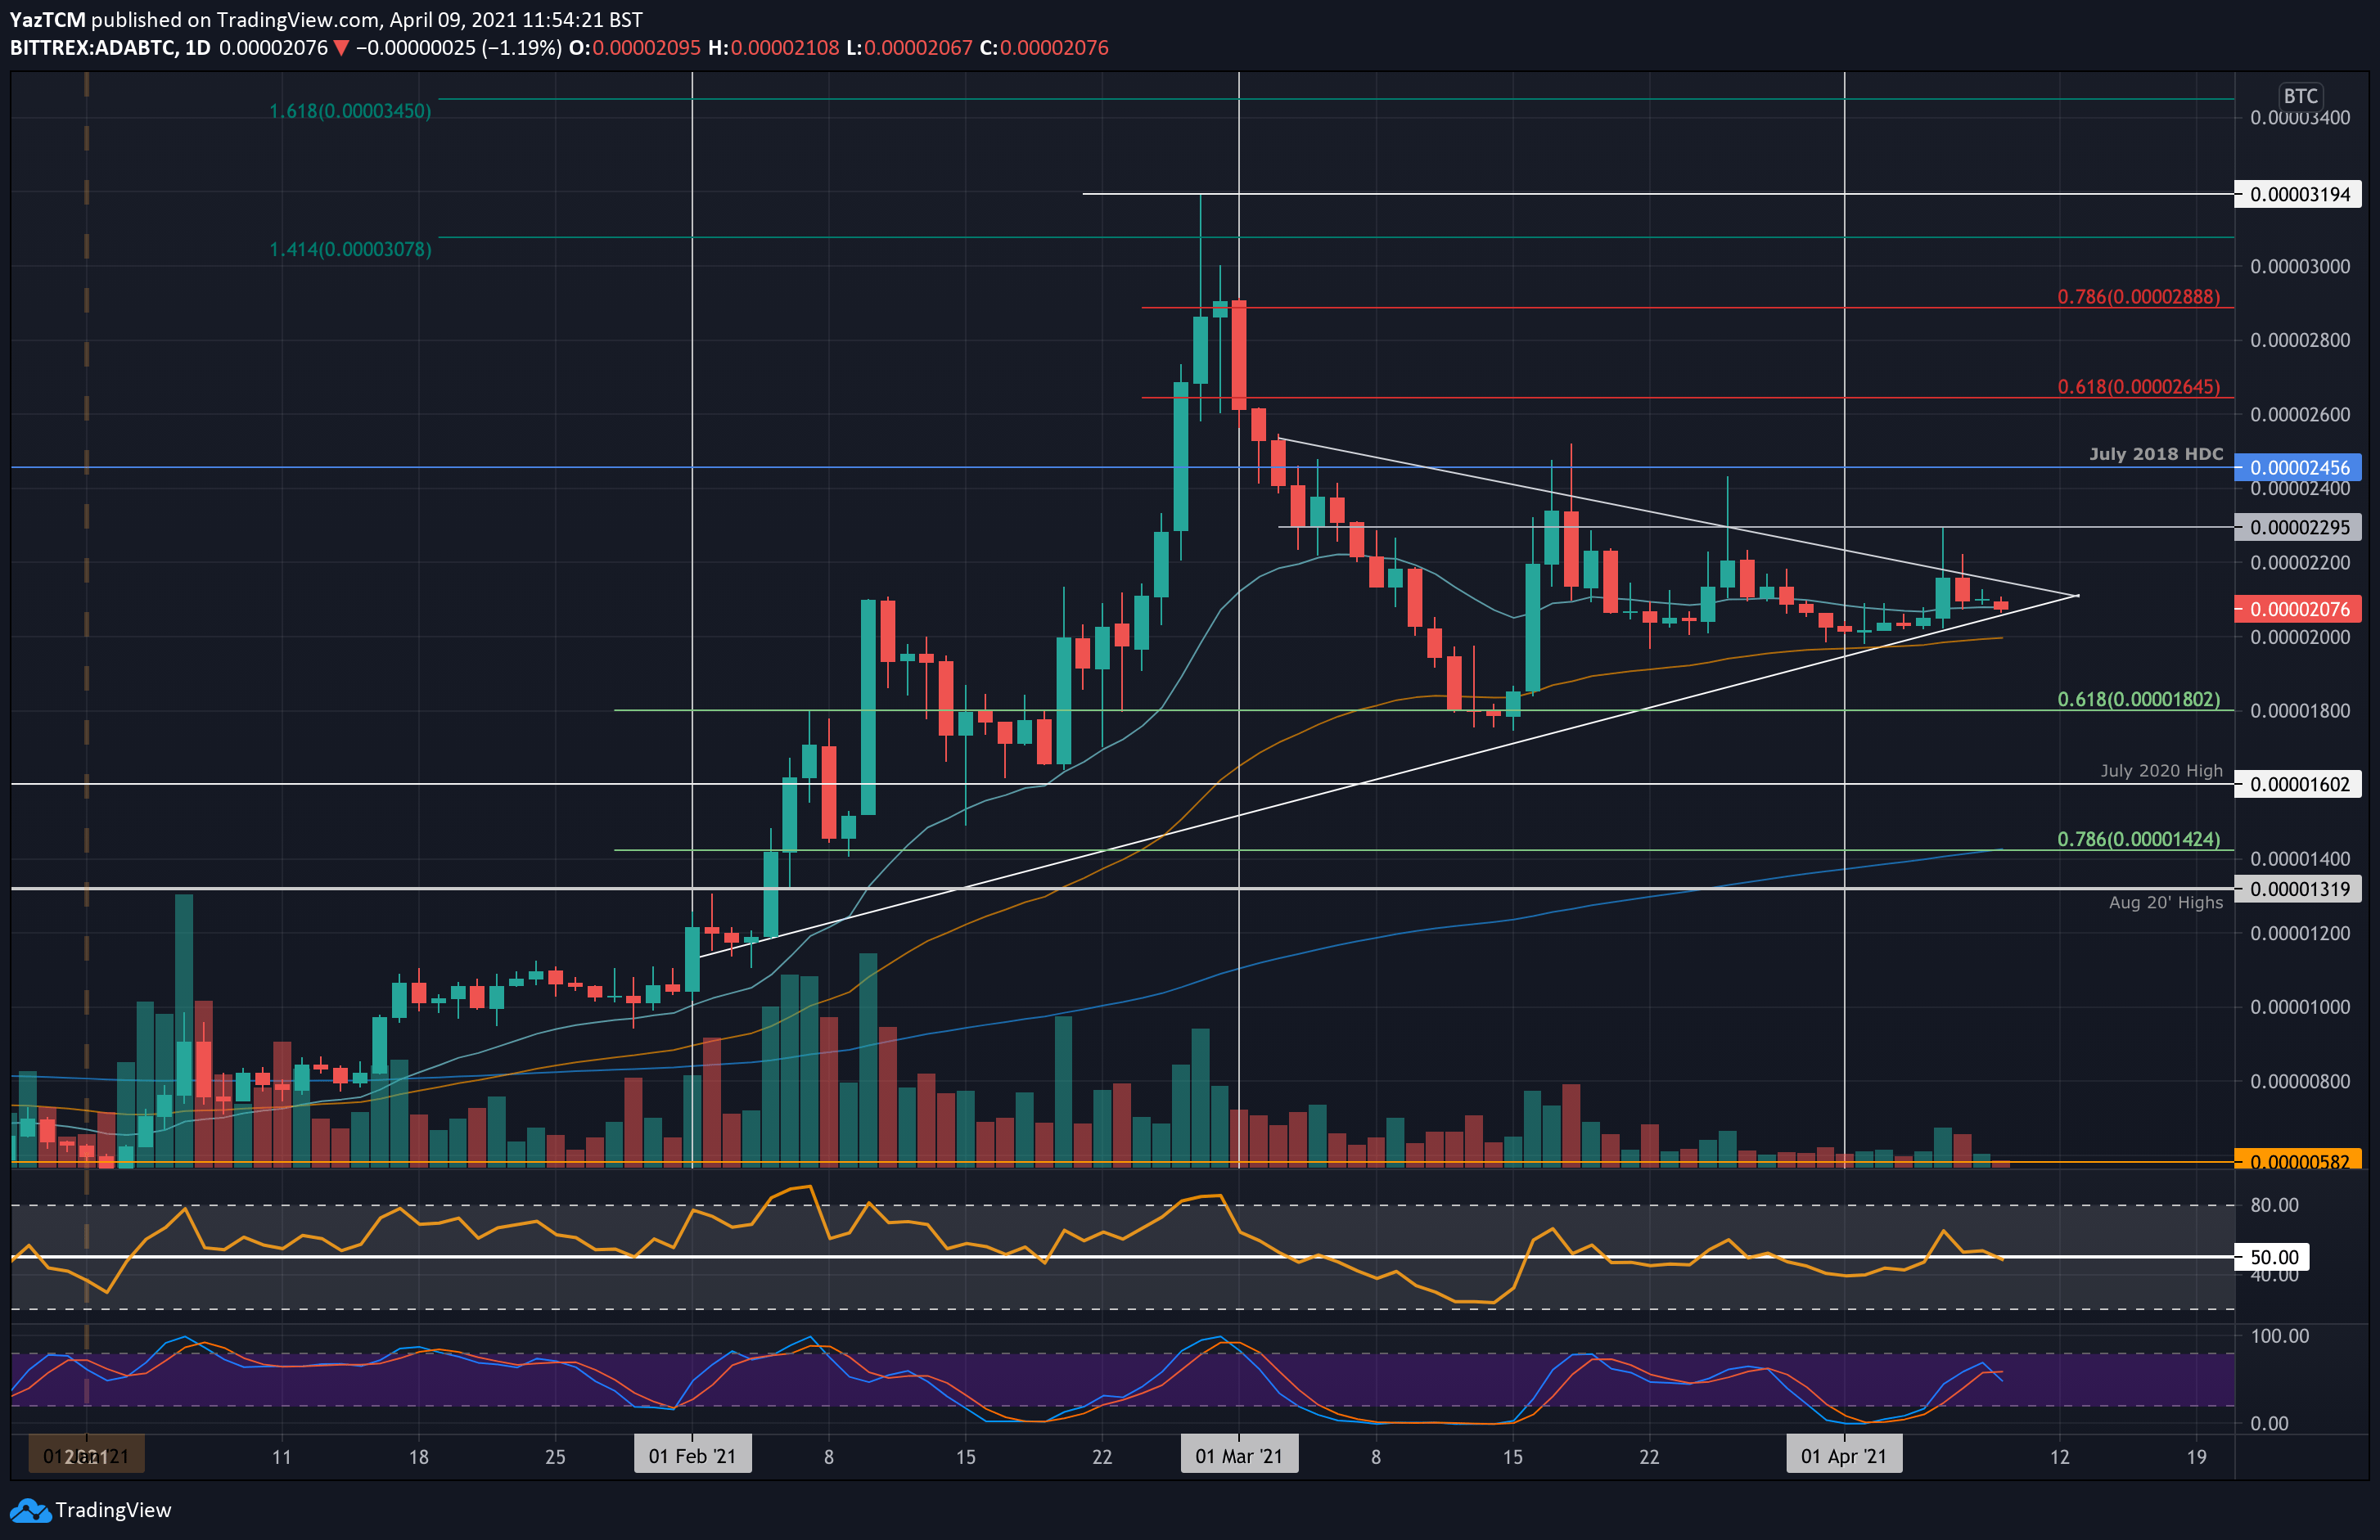
Against Bitcoin, ADA is currently trading inside a symmetrical triangle pattern as it approaches the apex of the consolidation phase. The coin did try and break above the pattern this week and even managed to reach as high as 2295 SAT. However, it failed to close a daily candle above the triangle.
The cryptocurrency is right at the apex of the triangle, where a breakout can be expected in either direction. Unfortunately, with bearish momentum creeping into the market, it does look likely that ADA will break toward the downside of the pattern.
Looking ahead, the first level of support beneath the pattern lies at 2000 SAT (50-days EMA). This is followed by 1800 SAT (.618 Fib), 1600 SAT (July 2020 high), and 1425 SAT (.786 Fib & 200-days EMA).
On the other side, above the triangle, resistance lies at 2000 SAT, 2295 SAT, 2456 SAT (July 2018 High-Day close), and 2645 SAT (bearish .618 Fib).