BitcoinBitcoin is up by a solid 28.2% this week as the coin set a new ATH today at ,000. The cryptocurrency had penetrated above the previous consolidation pattern at the start of the month and started to push higher over the past week.On Monday, BTC surged from ,800 to reach the resistance at ,427 (1.618 Fib Extension – red). There, it established an ascending price channel. It took a couple of days for BTC to break that level.Today, Bitcoin climbed higher to set the new ATH at ,000.Looking ahead, the first level of resistance lies at ,000 and the upper boundary of the price channel. This is followed by ,400 (1.414 Fib Extension – yellow), ,378, ,400 (1.272 Fib Extension – purple), and ,500 (1.618 Fib Extension – yellow).On the other side, the first support lies
Topics:
Yaz Sheikh considers the following as important: ADABTC, ADAUSD, Binance Coin (BNB) Price, Bitcoin (BTC) Price, BNBBTC, bnbusd, BTC Analysis, BTCEUR, BTCGBP, btcusd, btcusdt, Cardano (ADA) Price, ETHBTC, Ethereum (ETH) Price, ethusd, Market Updates, Price Analysis, Ripple (XRP) Price, XRP Analysis, xrpbtc, xrpusd
This could be interesting, too:
Mandy Williams writes Bitcoin ETFs Record Over .6B in Outflows in the Past 2 Weeks
Dimitar Dzhondzhorov writes Millions of ADA Sold by Cardano Whales During Market Crash – Will the Decline Continue?
Chayanika Deka writes Bitcoin Whales Offload 6,813 BTC as Selling Pressure Mounts
Wayne Jones writes Bitcoin Sentiment Hits 2022 Lows as Fear & Greed Index Falls to 10
Bitcoin
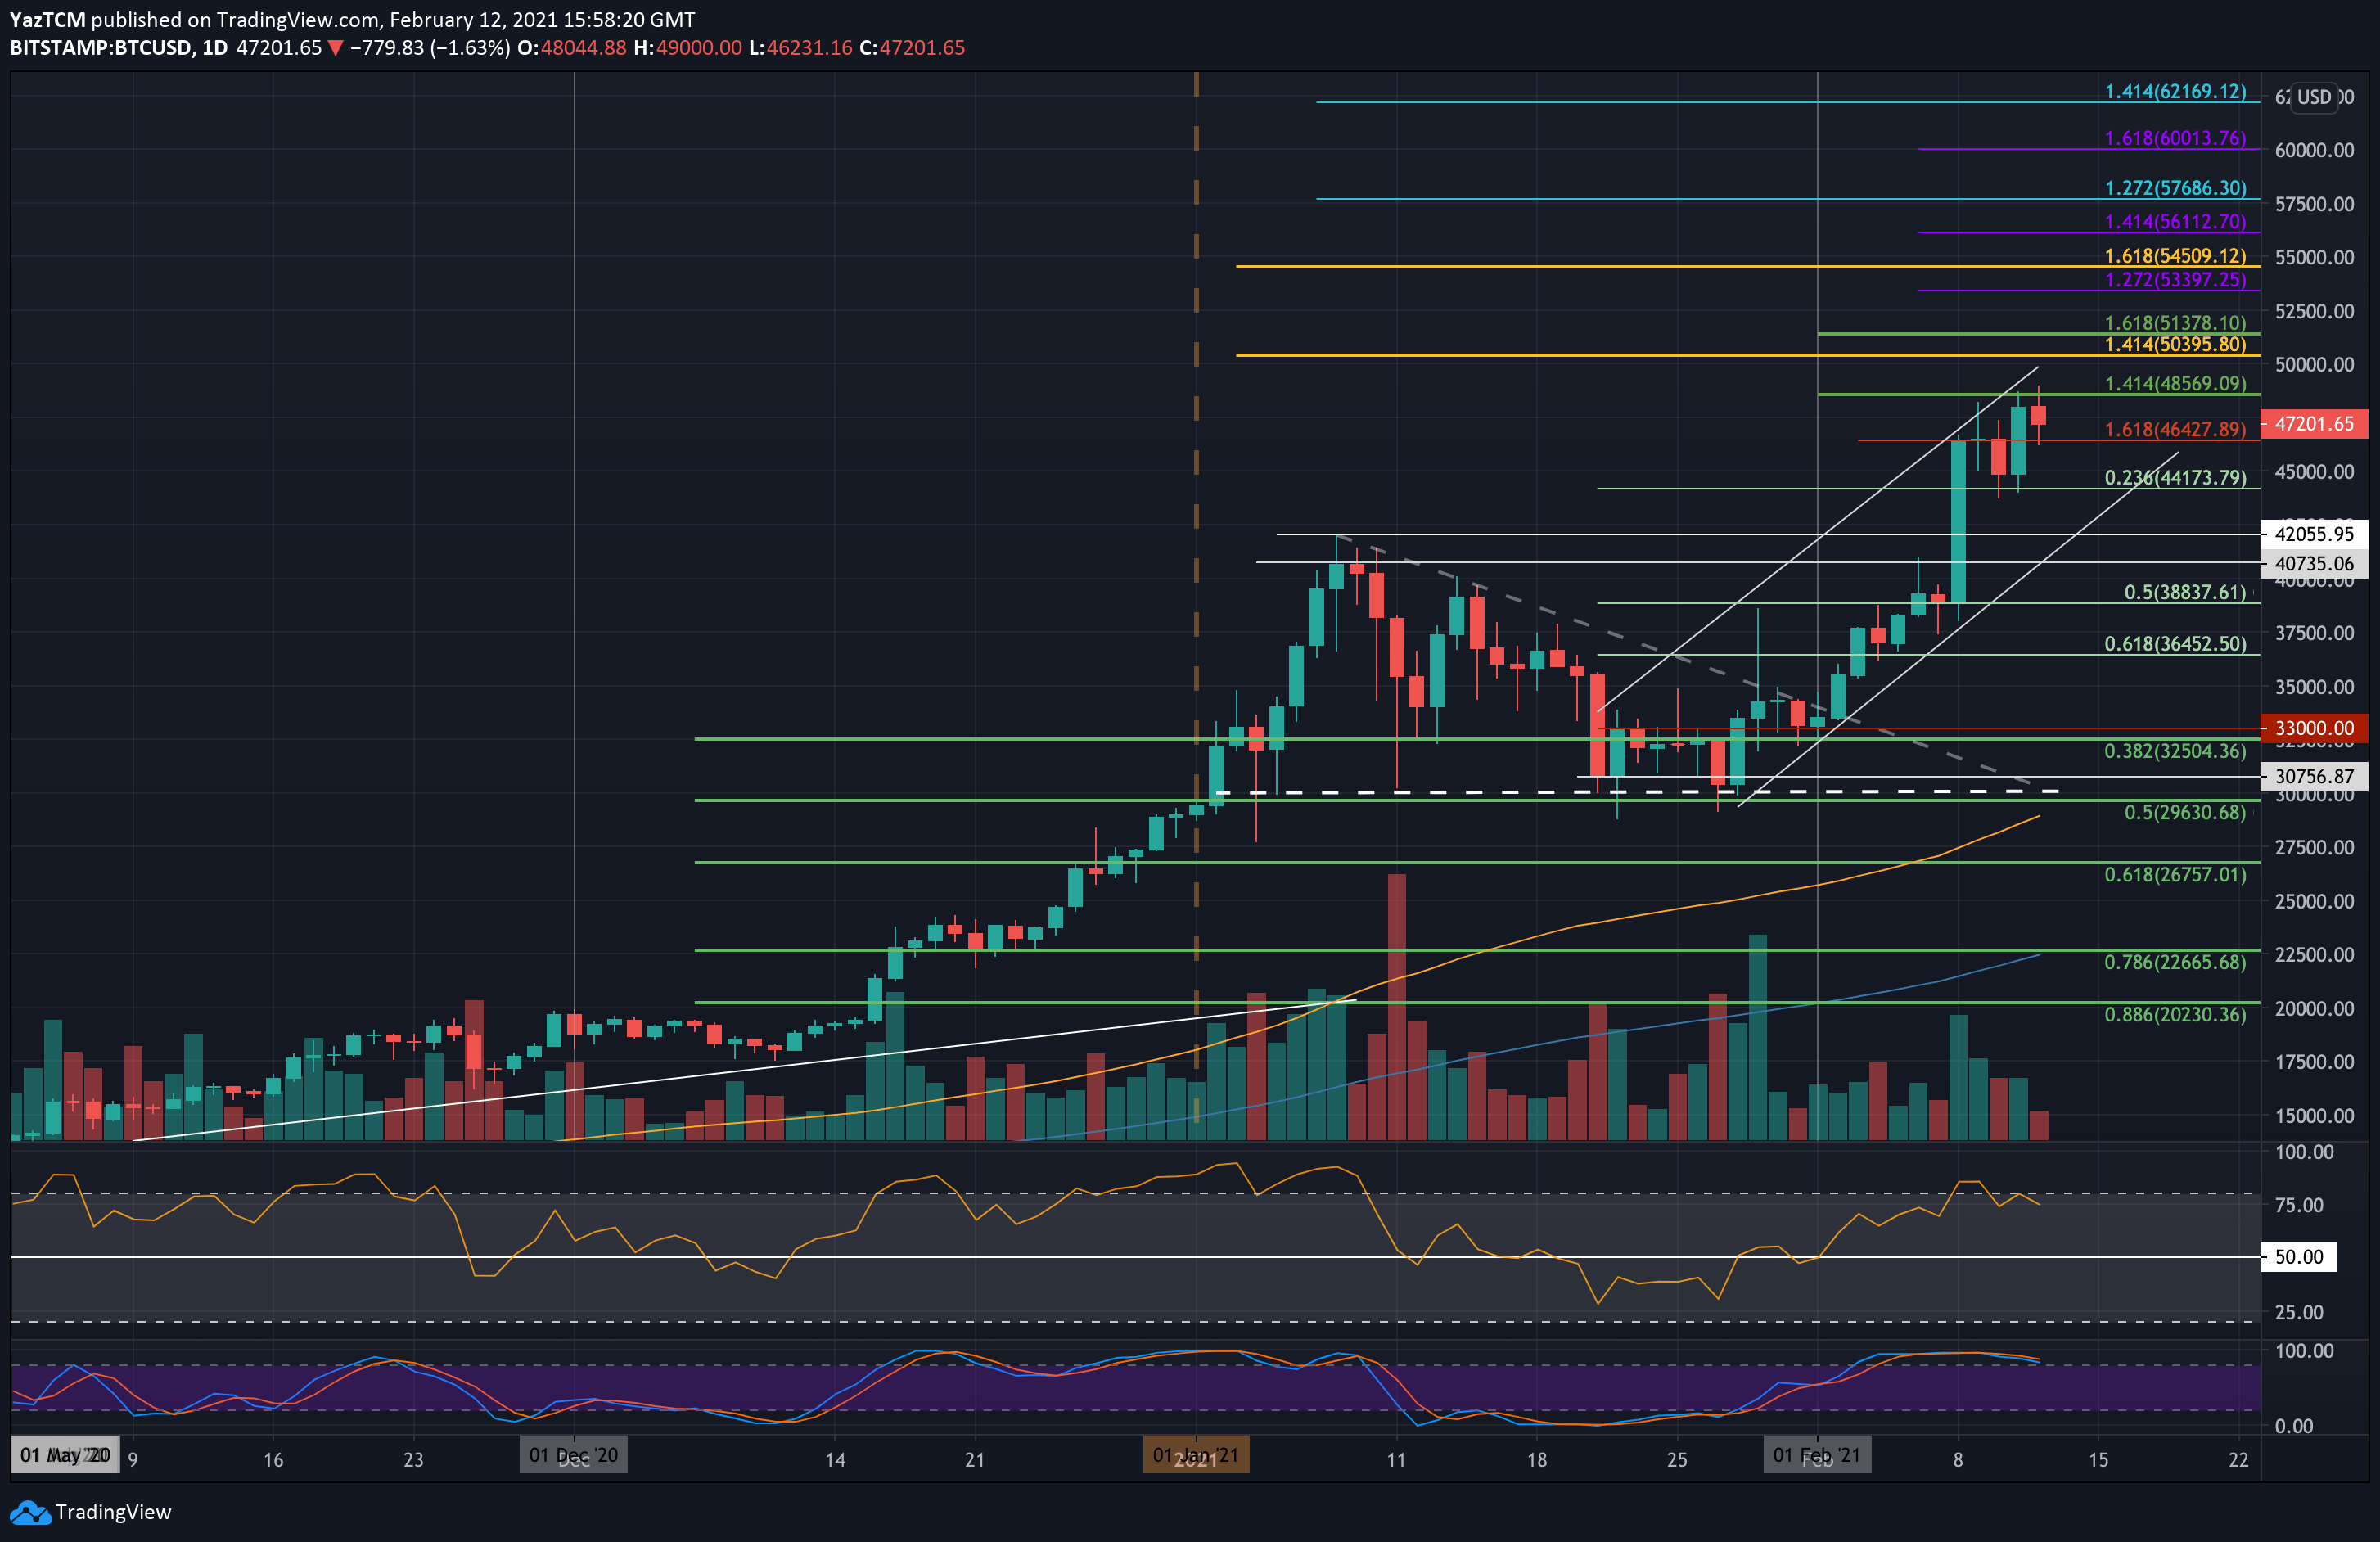
Bitcoin is up by a solid 28.2% this week as the coin set a new ATH today at $49,000. The cryptocurrency had penetrated above the previous consolidation pattern at the start of the month and started to push higher over the past week.
On Monday, BTC surged from $38,800 to reach the resistance at $46,427 (1.618 Fib Extension – red). There, it established an ascending price channel. It took a couple of days for BTC to break that level.
Today, Bitcoin climbed higher to set the new ATH at $49,000.
Looking ahead, the first level of resistance lies at $50,000 and the upper boundary of the price channel. This is followed by $50,400 (1.414 Fib Extension – yellow), $51,378, $53,400 (1.272 Fib Extension – purple), and $54,500 (1.618 Fib Extension – yellow).
On the other side, the first support lies at $46,427. This is followed by $45,000, $44,175 (.236 FIb), $42,000 (previous ATH & lower boundary of the price channel), and $40,735.
Ethereum
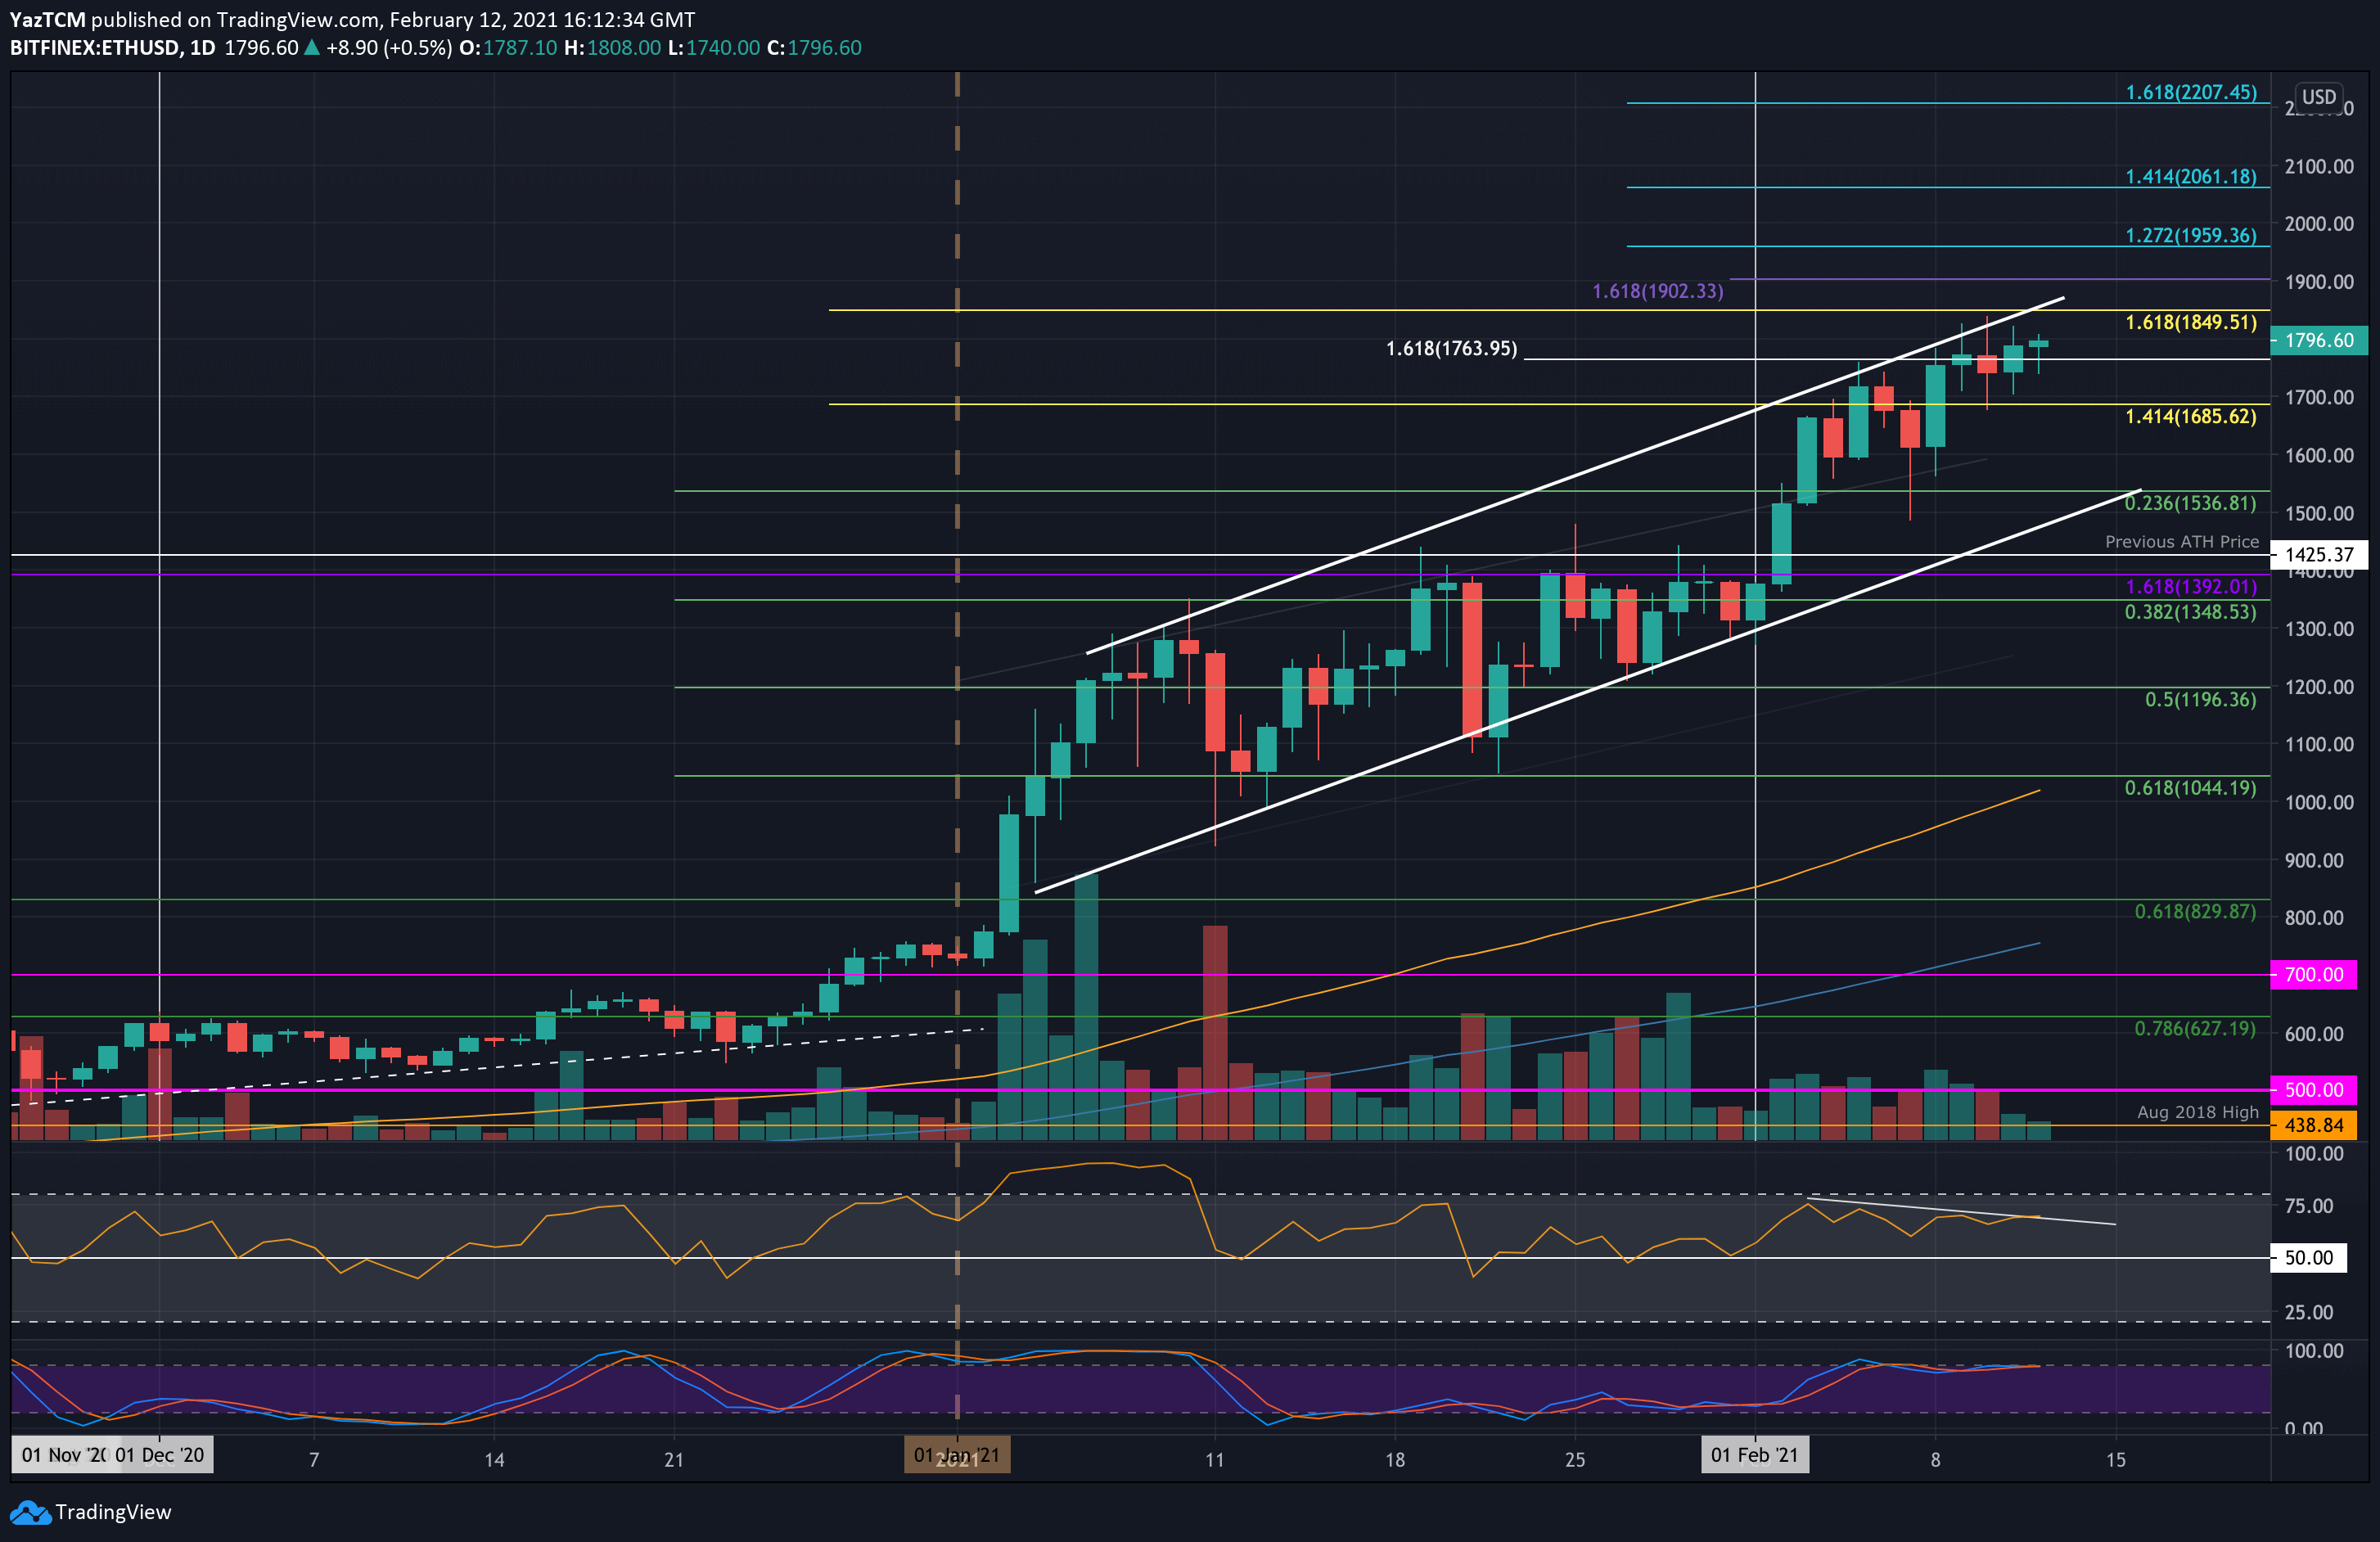
Ethereum is up by a smaller 14% this week as it is currently battling to conquer the resistance at $1800. It is now trading within a new ascending price channel as it wrestles with its upper boundary.
Looking ahead, if the bulls can break $1800, the first level of resistance lies at $1950 (1.618 Fib Extension – yellow). This is followed by $1900, $1960 (1.272 Fib Extension), $2000, and $2061 (1.414 Fib Extension).
On the other side, the first support lies at $1700. This is followed by $1600, $1536 (.236 Fib & lower boundary of the price channel), $1425 (previous ATH), and $1350 (.382 Fib).
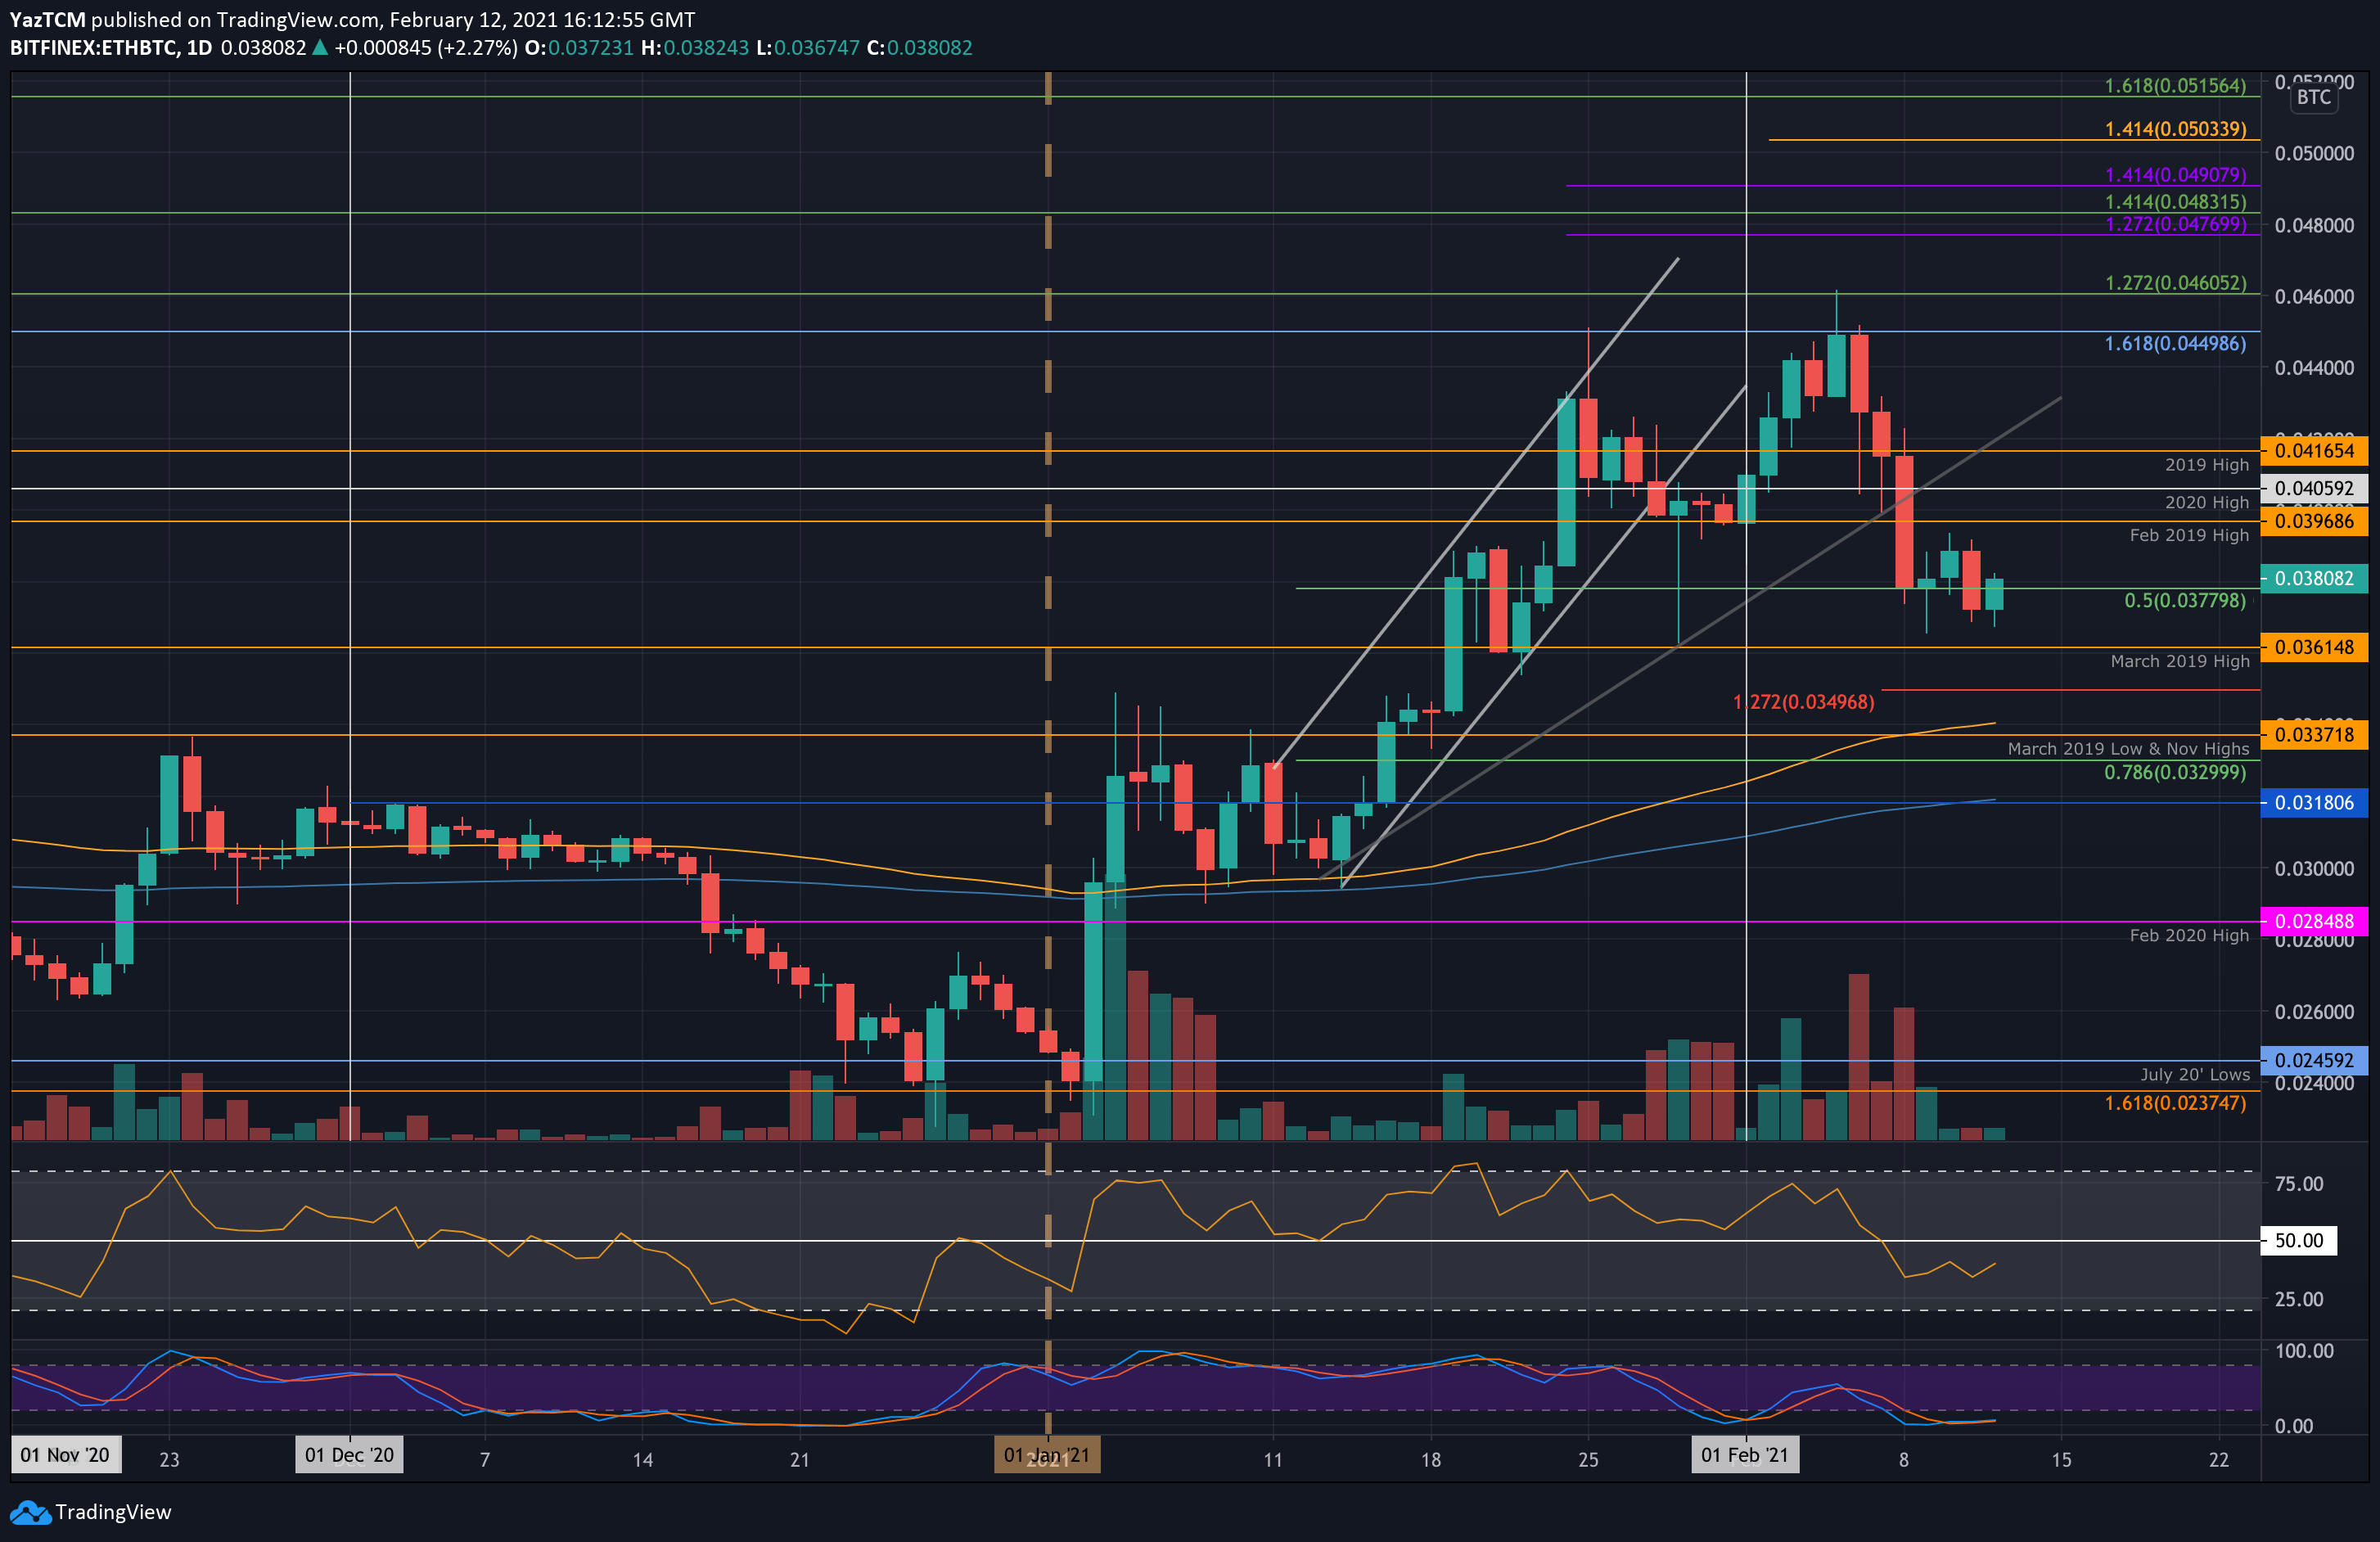
Ethereum has been struggling against Bitcoin this week as it is down by 20% from the February high of 0.046 BTC. The coin initially found support at 0.0377 BTC but fell beneath there yesterday to close the daily candle at around 0.0371 BTC. It has since rebounded and is trading back above 0.038 BTC.
Looking ahead, the first resistance lies at 0.0396 BTC (Feb 2019 High). Beyond 0.04 BTC, resistance lies at 0.0405 BTC (2020 high), 0.0416 BTC (2019 HIgh), and 0.044 BTC.
On the other side, the first support lies at 0.0377 BTC (.5 Fib). This is followed by 0.0371 BTC, 0.0361 BTC (March 2019 High), 0.0349 BTC (downside 1.272 Fib Extension), and 0.0337 BTC.
Ripple
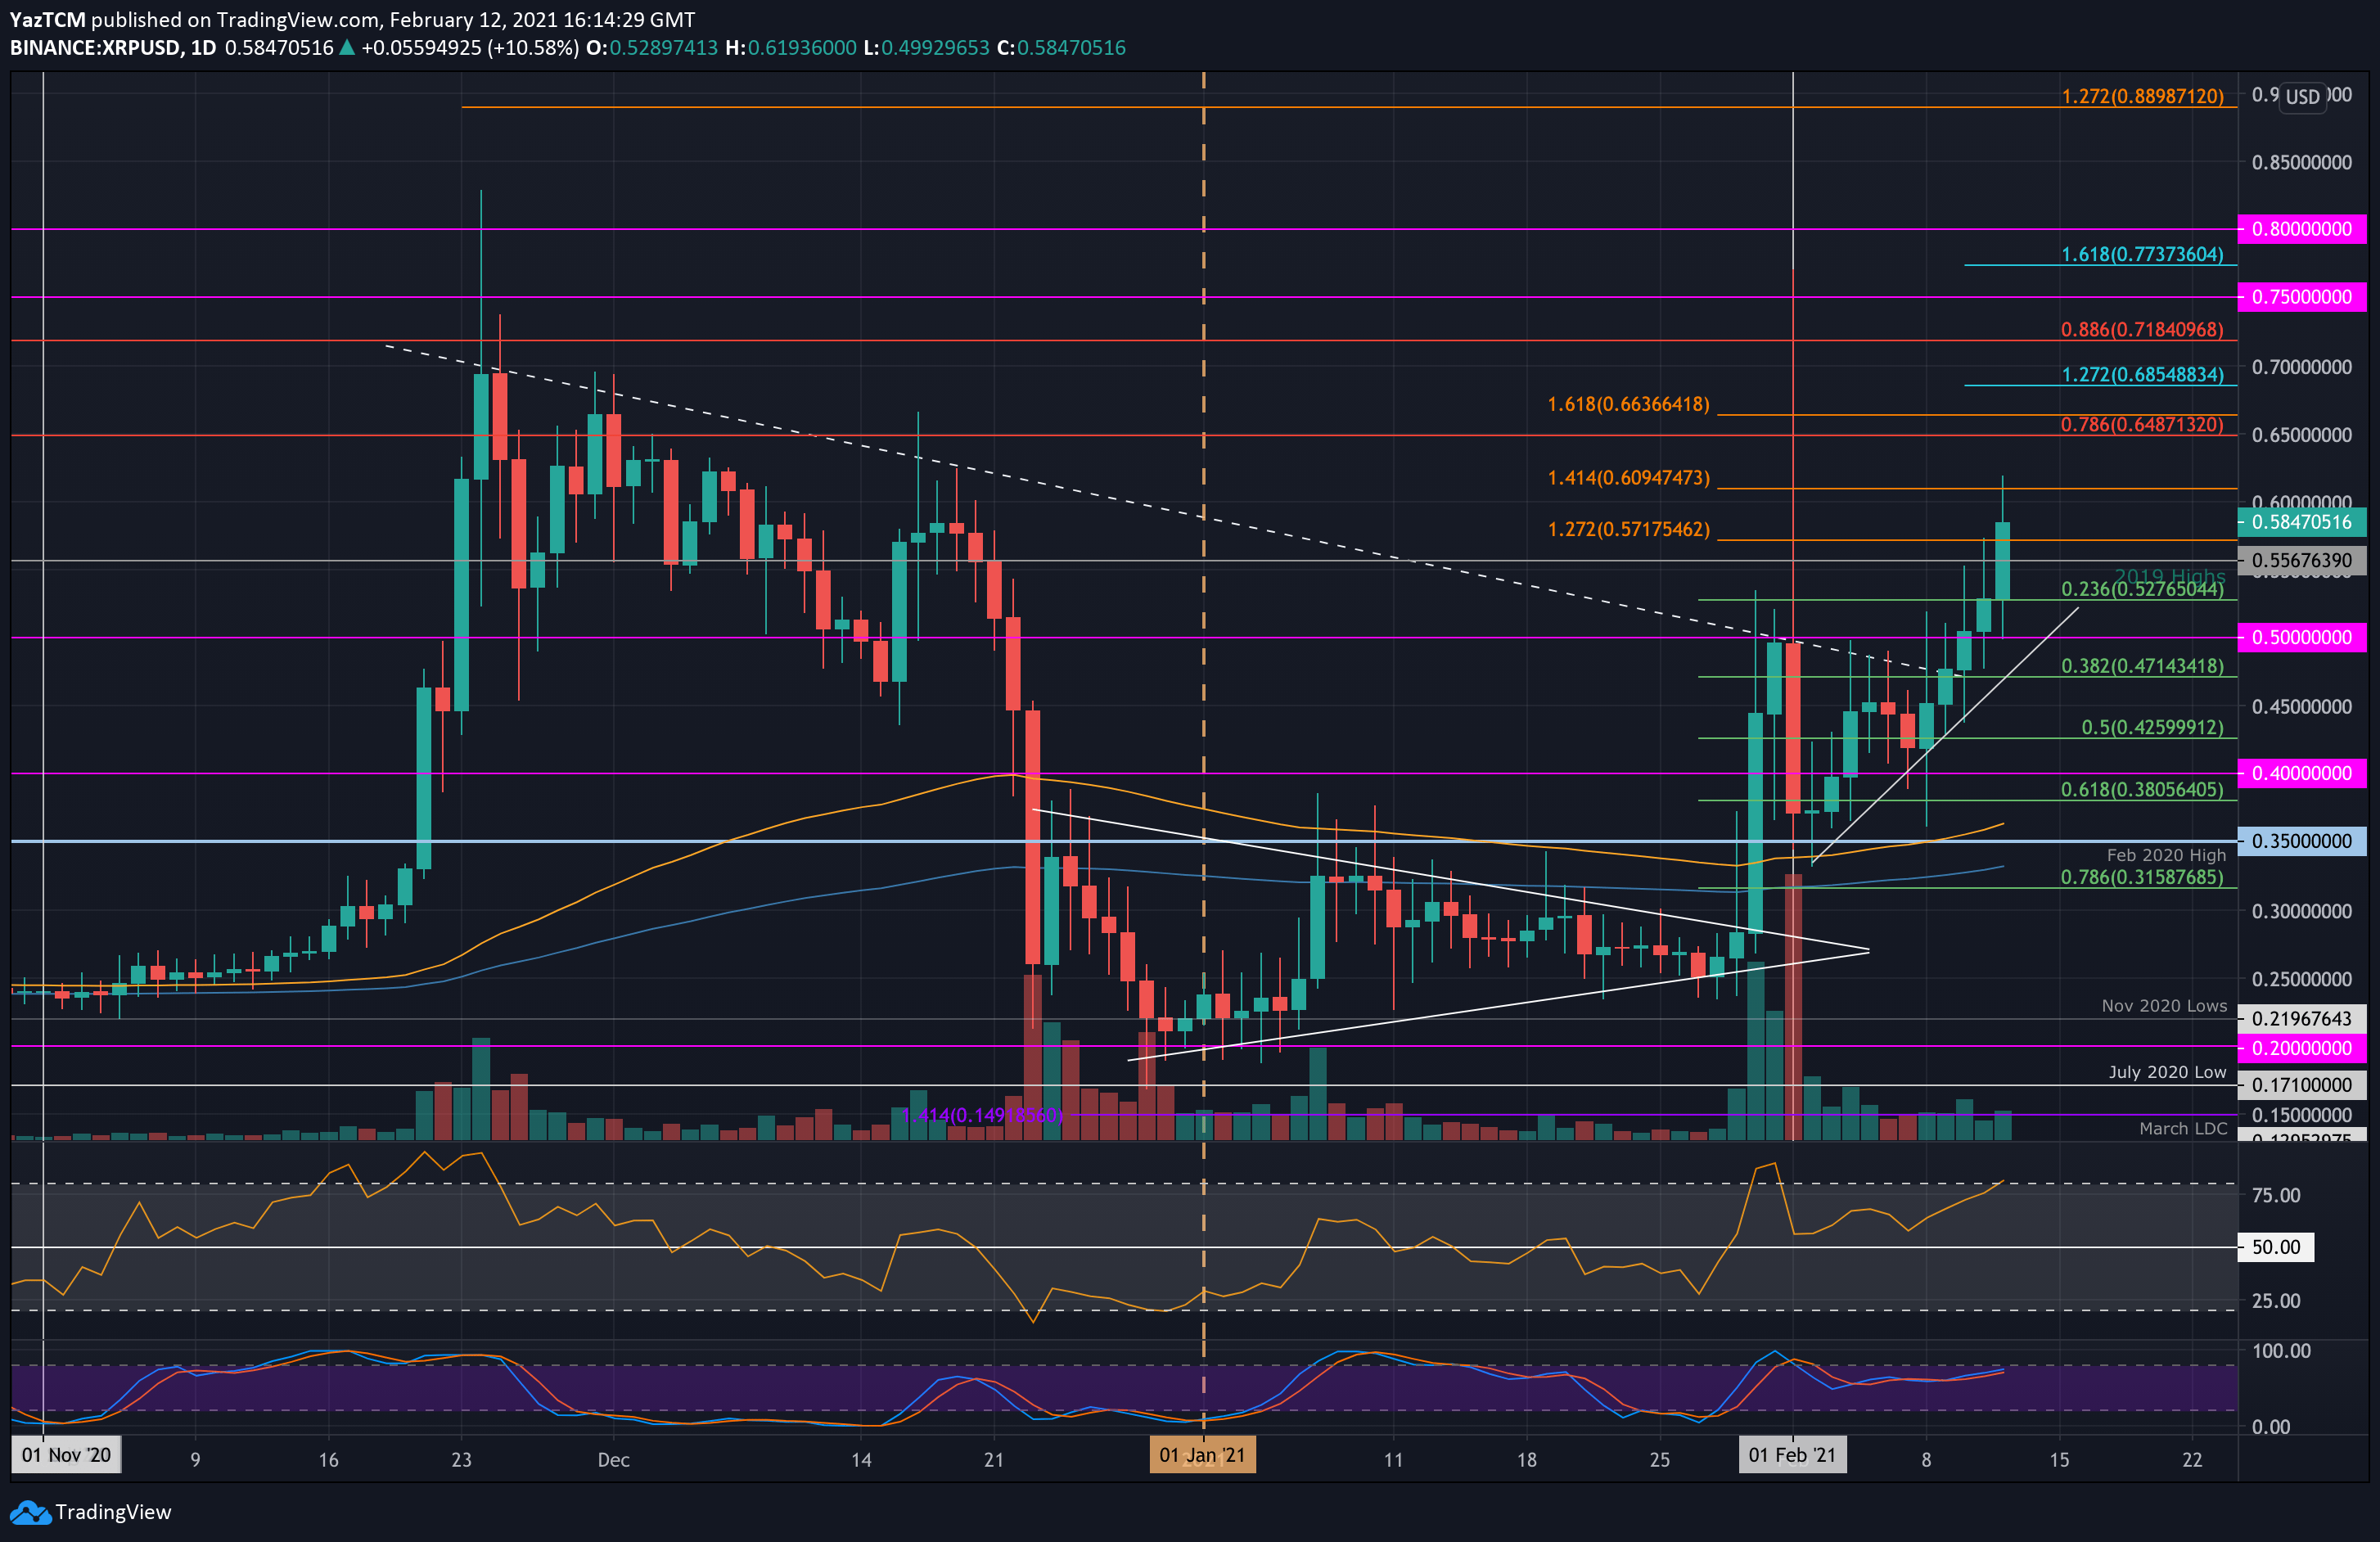
XRP is back on the ascent as it surged by a total of 30.8% this week to break back above $0.5. Last week, XRP was struggling to break resistance at a descending trend line that dated back to early December 2020.
This descending trend line was finally penetrated on Wednesday, which allowed it to break above $0.5. It continued higher from there, reaching as high as $0.61 today. It has since dropped slightly to trade at $0.585.
Looking ahead, the first resistance lies at $0.61. This is followed by $0.65 (bearish .786 Fib), $0.663, $0.685, and $0.718 (bearish .886 Fib).
On the other side, the first support lies at $0.556 (2019 Highs). This is followed by $0.527 (.236 Fib), $0.5, $0.471 (.382 Fib), and $0.435 (.5 Fib).
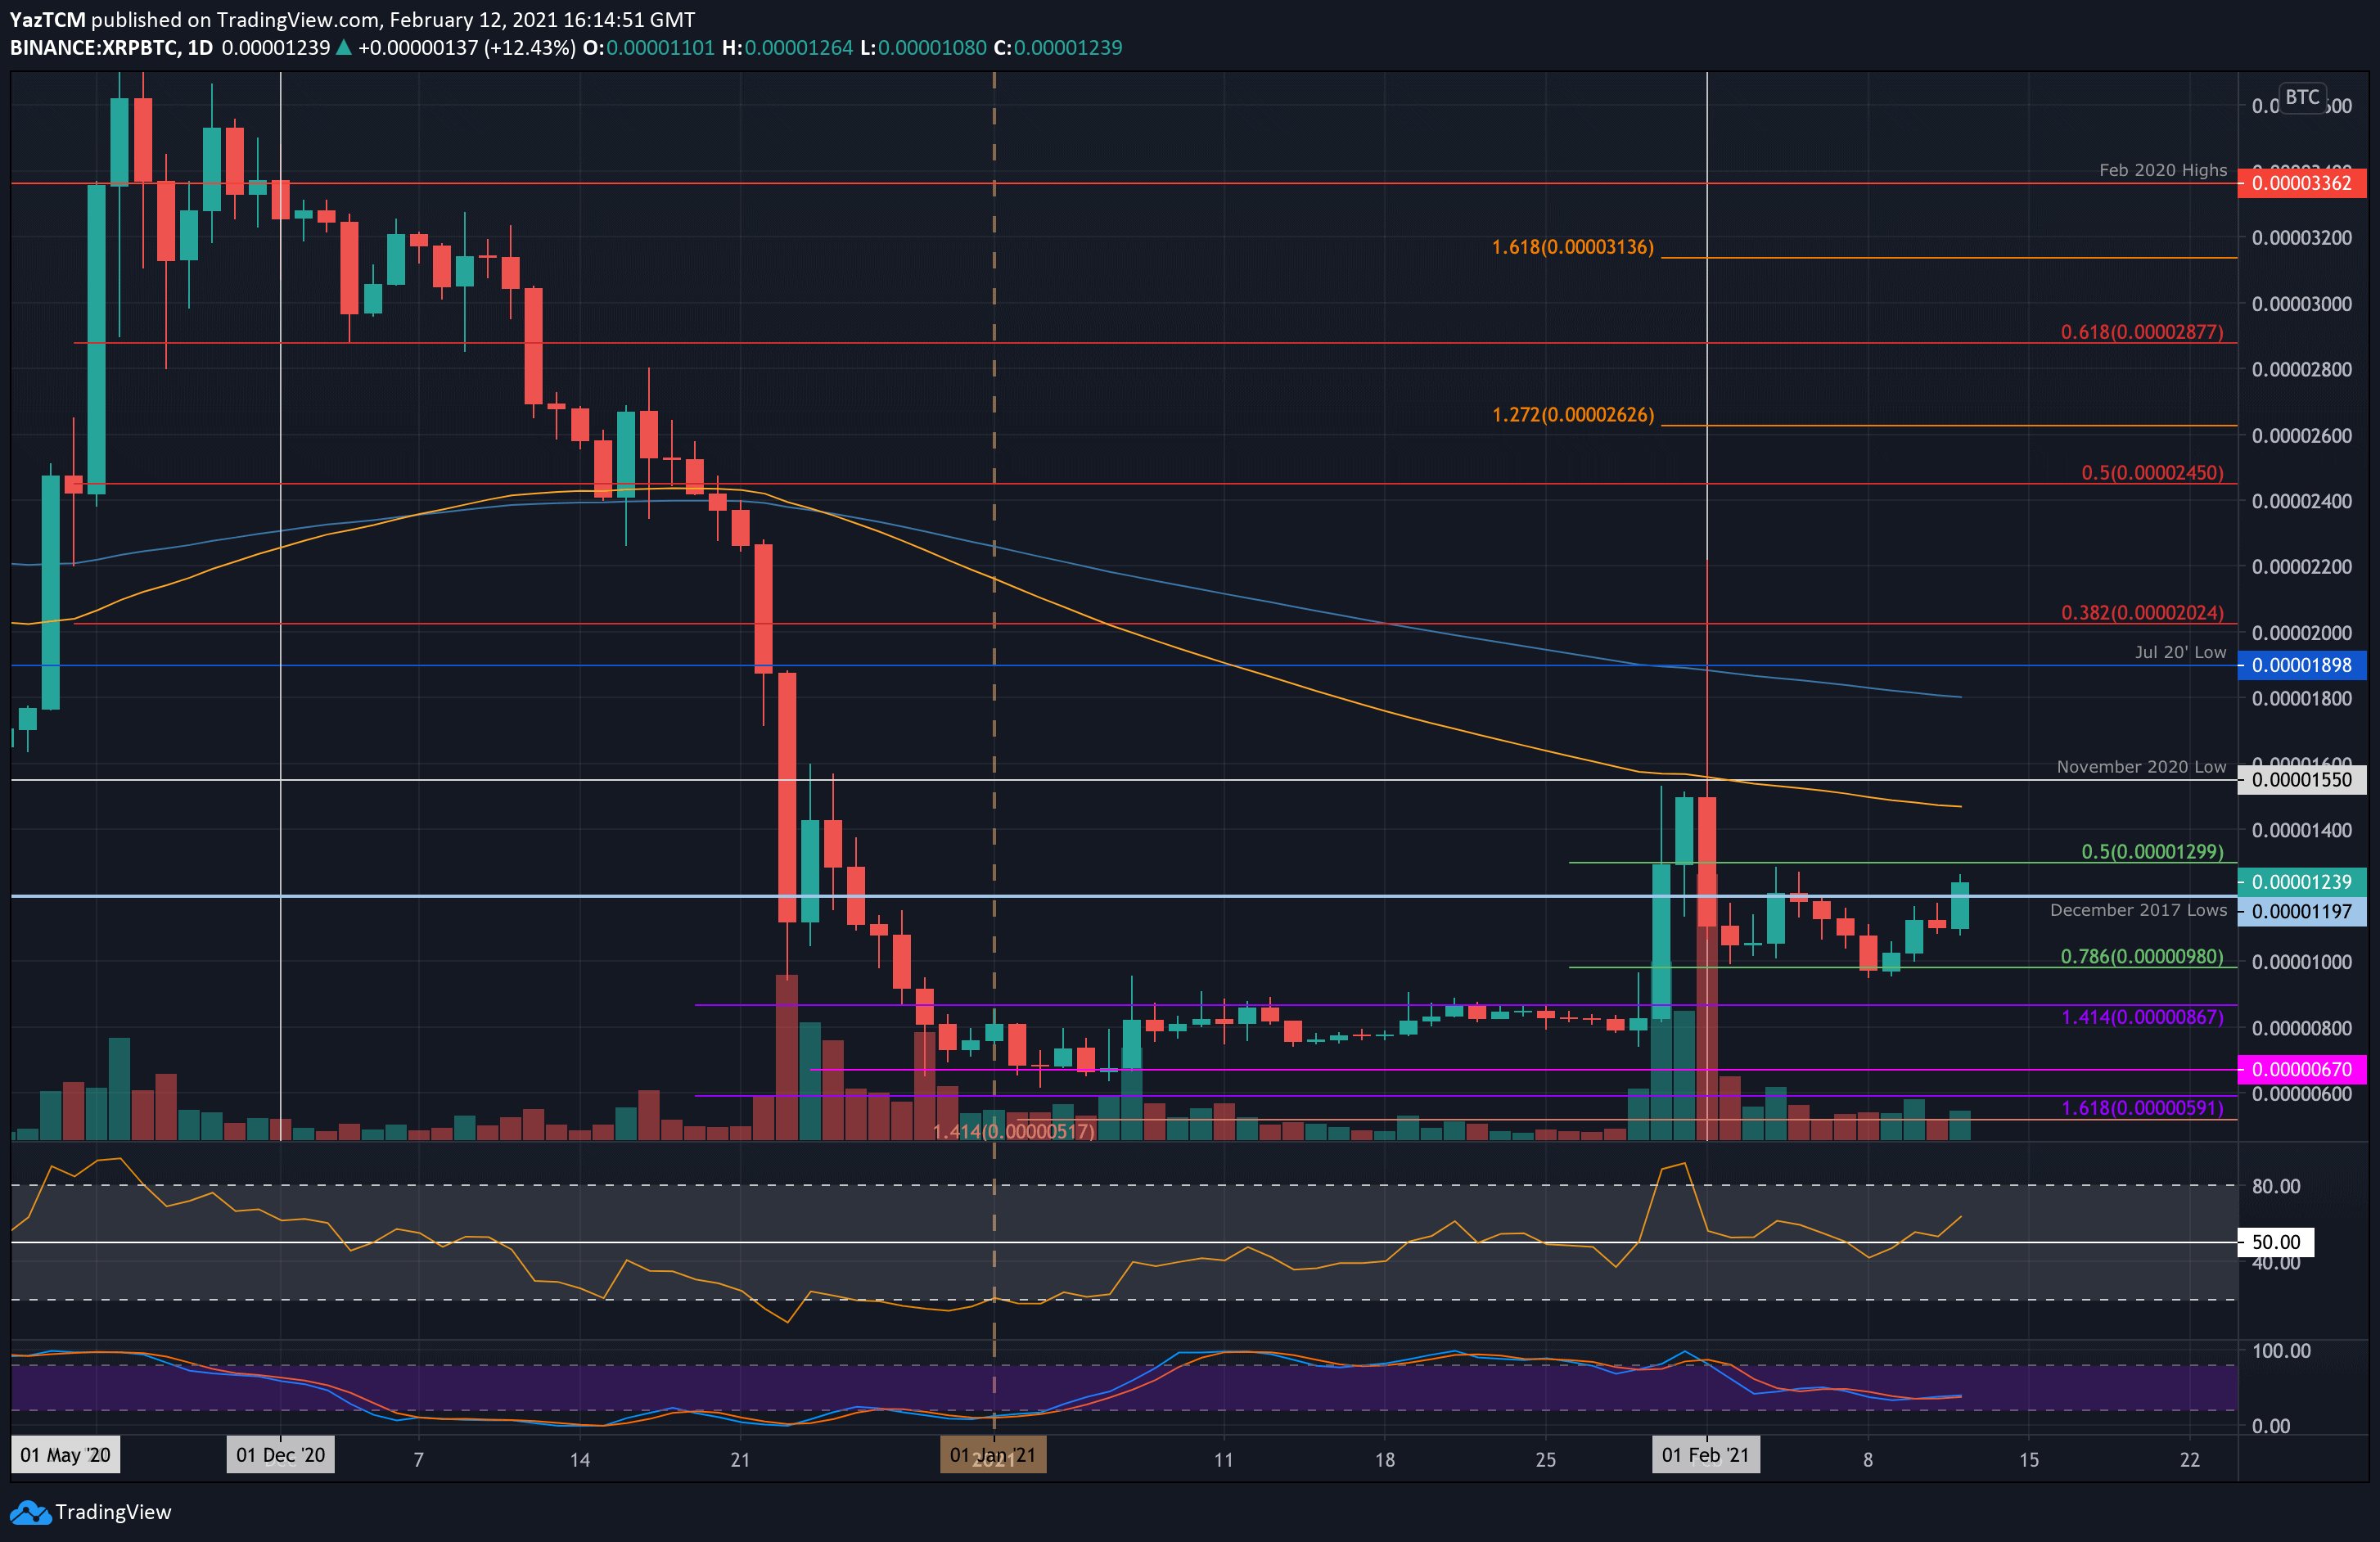
Against Bitcoin, XRP is also starting to look increasingly bullish again. Last week, it failed to break resistance at the December 2017 lows around 1200 SAT. As a result, XRP dropped lower against Bitcoin throughout the week and even briefly dropped beneath 1000 SAT.
It has since rebounded and has managed to penetrate 1200 SAT today to reach 1240 SAT. We must wait for a daily candle close above the resistance to confirm the breakout.
Looking ahead, the first level of higher resistance lies at 1300 SAT. This is followed by 1475 SAT (100-days EMA), 1550 SAT (November 2020 lows), 1800 SAT (200-days EMA), and 1900 SAT (July 2020 lows).
On the other side, the first support lies at 1000 SAT. This is followed by 980 SAT (.786 Fib), 867 SAT (previous resistance – now support), and 700 SAT.
Cardano
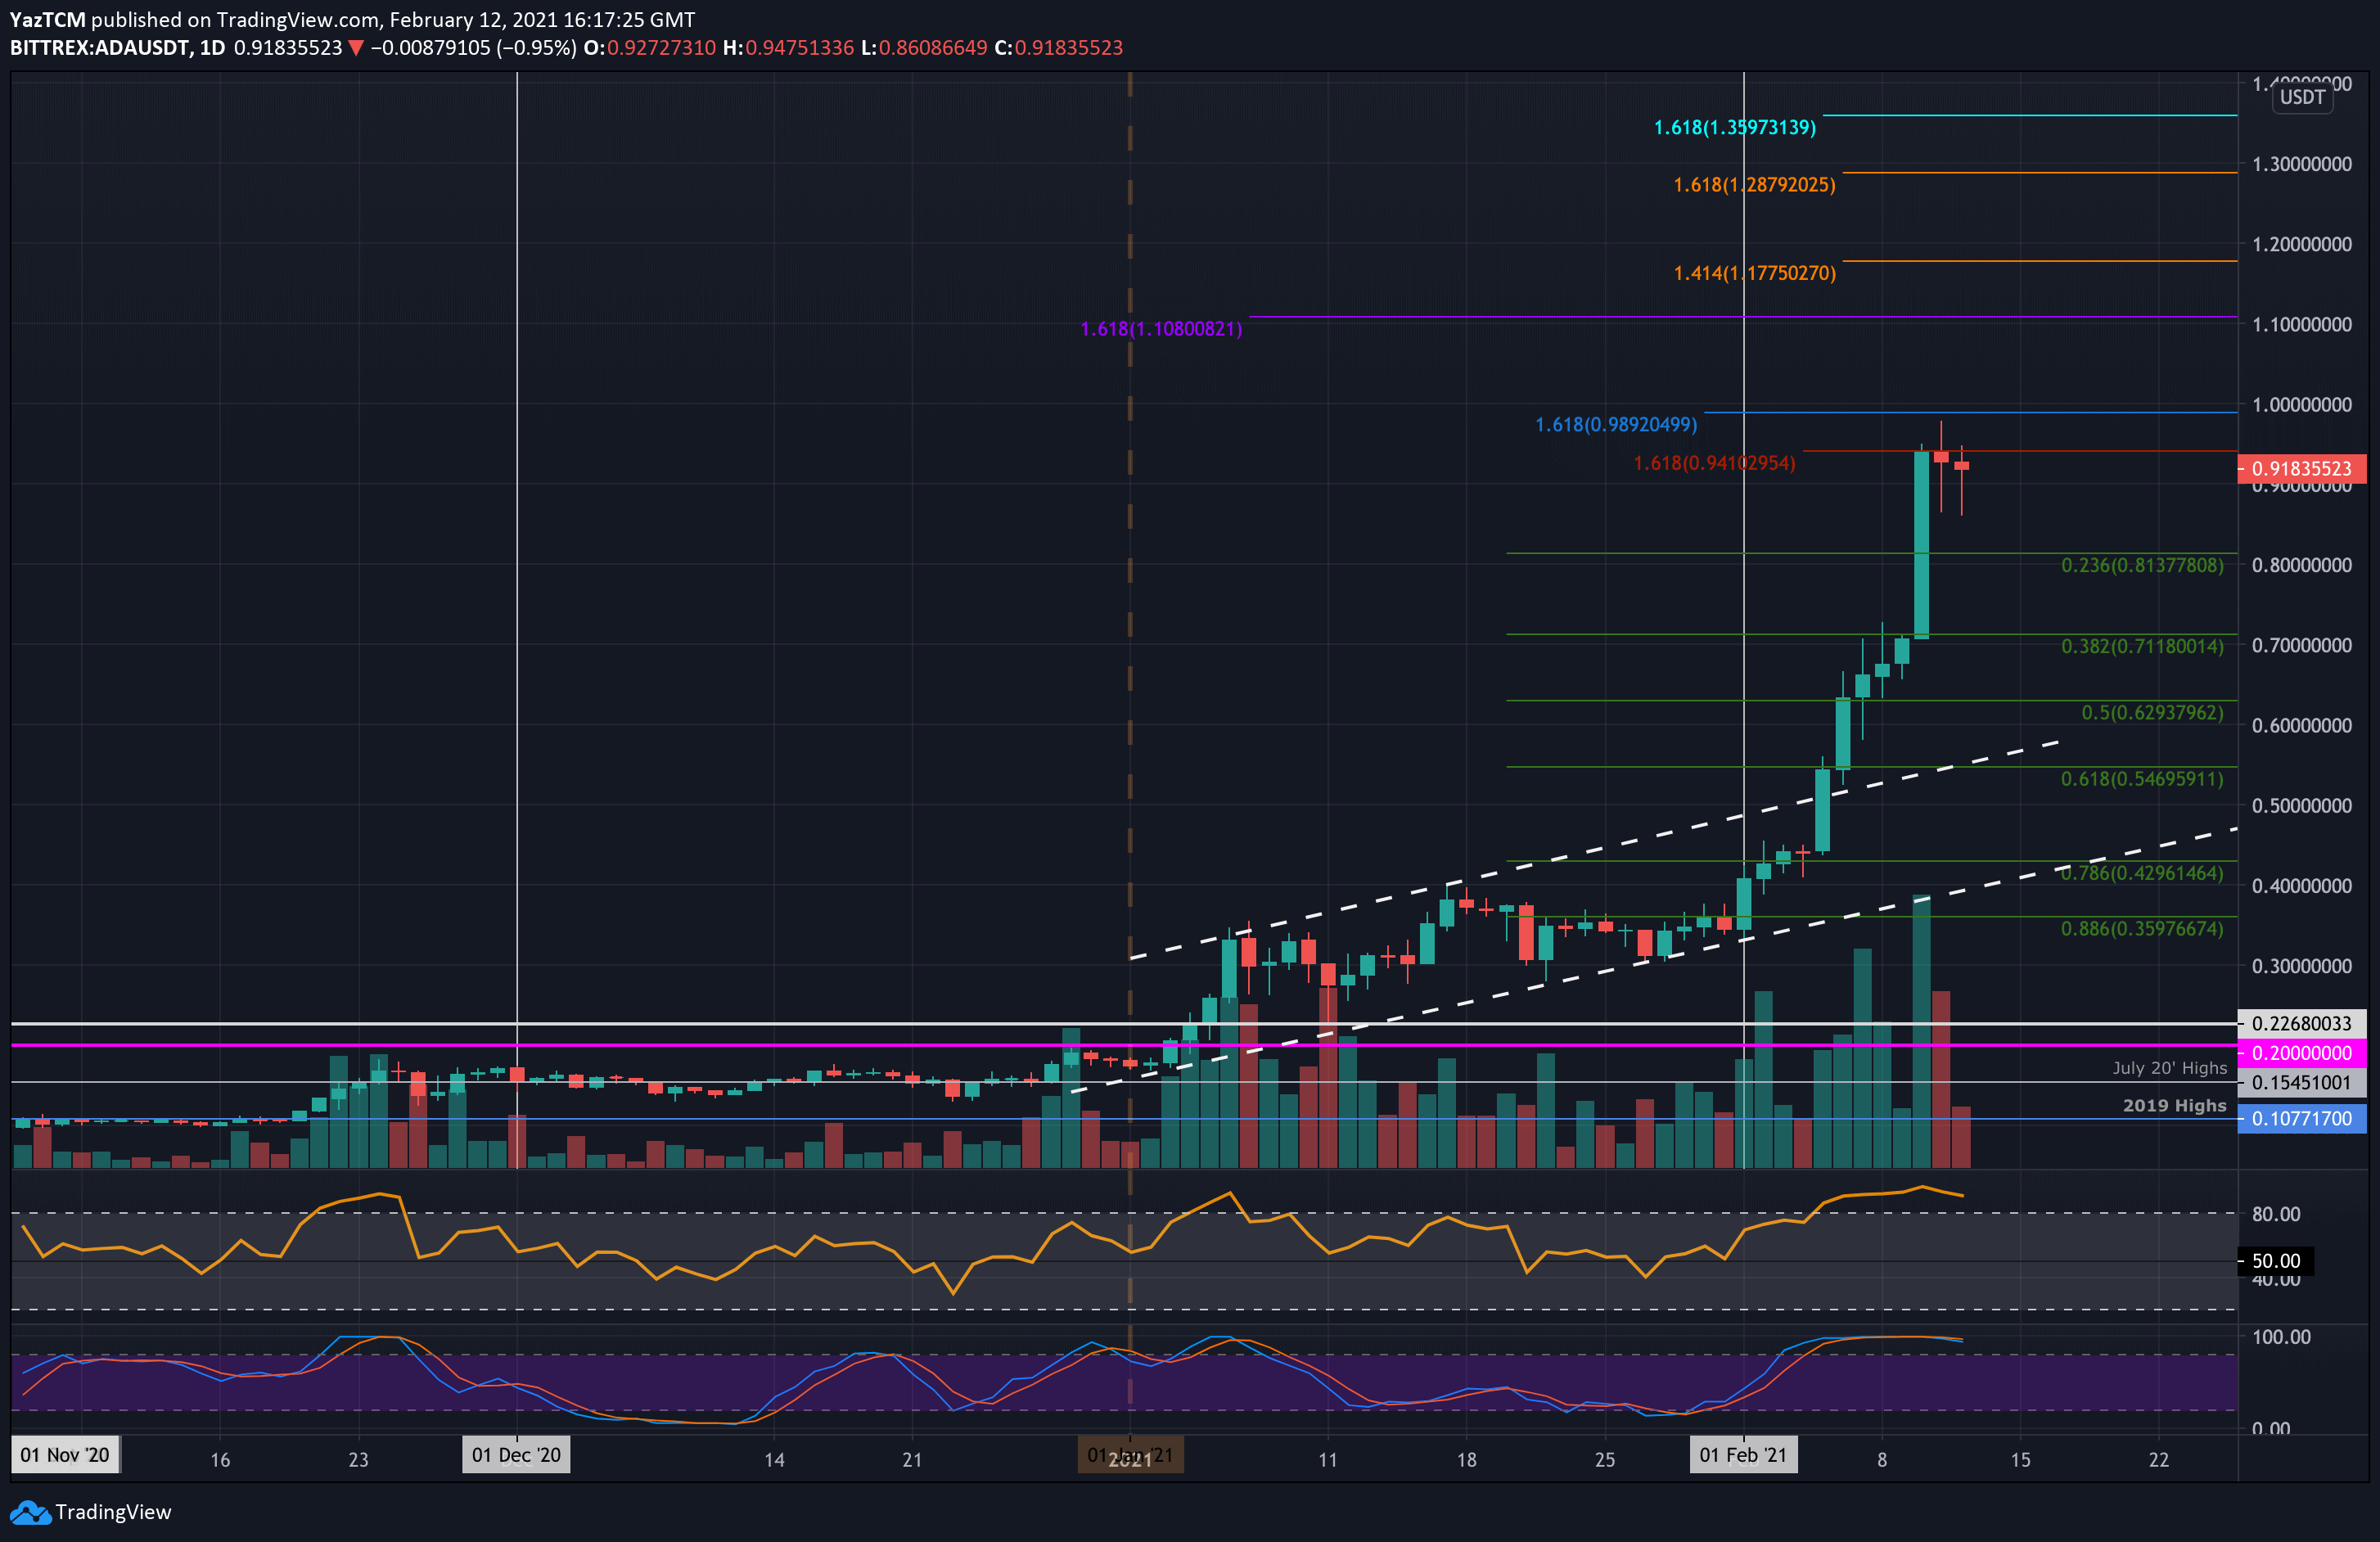
Cardano has seen impressive growth this month after managing to surge by over 200%. This week, ADA is up by 108% as it currently trades at $0.918.
The cryptocurrency started the week at around $0.43. From there, it started to push higher each day as it broke above resistance at the upper boundary of the previous ascending price channel.
It turned parabolic after breaking the channel until it met resistance at $0.941 (1.618 Fib Extension – red) on Wednesday. Although it spiked above this resistance, it has struggled to close a daily candle above it and has since dropped to trade at $0.918.
Looking ahead, the first resistance lies at $0.941. This is followed by $0.989 (1.618 Fib Extnesion – blue) and $1.00. Beyond $1.00, resistance lies at $1.10, $1.17 (1.414 Fib Extension – orange), $1.25, and $1.28 (1.618 Fib Extension – orange).
On the other side, the first support lies at $0.9. This is followed by $0.813 (.236 Fib), $0.711 (.382 Fib), and $0.629 (.5 Fib).
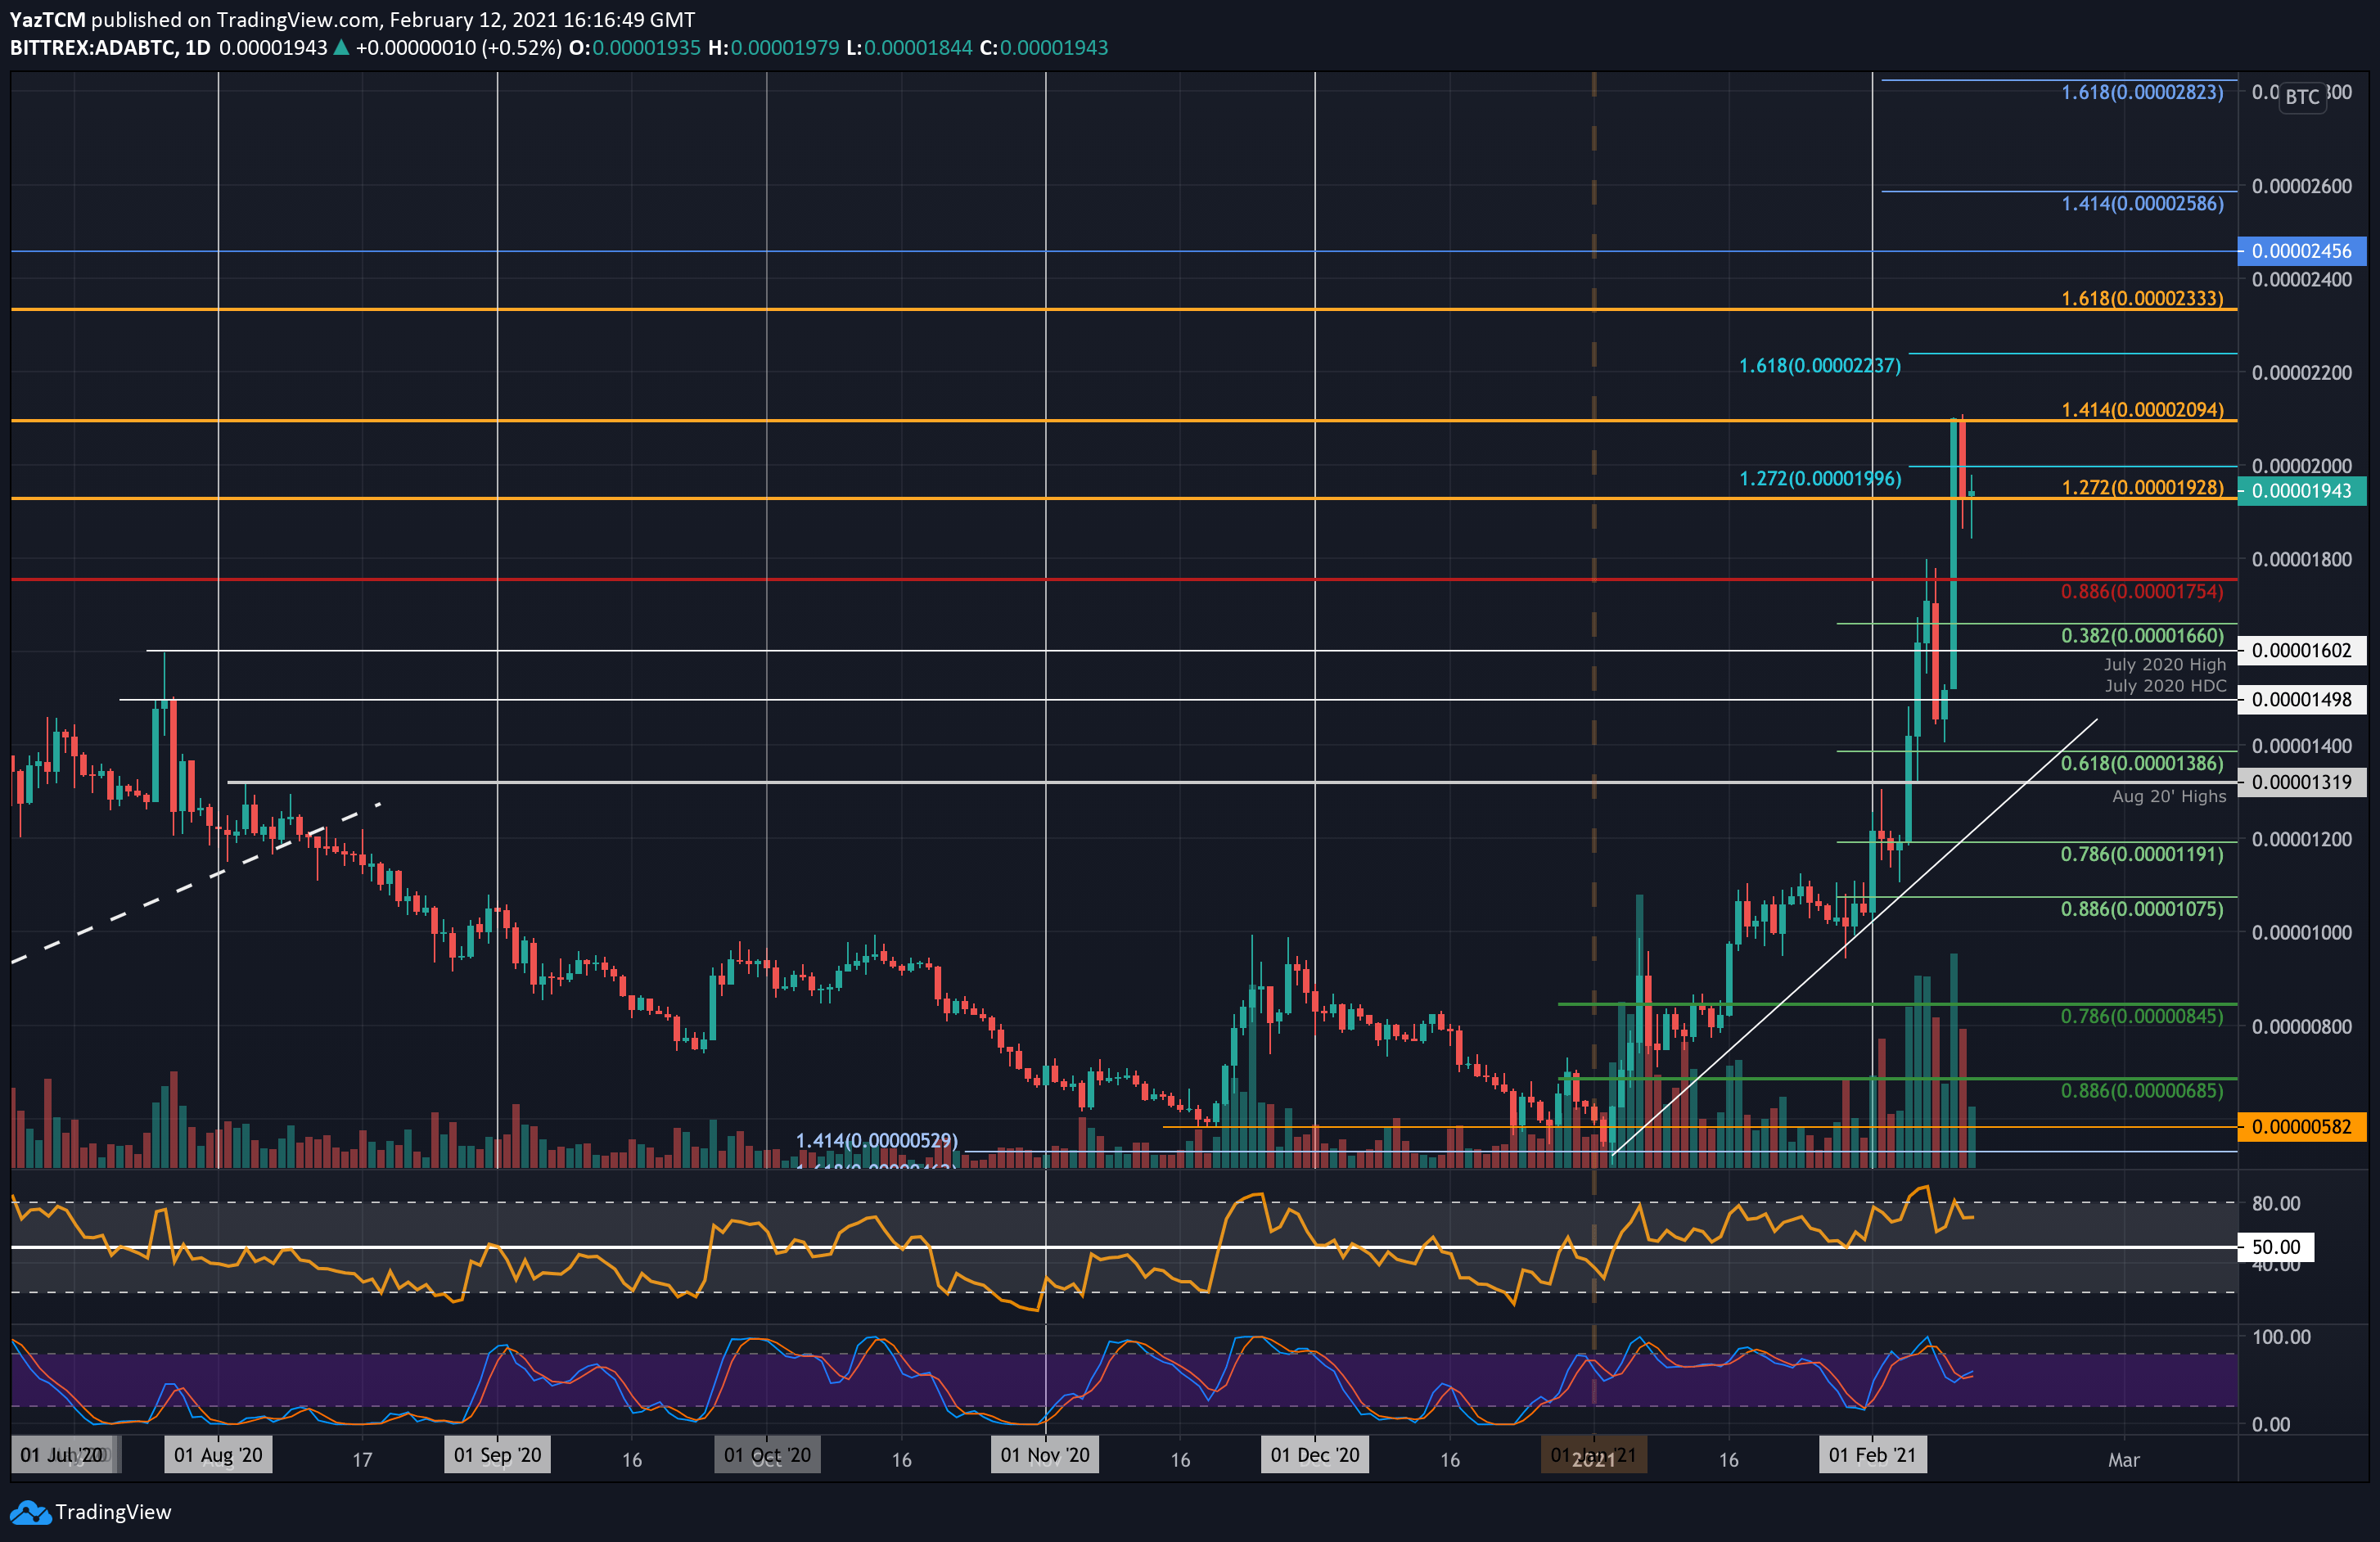
Against Bitcoin, ADA is also performing very well as it trades at 1940 SAT. The coin was trading at 1200 SAT last week as it started to push higher. On Monday, it found resistance at 1750 SAT (bearish .886 Fib), which caused it to drop back to 1400 SAT.
It rebounded from 1400 SAT on Tuesday and exploded higher to meet resistance at 2095 SAT (1.414 Fib Extension) on Wednesday. It could not break this resistance and has dropped over the past two days to meet the current 1943 SAT level.
Looking ahead, the first resistance lies at 2095 SAT (1.414 Fib Extension – yellow). This is followed by 2237 SAT (1.618 Fib Extension – blue), 2333 SAT (1.618 Fib Extension- yellow), and 2455 SAT. Added resistance lies at 2586 SAT and 2823 SAT.
On the other side, the first support lies at 1800 SAT. This is followed by 1750 SAT, 1660 SAT (.382 Fib), and 1600 SAT (July 2020 High). Additional support lies at 1500 SAT and 1386 SAT (.618 Fib).
Binance Coin
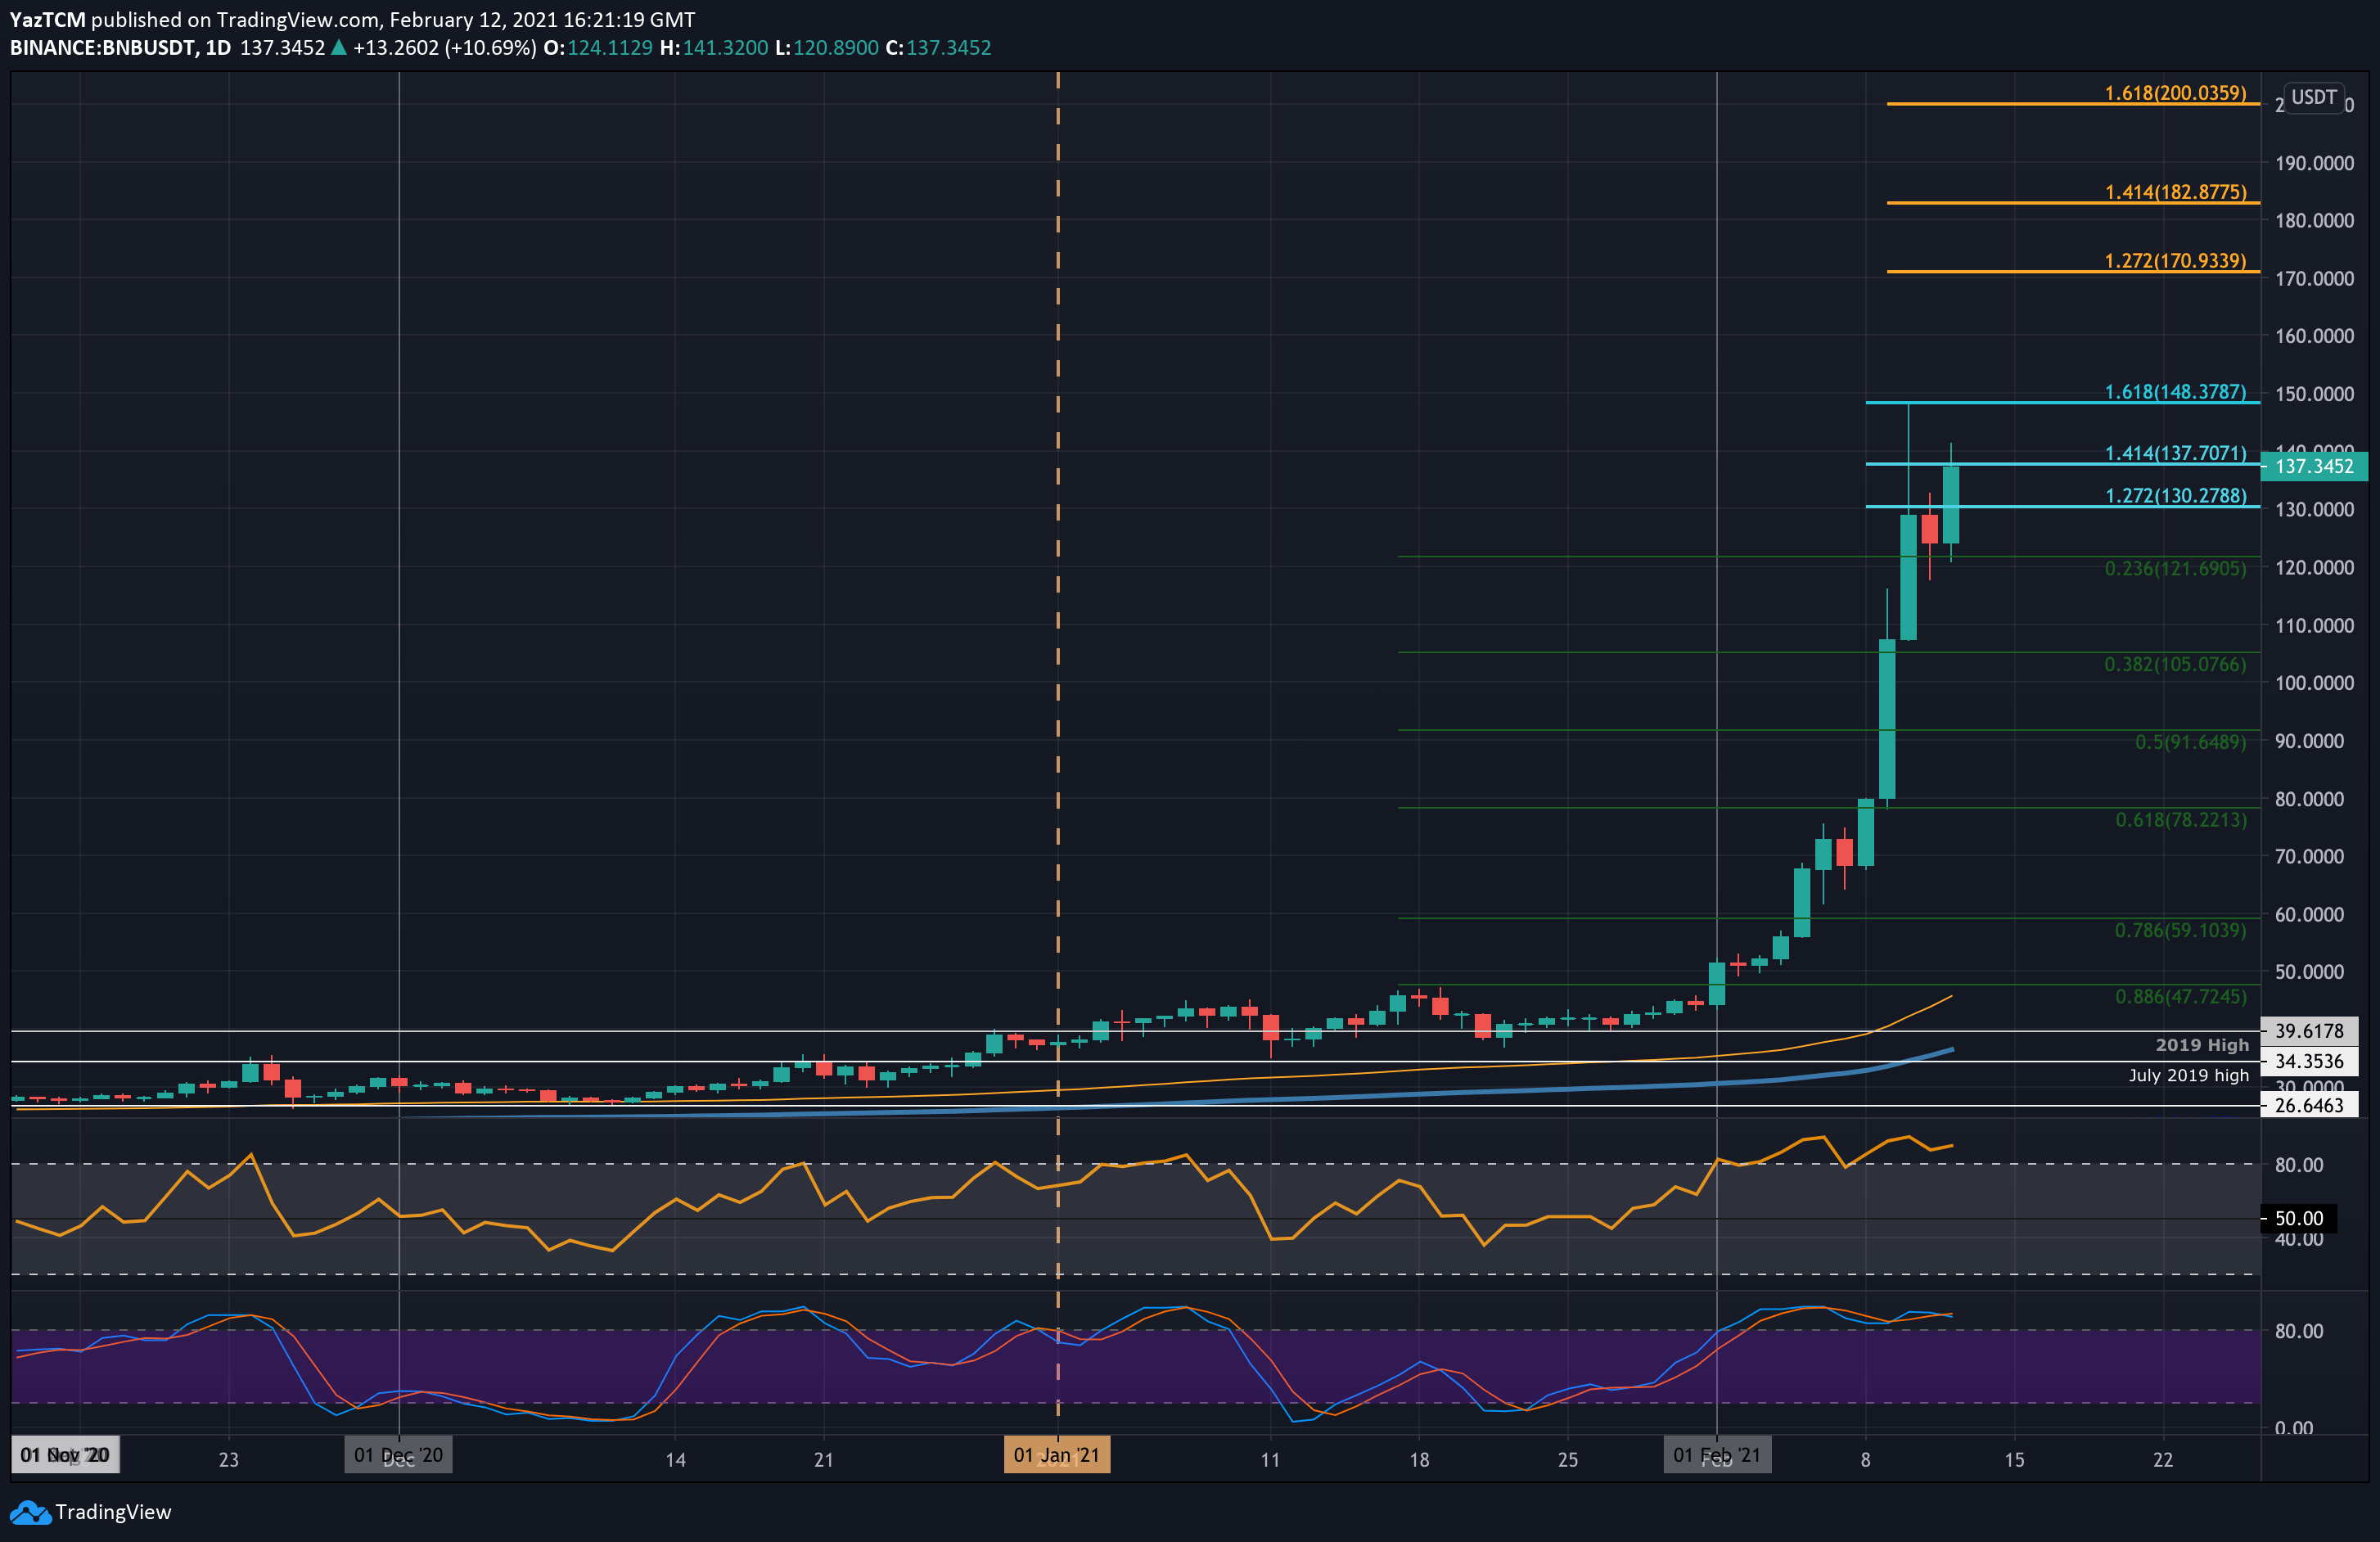
BNB saw an extraordinary 145% price explosion over the past week of trading. It was trading at $70 last Friday as it started to push higher. BNB continued to surge higher throughout the week until meeting resistance at $148.37 (1.618 Fib Extension) on Wednesday.
It could not overcome this resistance and dropped lower from there to meet the support at $121.70 (.236 Fib). Today, ADA has rebounded again and is now trading at $137.70 (1.414 Fib Extension).
Looking ahead, if the buyers break $137.70, the first resistance lies at $148.37 (1.618 Fib Extension). Above $150, resistance is then located at $160, $170.93 (1.272 Fib Extension – orange), $182.87 (1.414 Fib Extension – orange), $190, and $200.
On the other side, the first support lies at $130. This is followed by $121.70 (.236 Fib), $110, $105 (.382 Fib), $100, and $91.65 (.5 Fib).
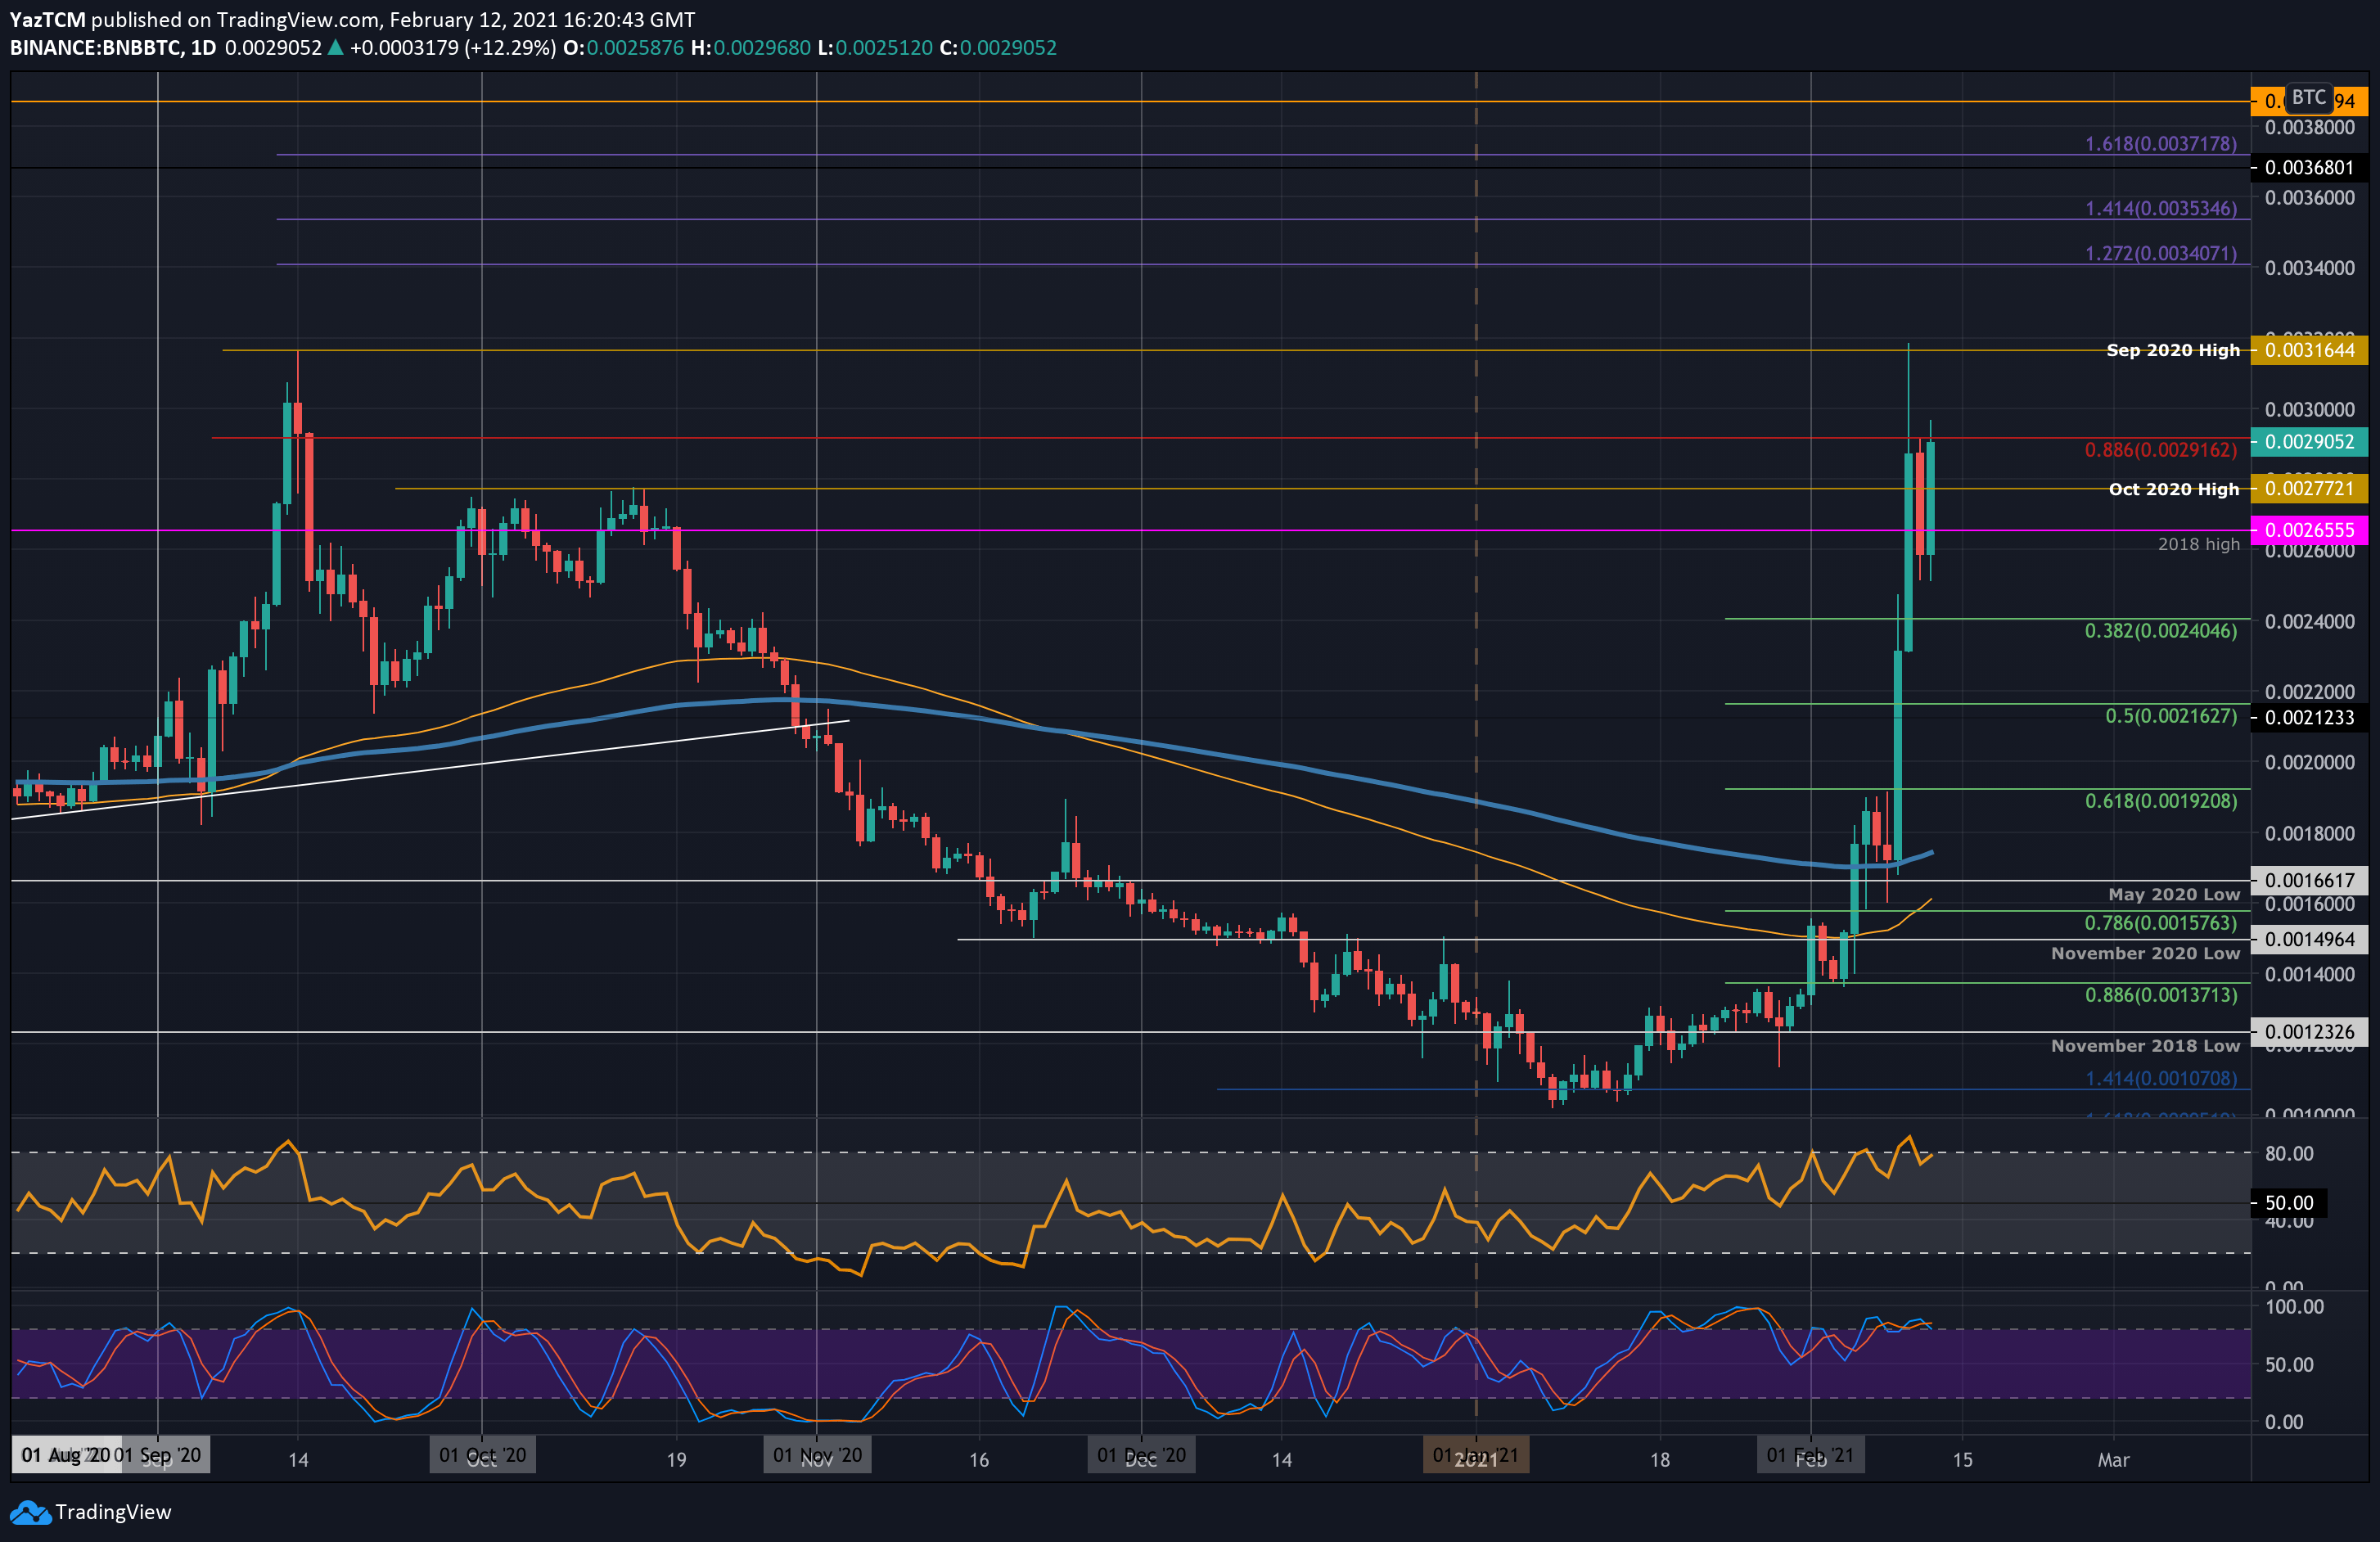
BNB is also performing very well against Bitcoin. It surged from 0.00149 BTC last Friday as it started to push higher. On Tuesday, it bounced from the 200-days EMA and started to surge until meeting resistance at 0.00316 BTC (Sep 2020 High) on Wednesday.
It could not close a daily candle above 0.00281 BTC (bearish .886 Fib Retracement) and ended up dropping into 0.0026 BTC. It has since rebounded and is now testing the resistance at 0.00281 BTC again today.
Looking ahead, the first resistance lies at 0.00291 BTC. This is followed by 0.003 BTC, 0.00316 BTC (Sep 2020 High), and 0.0034 BTC (1.272 Fib Extension). Additional resistance lies at 0.00353 BTC (1.414 Fib Extension), 0.00371 BTC (1.618 Fib Extension), and 0.0038 BTC.
On the other side, the first support lies at 0.0026 BTC. This is followed by 0.0024 BTC (.382 Fib), 0.00216 BTC (.5 Fib), 0.002 BTC, and 0.00192 BTC (.618 Fib).