This week saw a serious correction throughout the entire cryptocurrency market. Bitcoin lost, at one point, about ,000 of its value as it went through one of the most serious declines since the start of the current bull run. With this said, we take a look at the following cryptocurrencies.BitcoinBitcoin has seen a turbulent week in which the price dropped to the current ,000 level. The cryptocurrency was trending higher last week to set a new ATH price above ,000.However, on Sunday, the coin became stuck at the upper boundary of an ascending price channel. It rolled over from there on Monday as it started to plummet. Initially, it found support at the channel’s lower boundary as the bulls attempted to defend the level.Unfortunately, the breakout beneath the price channel was
Topics:
Yaz Sheikh considers the following as important: Bitcoin (BTC) Price, BTCEUR, BTCGBP, btcusd, btcusdt, Chainlink (LINK) Price, DOTBTC, DOTUSD, DOTUSDT, ETH Analysis, ETHBTC, Ethereum (ETH) Price, ethusd, LINKBTC, LINKUSD, Market Updates, Polkadot (DOT) Price, Price Analysis, Ripple (XRP) Price, XRP Analysis, xrpbtc, xrpusd
This could be interesting, too:
Mandy Williams writes Bitcoin ETFs Record Over .6B in Outflows in the Past 2 Weeks
Chayanika Deka writes Bitcoin Whales Offload 6,813 BTC as Selling Pressure Mounts
Wayne Jones writes Bitcoin Sentiment Hits 2022 Lows as Fear & Greed Index Falls to 10
Dimitar Dzhondzhorov writes Is a Major Ripple v. SEC Lawsuit Development Expected This Week? Here’s Why
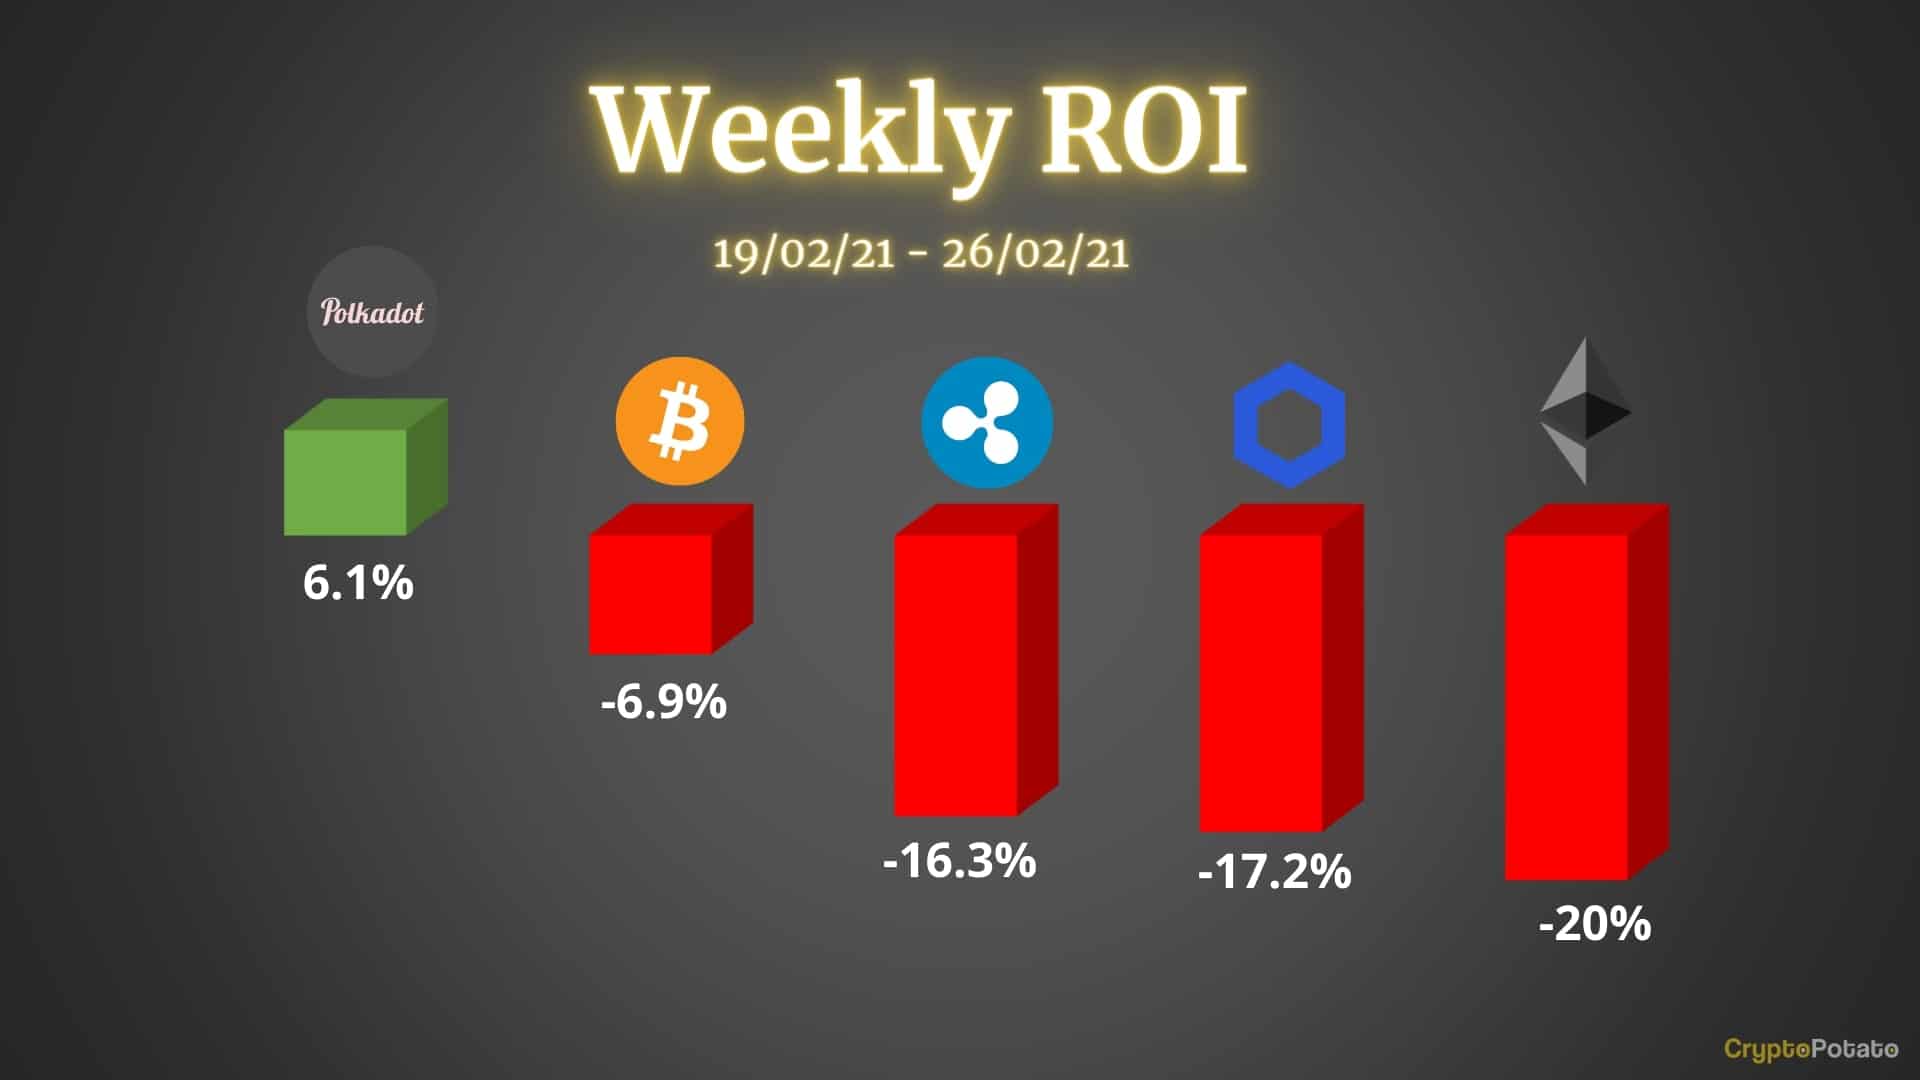
This week saw a serious correction throughout the entire cryptocurrency market. Bitcoin lost, at one point, about $13,000 of its value as it went through one of the most serious declines since the start of the current bull run. With this said, we take a look at the following cryptocurrencies.
Bitcoin
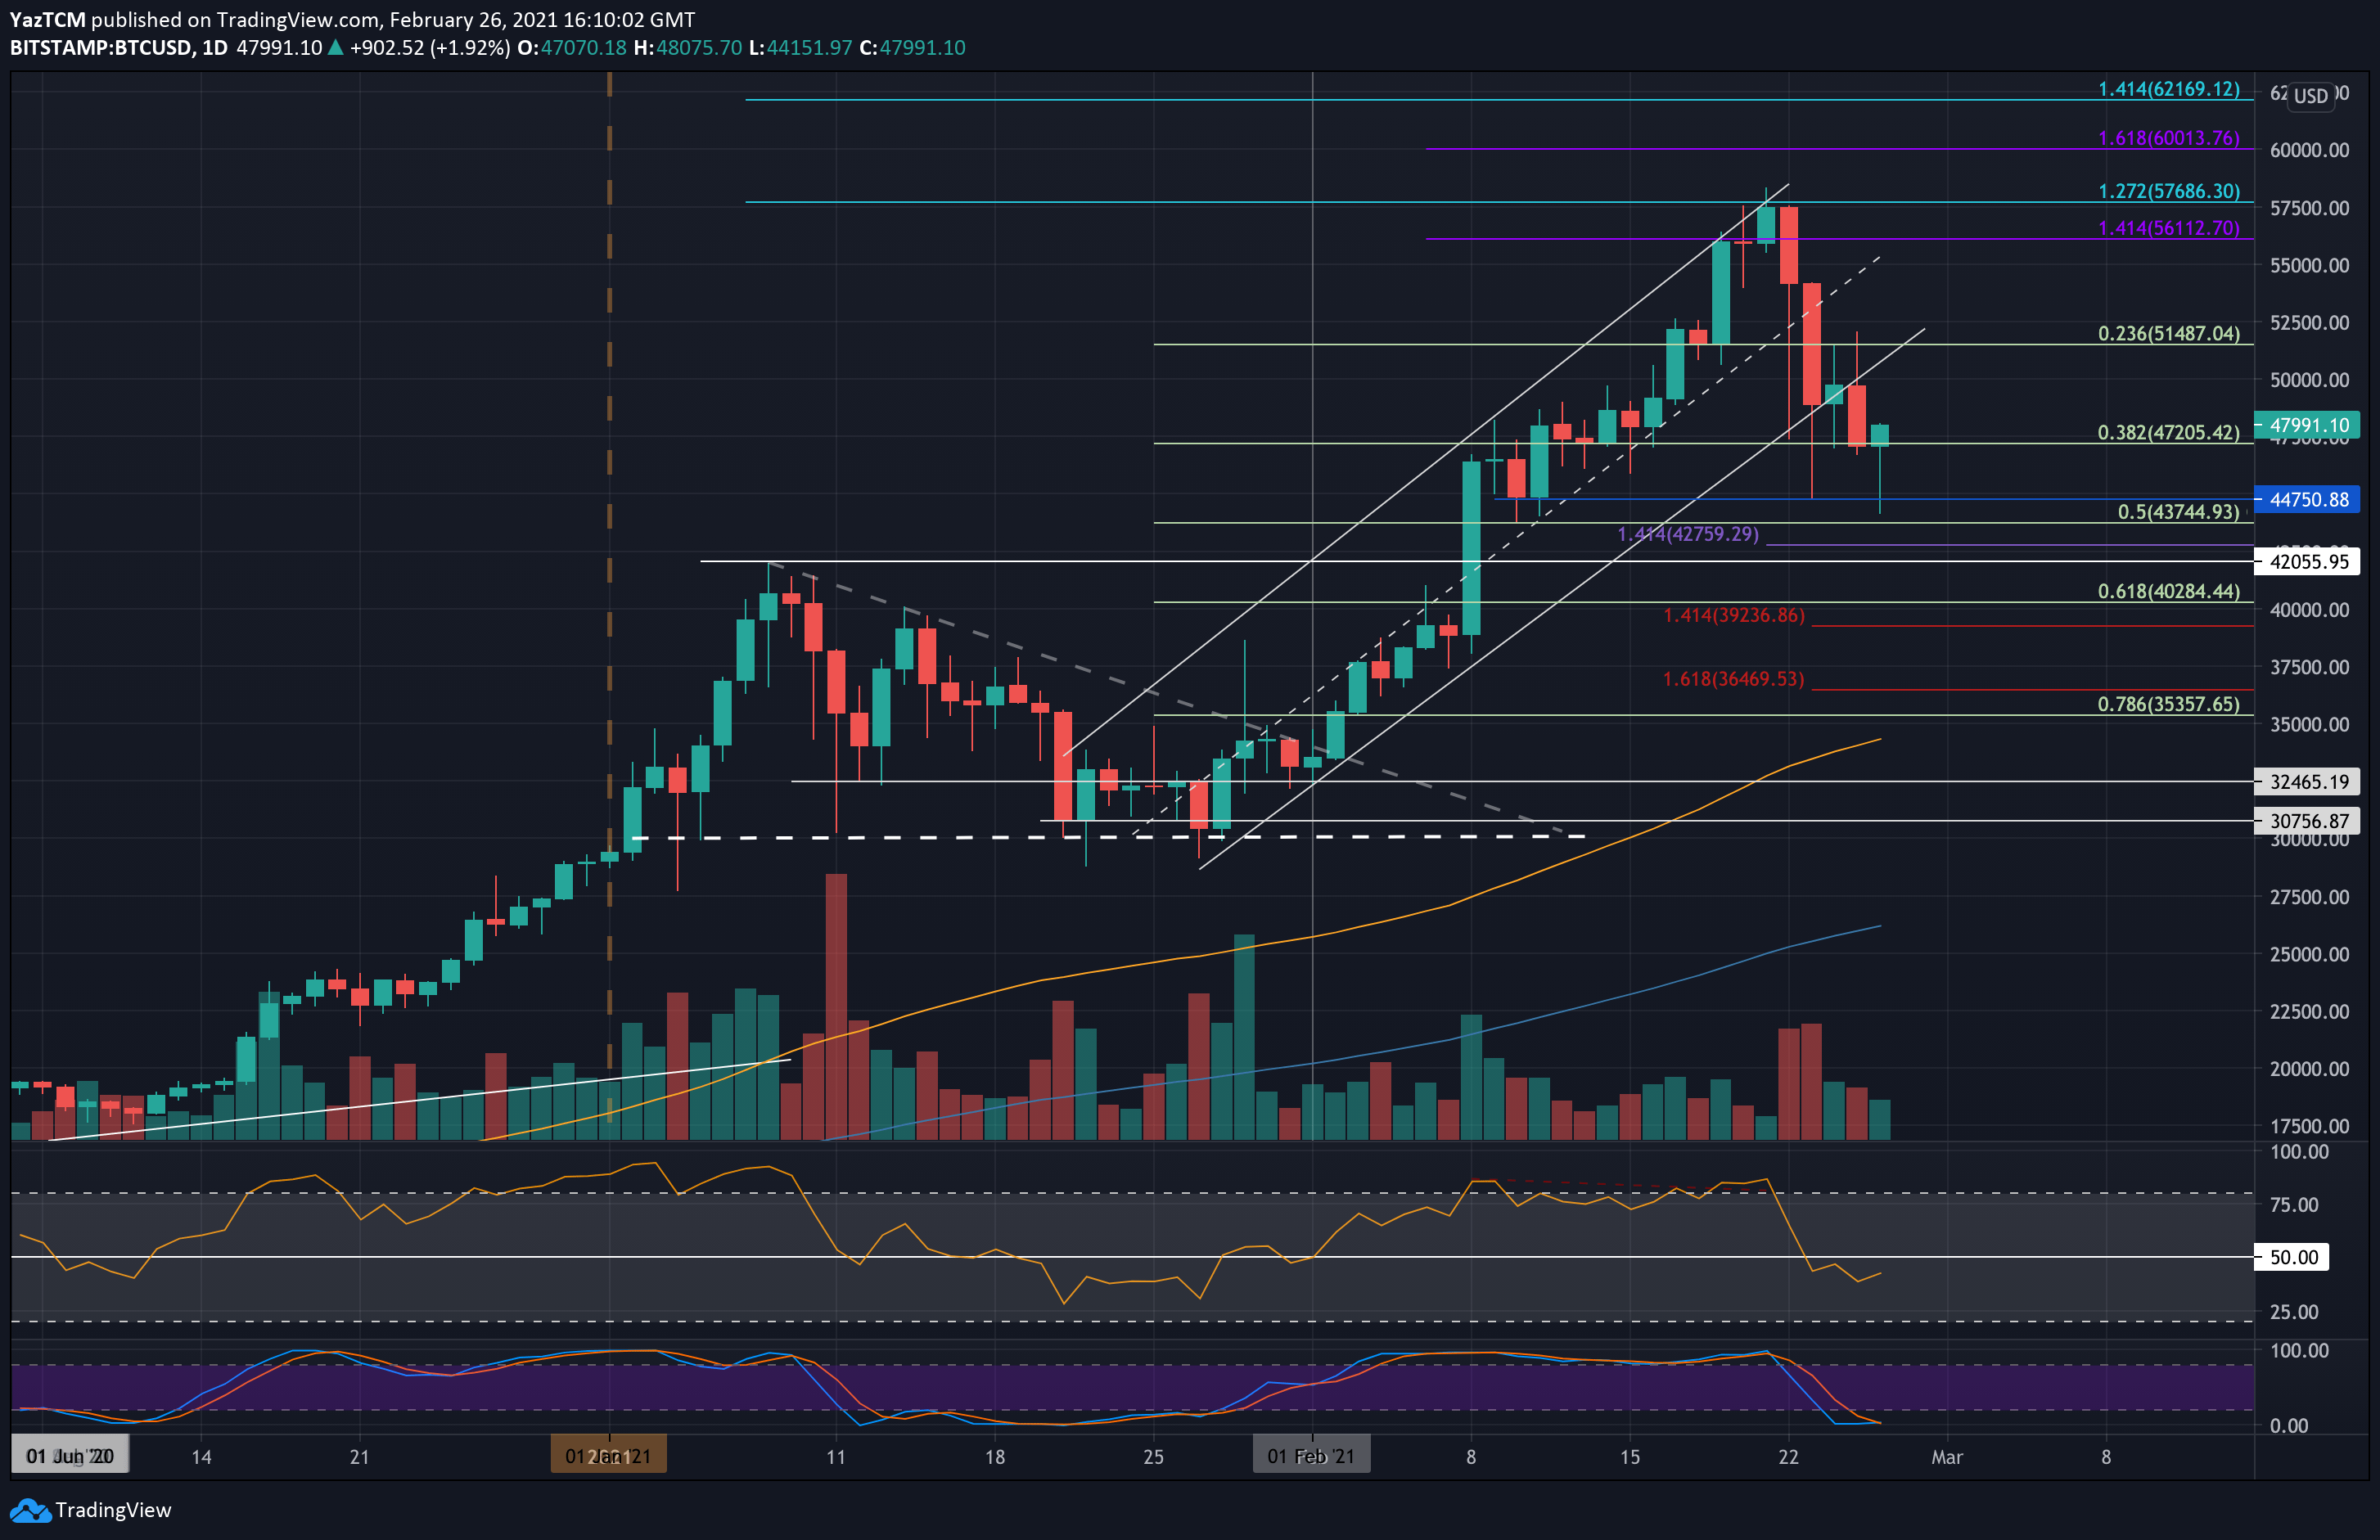
Bitcoin has seen a turbulent week in which the price dropped to the current $48,000 level. The cryptocurrency was trending higher last week to set a new ATH price above $58,000.
However, on Sunday, the coin became stuck at the upper boundary of an ascending price channel. It rolled over from there on Monday as it started to plummet. Initially, it found support at the channel’s lower boundary as the bulls attempted to defend the level.
Unfortunately, the breakout beneath the price channel was confirmed yesterday when Bitcoin closed a daily candle at $47,200 (.382 FIb). Today, it dipped as low as $44,150 before it finally rebounded back above $47,200.
Looking ahead, the first level of resistance lies at $50,000. This is followed by $51,500, $52,500, and $55,000. Additional resistance lies at $56,112, $57,686 (1.272 Fib Extension), and $58,355 (ATH price).
On the other side, the first support lies at $47,200 (.382 FIb). This is followed by $44,750, $42,745 (.5 Fib), $42,760 (downside 1.414 Fib Extension), and $42,000 (previous ATH). Added support lies at $40,285 (.618 Fib) and $39,235.
Ethereum
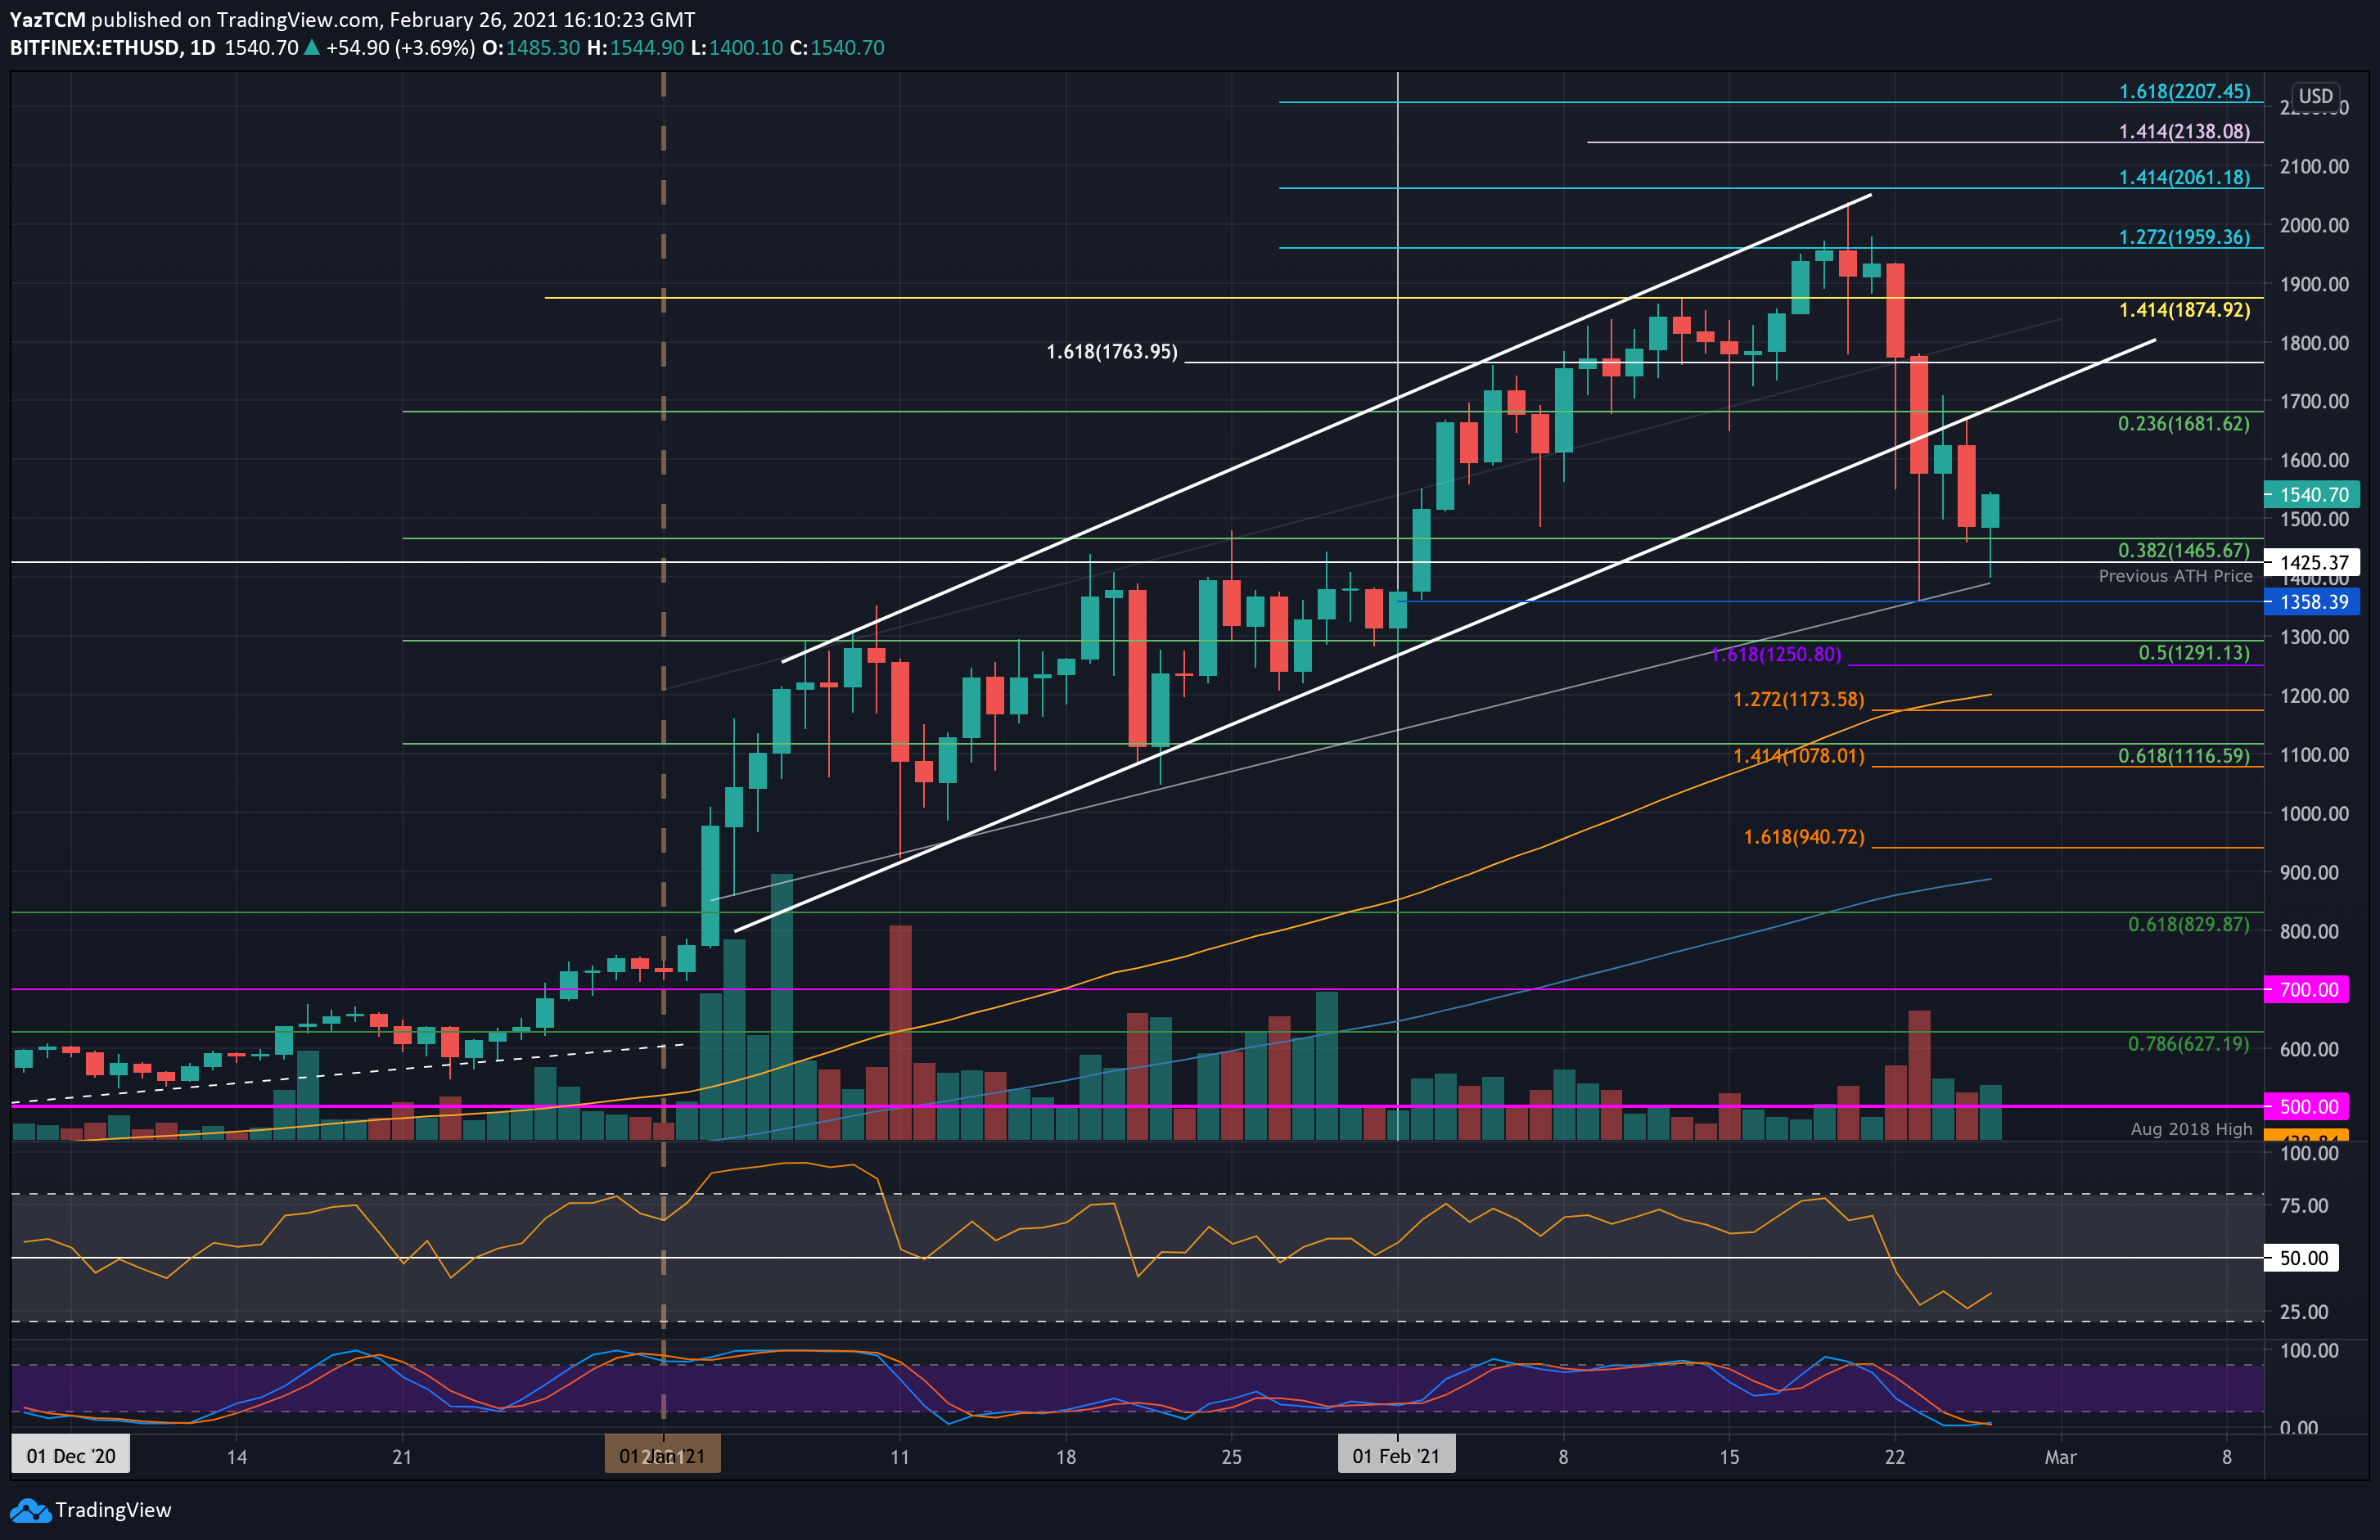
Ethereum suffered a heavier 20% price decline this week as it currently sits at $1,540. The coin had reached the upper boundary of its own ascending price channel at the start of the week as it set a new ATH price above $2,000.
Unfortunately, it struggled to close a daily candle above $1,960 (1.272 Fib Extension) and started to head lower from there.
Over the week, Ethereum fell beneath the ascending price channel and continued until support was found at $1,465 (.382 Fib) yesterday. After dipping as low as $1,400 today, ETH has rebounded again and is back above $1,500.
Looking ahead, the first level of support lies at $1,465 (.382 Fib). This si followed by $1,400, $1,385, $1,291 (.5 Fib), and $1,250 (downside 1.618 Fib Extension). Added support is found at $1,200 (100-days EMA) and $1,116 (.618 Fib).
On the other side, resistance first lies at $1,600. This is followed by $1,680, $1,763, $1,800, and $1,875. Added resistance lies at $1,960, $2,000, and $2,060.
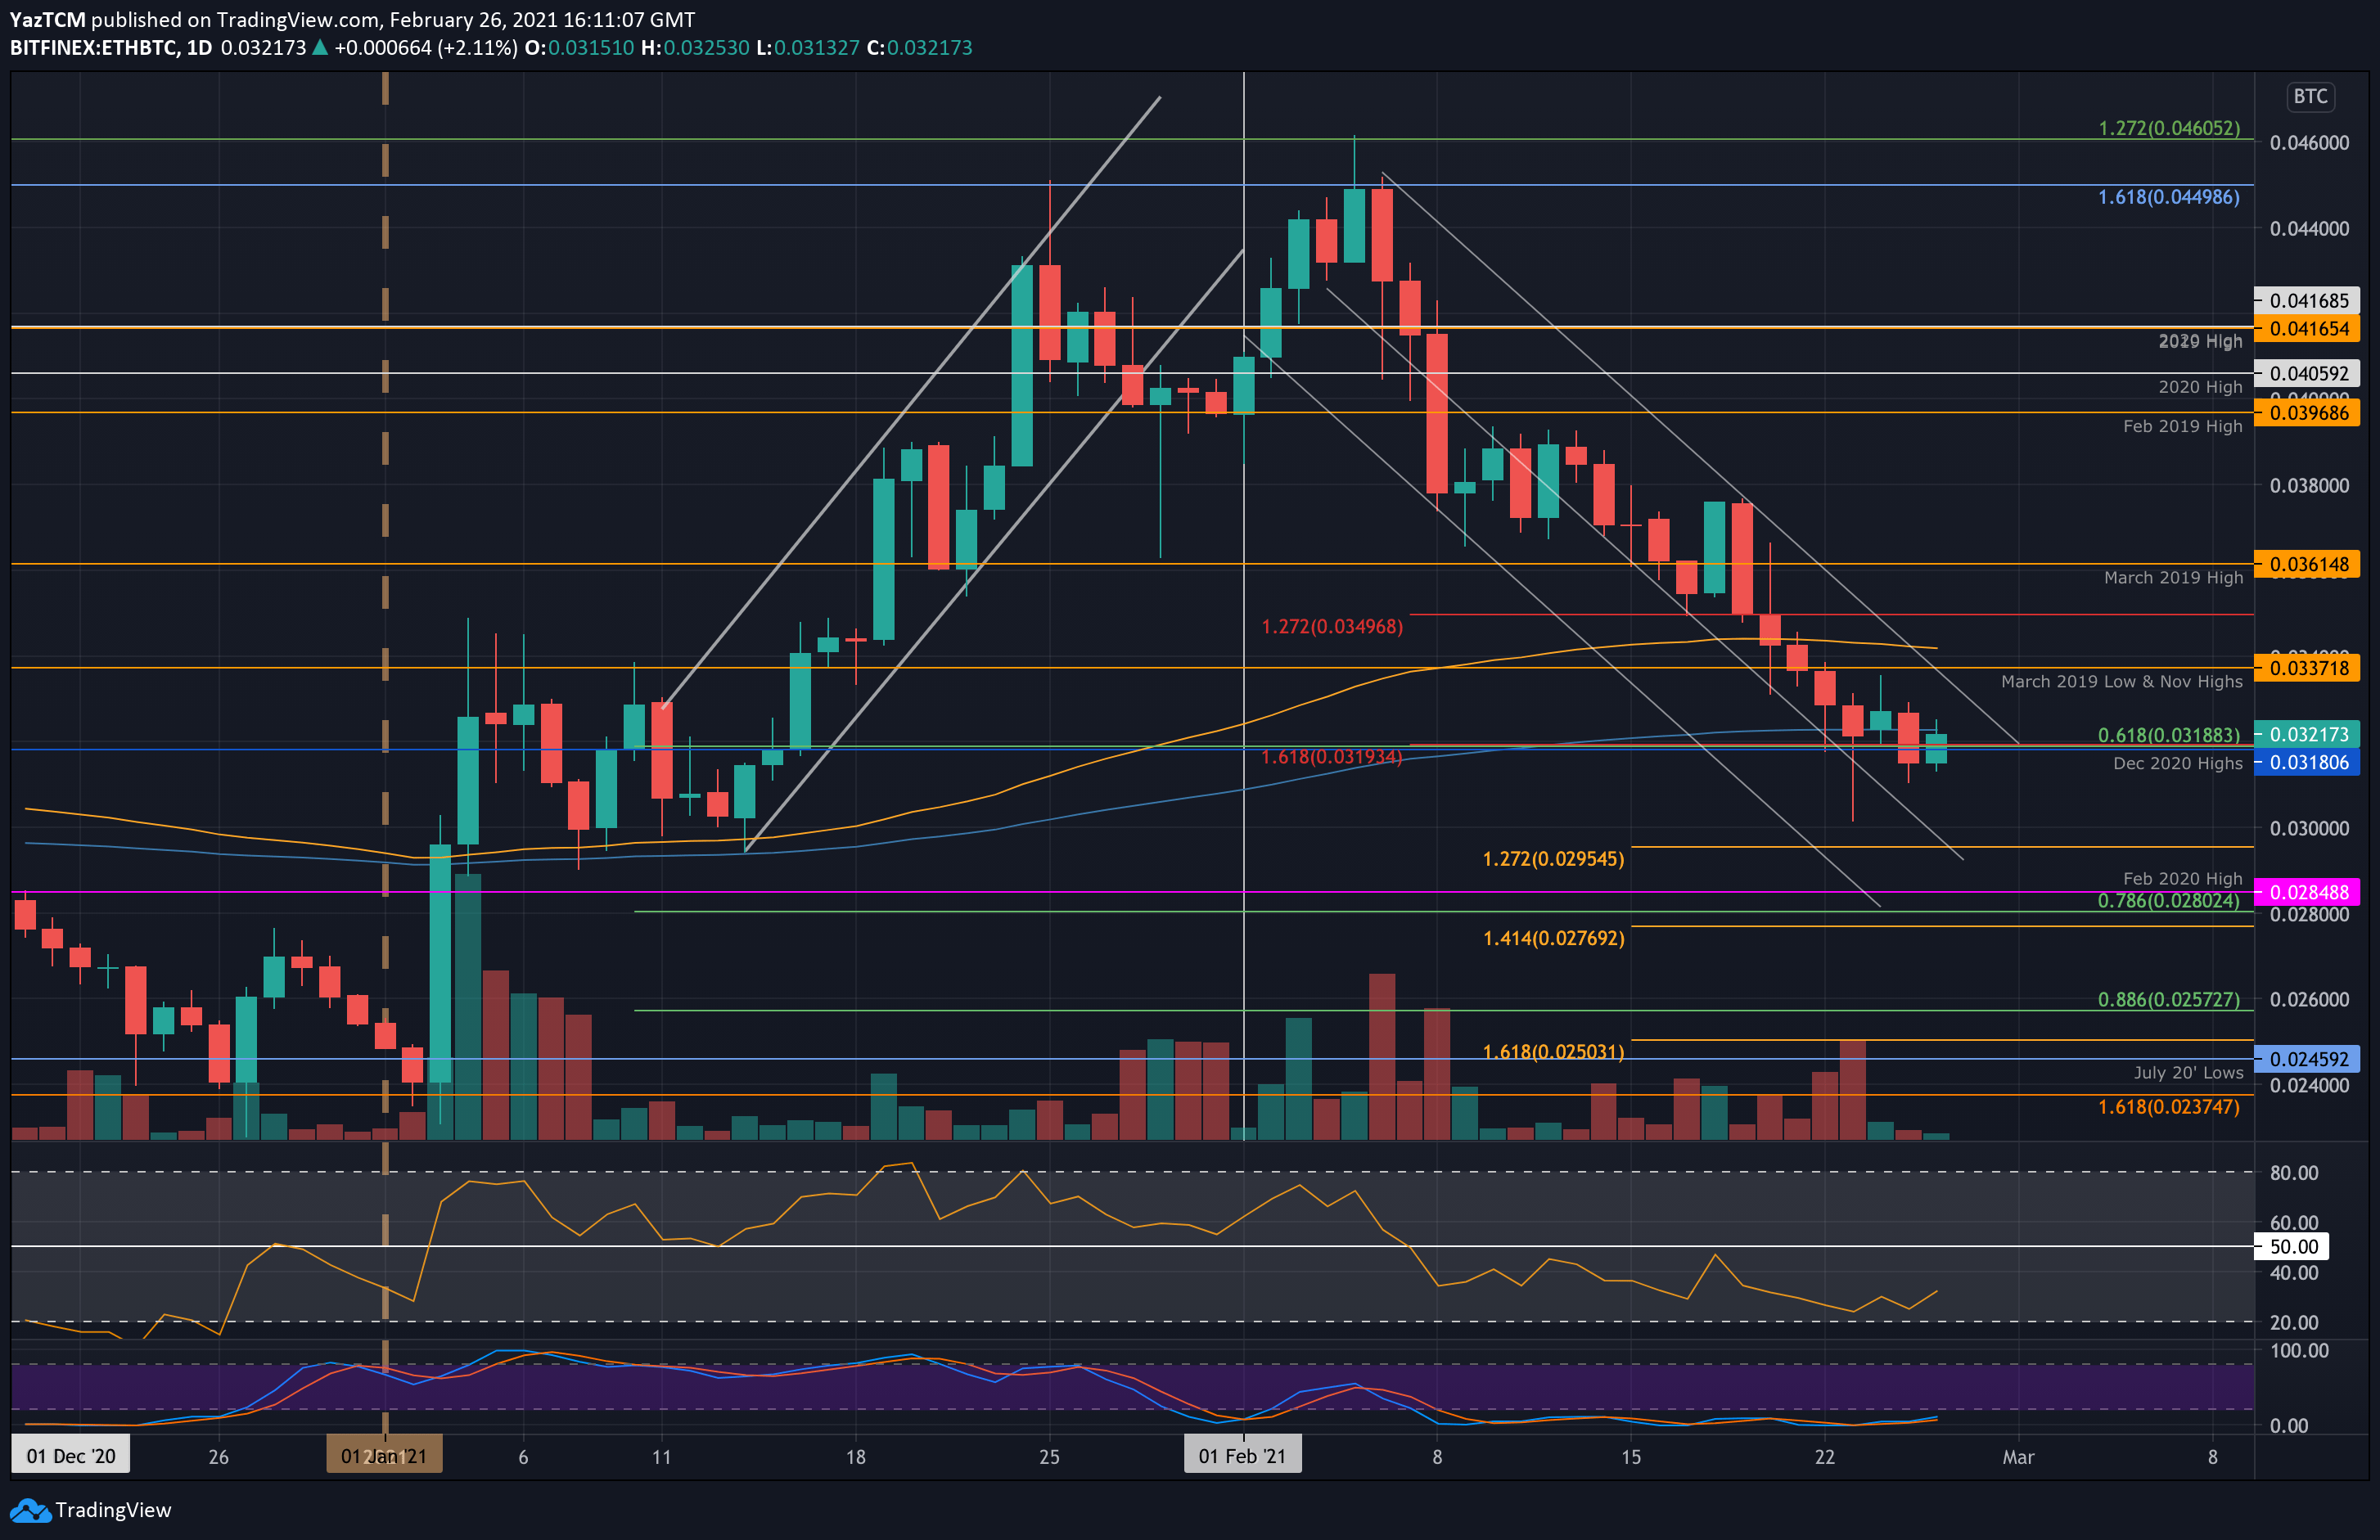
Ethereum continues to struggle heavily against Bitcoin and is now down by a total of 30% from the February highs as it sits at 0.0321 BTC (200-day EMA). The coin has been trading inside a descending price channel for the entire period of February as it takes a beating against Bitcoin.
This week, Ethereum fell beneath the November highs at 0.0337 BTC and reached as low as 0.03 BTC on Tuesday. It is attempting to defend the support at 0.031 BTC, but a closing candle beneath here might send ETH/BTC to the 2021 lows.
Looking ahead, the first level of support lies at 0.0318 BTC (.618 Fib). This is followed by 0.013 BTC, 0.030 BTC, and 0.0295 BTC (downside 1.272 Fib Extension). Added support lies at 0.0295 BTC (Feb 2020 highs0, 0.028 BTC (.786 Fib), and 0.0276 BTC.
On the other side, the first level of strong resistance lies at 0.0337 BTC (Nov 2020 Highs & upper boundary of the price channel). This is followed by 0.034 BTC (100-days EMA), 0.035 BTC, and 0.0361 BTC (March 2019 Highs).
Ripple
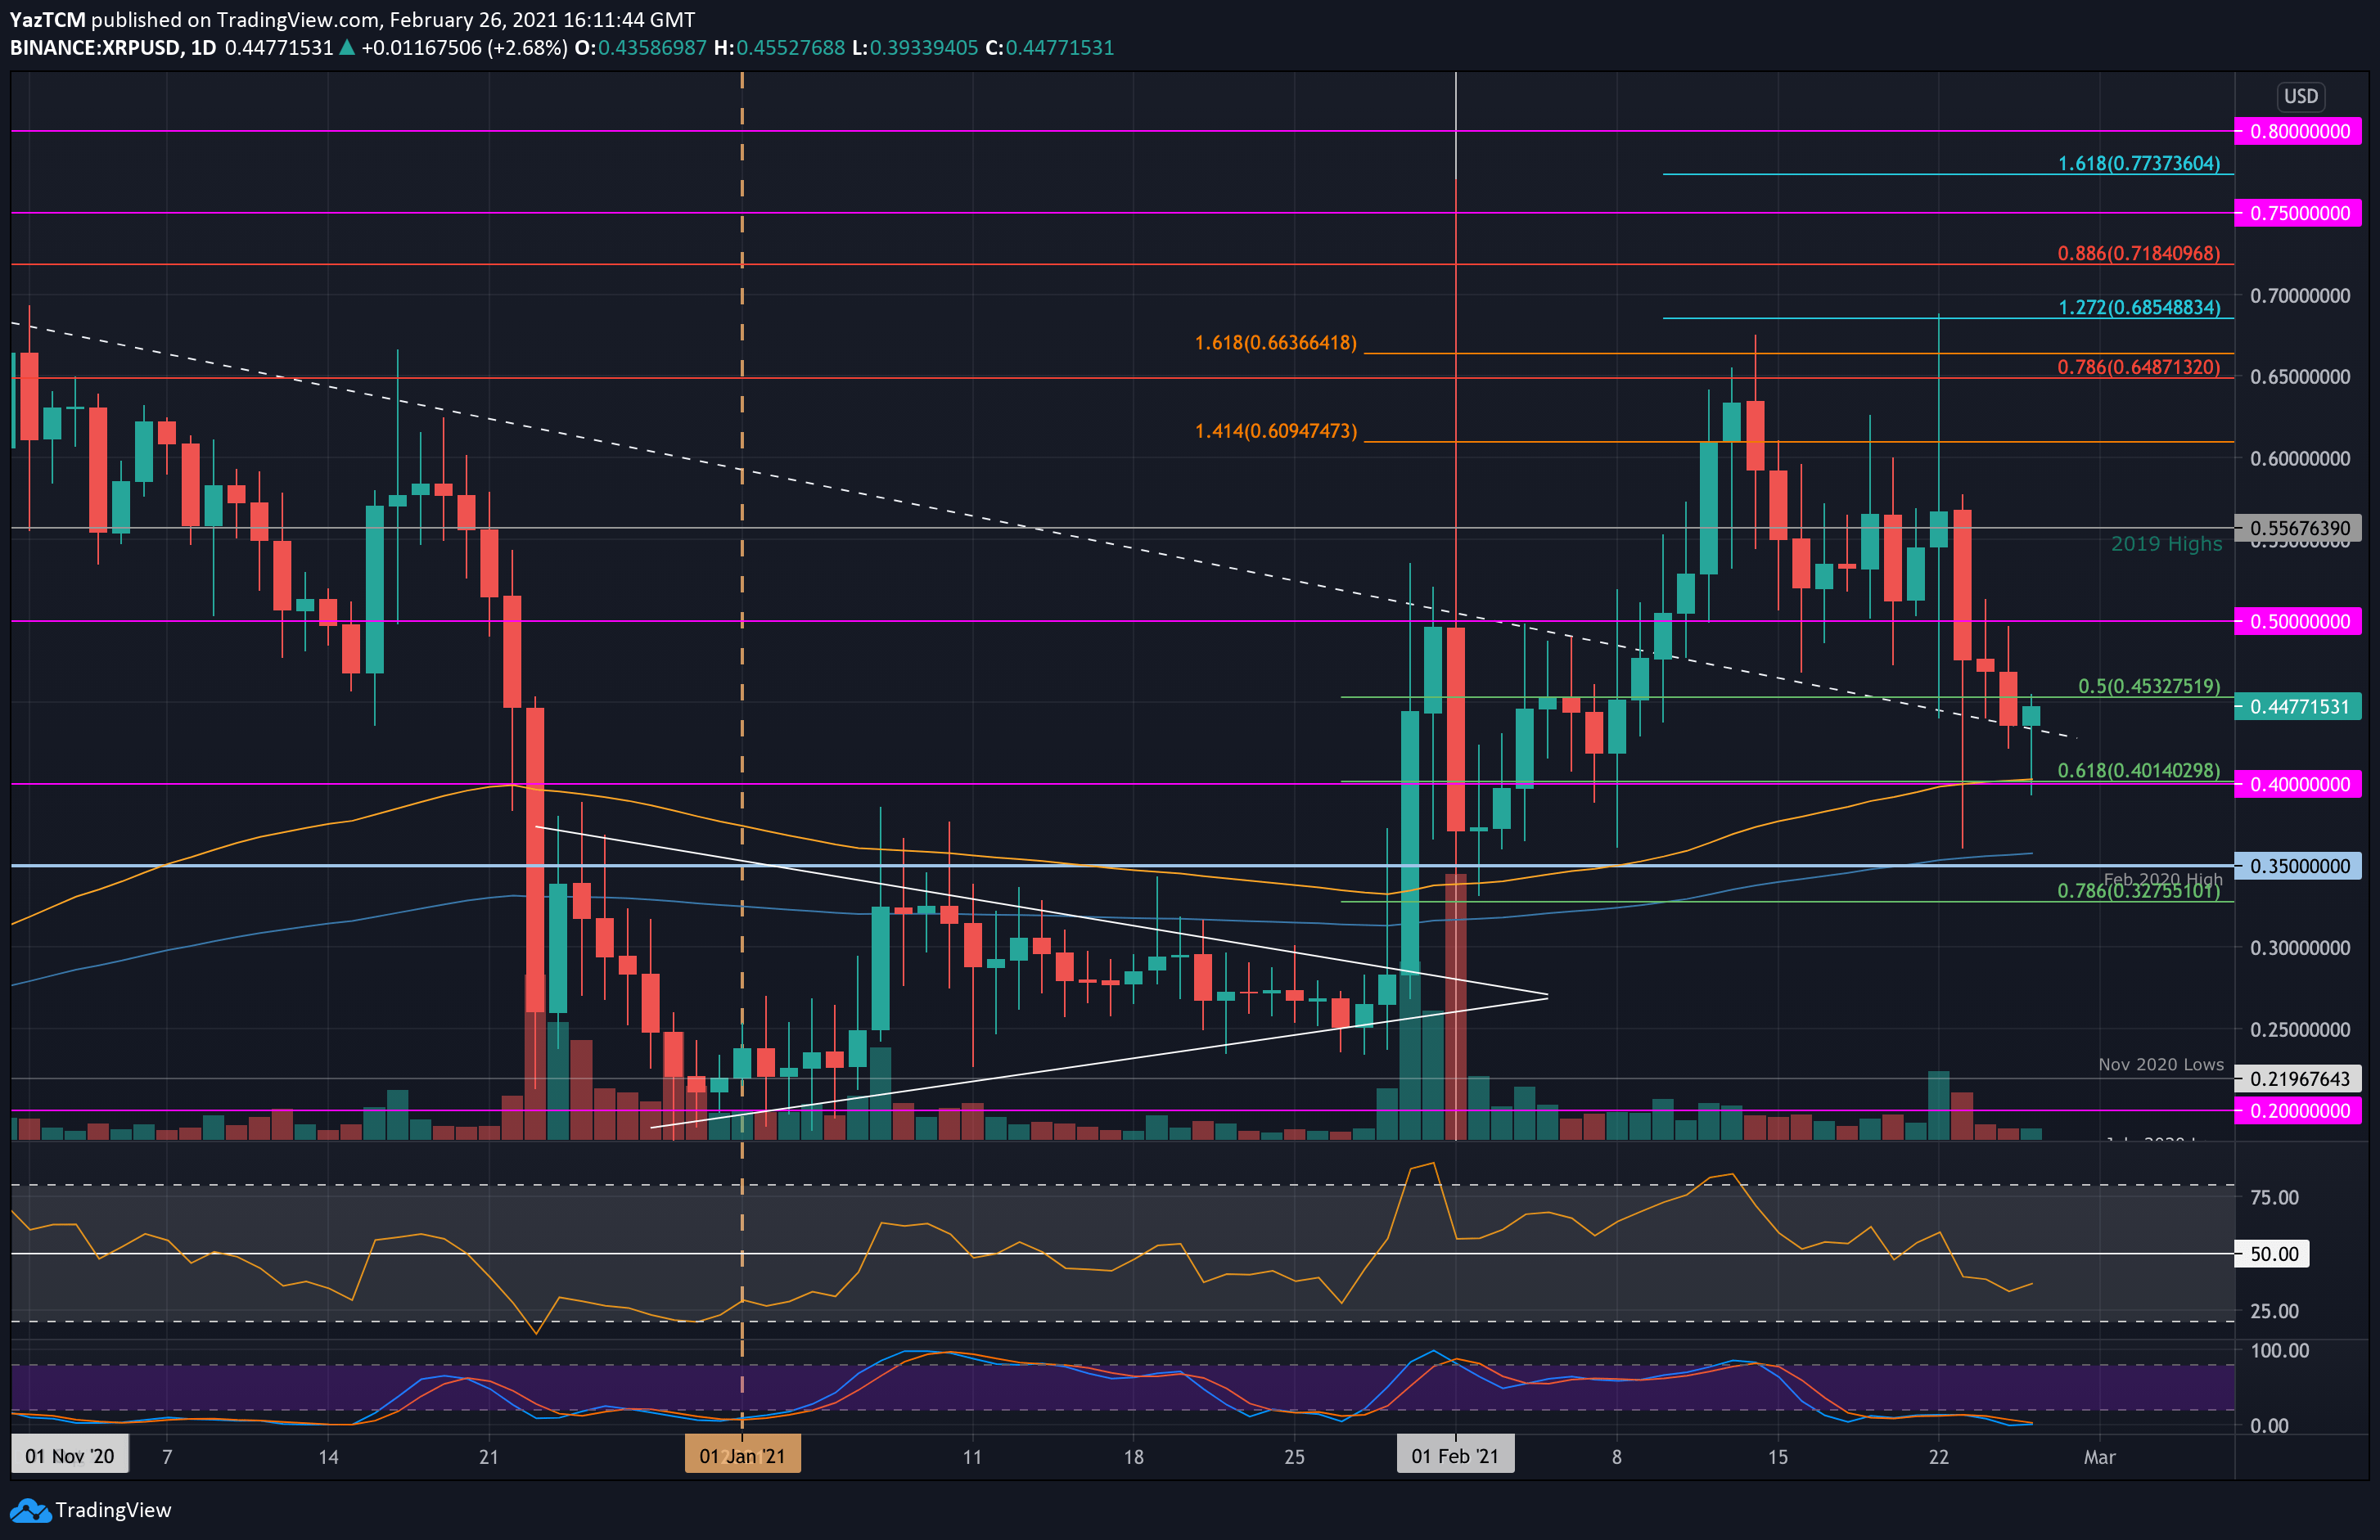
XRP also took a beating this week as it dropped by a total of 16% to reach the current $0.447 level. The cryptocurrency had seen an interesting week of trading after spiking as high as $0.685 on Monday when the rest of the market was tanking.
The bullish pressure quickly subsided by Tuesday, which saw XRP collapsing beneath the $0.5 support. The selling continued over the week, causing XRP to spike beneath $0.4 today briefly. It has since rebounded from there and is now attempting to reclaim $0.45.
Looking ahead, the first level of strong resistance lies at $0.5. This is followed by $0.556 (2019 Highs), $0.6, and $0.61. Added resistance lies at $0.45 (bearish .786 Fib) and $0.685 (1.272 Fib Extension).
On the other side, the first support lies at $0.401 (.618 Fib & 100-days EMA). Beneath this, support lies at $0.35 (200-days EMA & Feb 2020 Highs), $0.327 (.786 Fib), and $0.3.
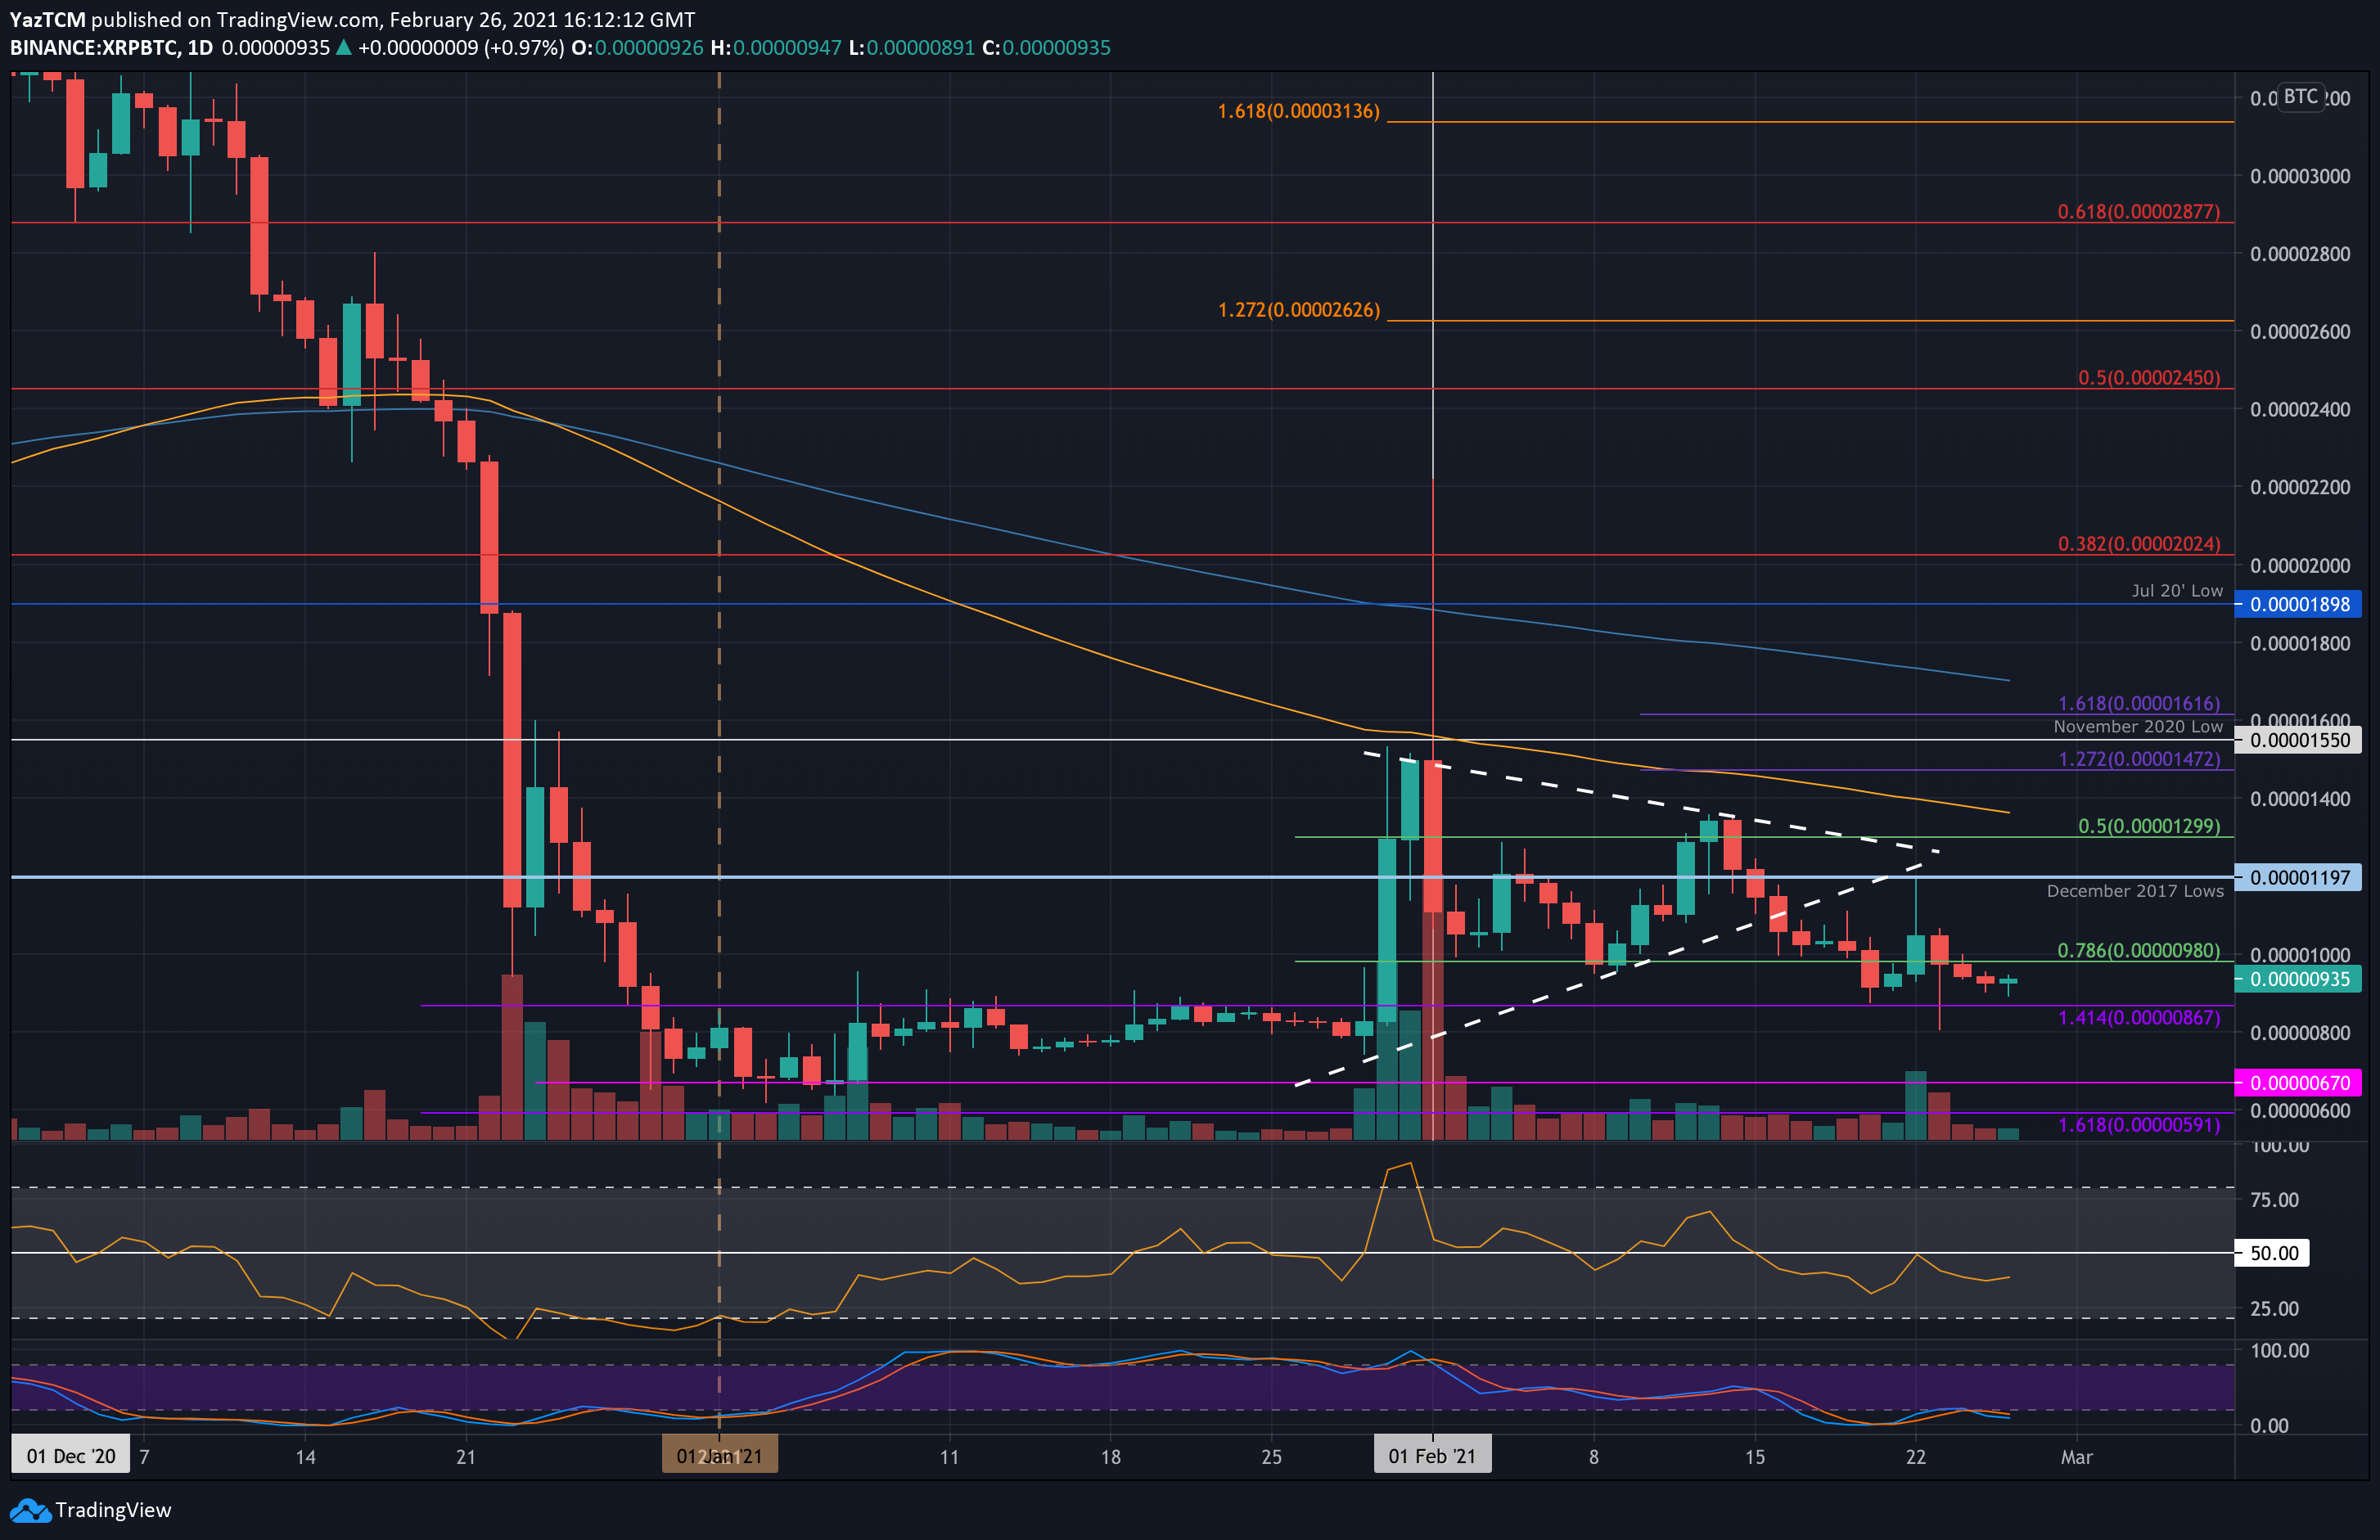
Against Bitcoin, XRP has been trading sideways this week. It did push higher from 900 SAT on Monday to spike as high as 1200 SAT (Dec 2017 lows). However, the bears quickly pushed XRP back beneath 1000 SAT over the course of the week to reach the current 935 SAT level.
Looking ahead, the first level of strong support lies at 867 SAT (January upper boundary range). This is followed by 800 SAT, 750 SAT, and 670 SAT (Jan lower boundary range).
On the other side, the first resistance lies at 1000 SAT. This is followed by 1200 SAT (Dec 2018 lows), 1300 SAT, and 1400 SAT (100-days EMA).
Polkadot
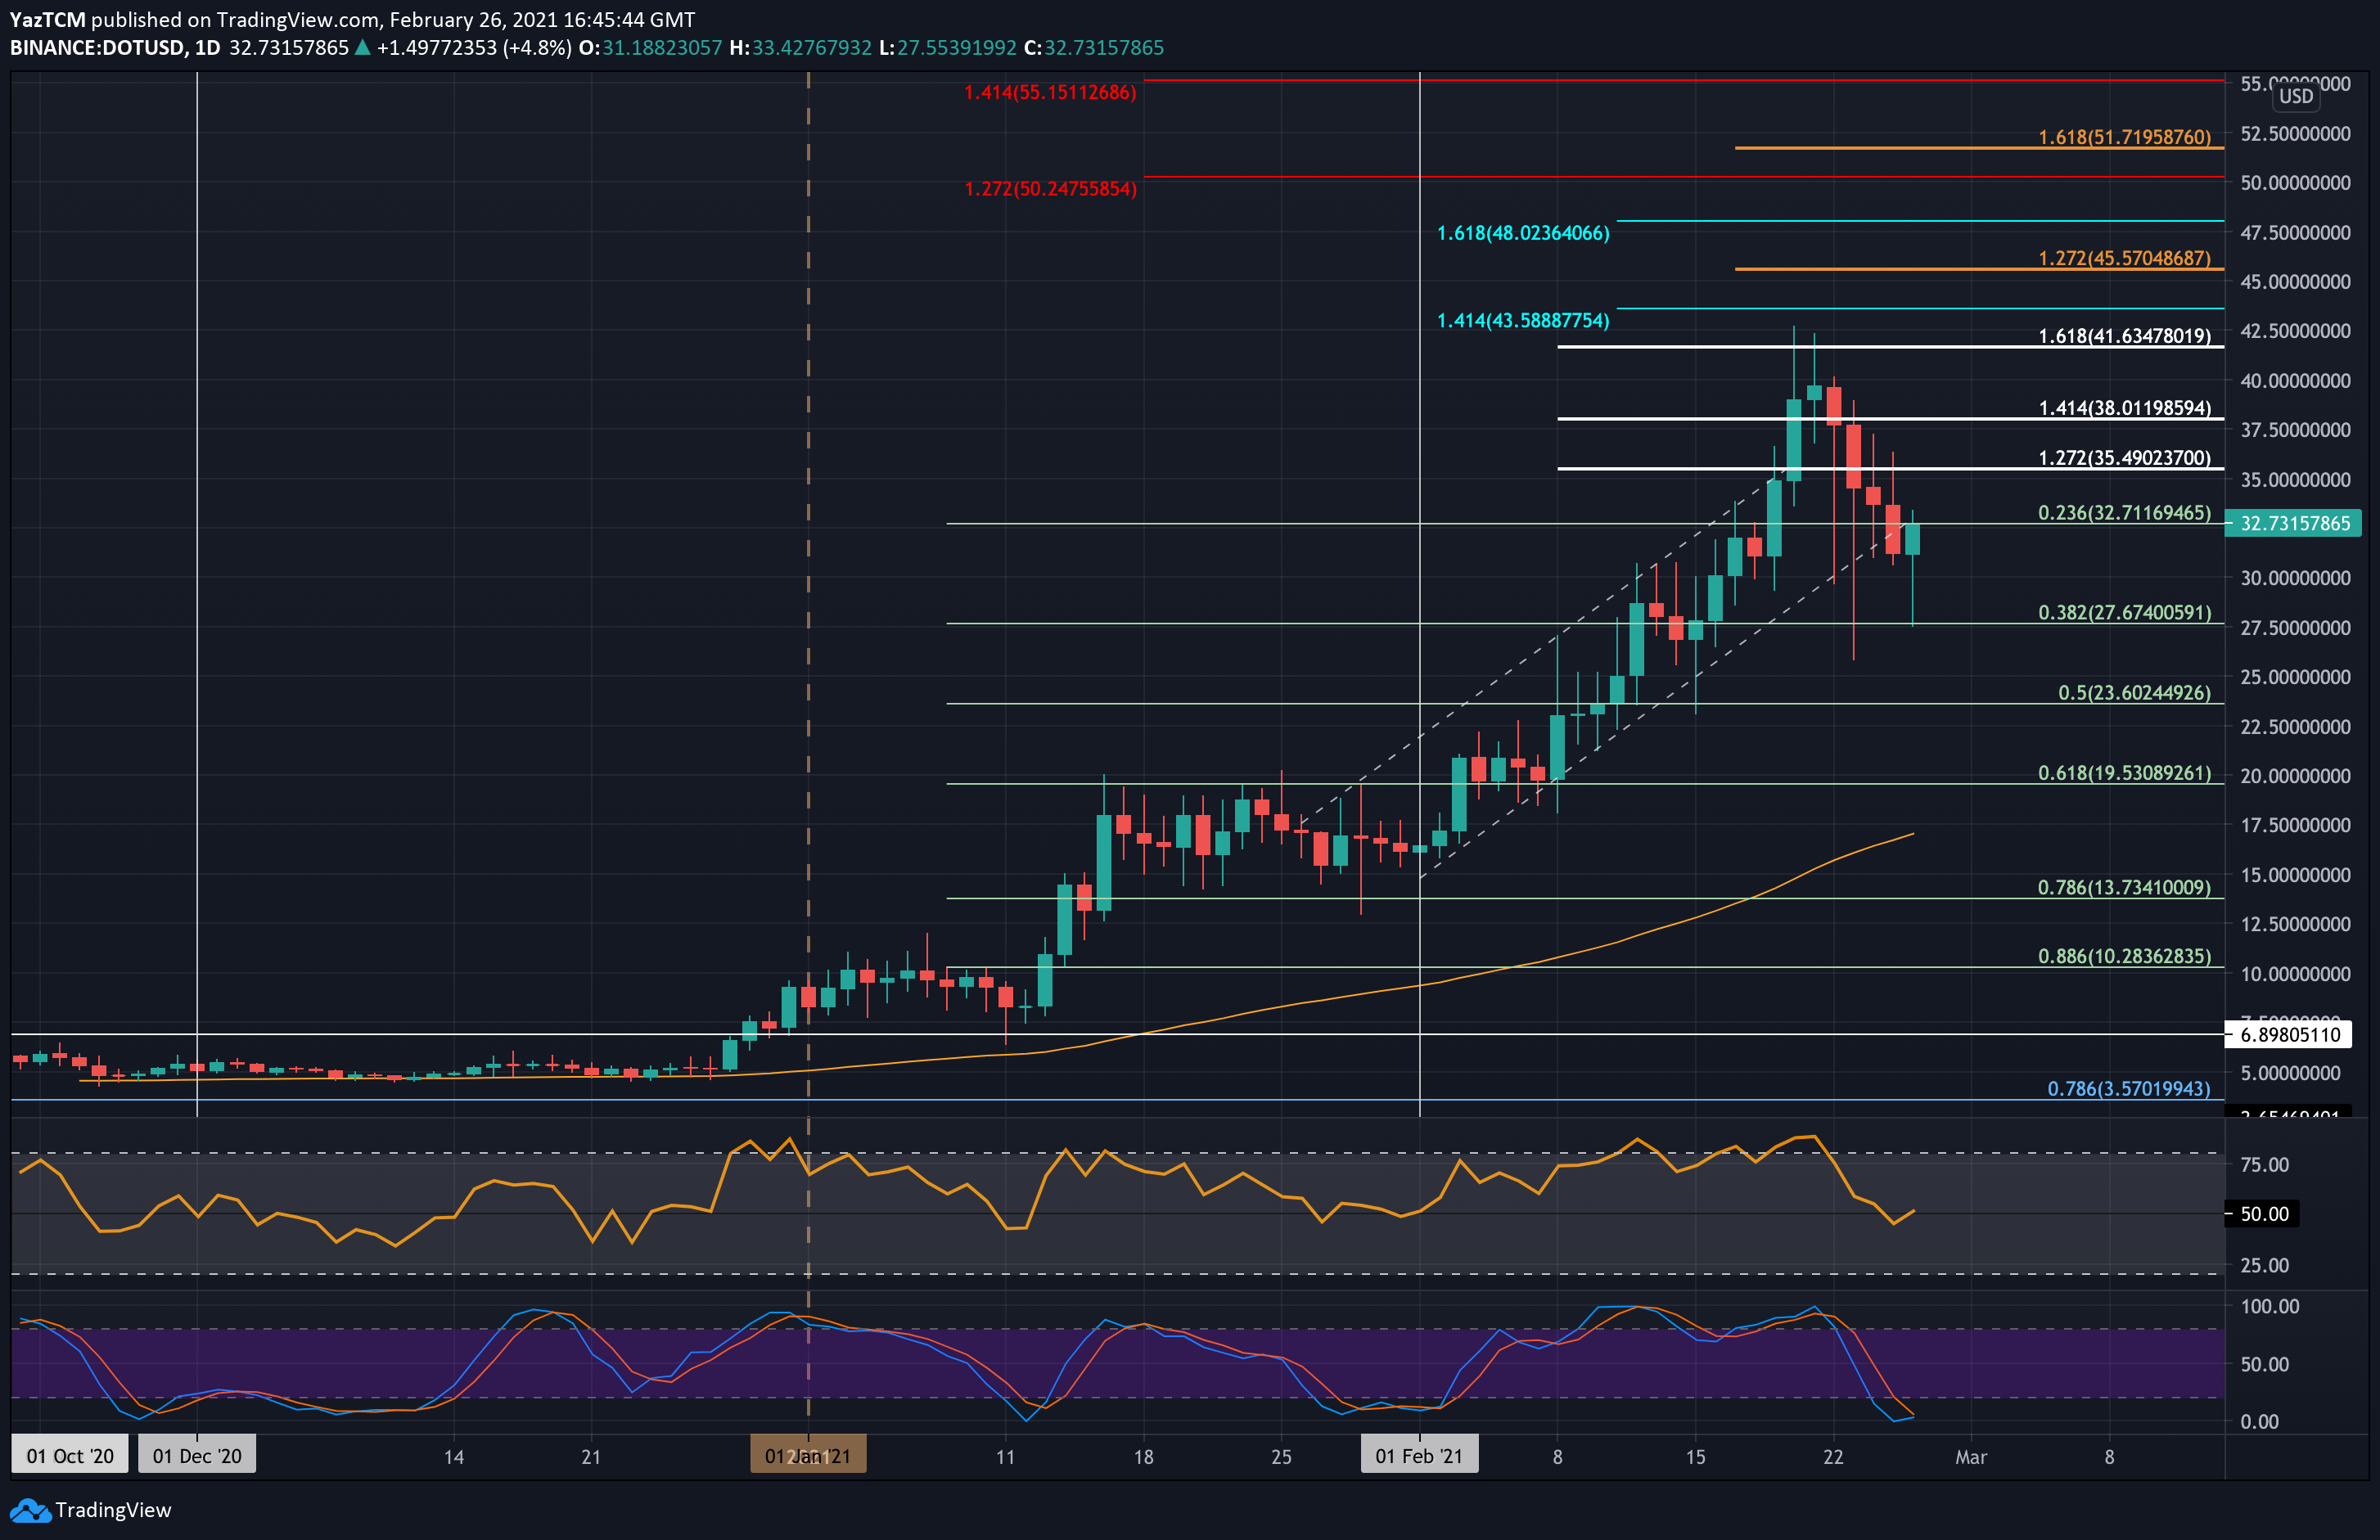
DOT managed to buck the bearish trend this week as it saw a small 5.8% price hike from where it was seven days ago. The cryptocurrency had turned parabolic over the weekend as it broke above an ascending price channel to set a new ATH price at $42.50.
From there, it rolled over and started heading lower throughout the week. Today, DOT spiked as low as $27.67 (.382 Fib) but quickly rebounded from there is now trading back above $30 at $32.73.
Looking ahead, the first level of resistance lies at $33. This is followed by $35.50 (1.272 Fib Extension), $38 (1.414 Fib Extension), $40, and $41.63 (1.618 Fib Extension). Additional resistance is found at $42.50 (ATH) and $43.60.
On the other side, the first support lies at $30. This is followed by $27.67 (.382 Fib), $25, and $23.60 (.5 Fib). Added support lies at $22.50 and $19.53 (.618 Fib).
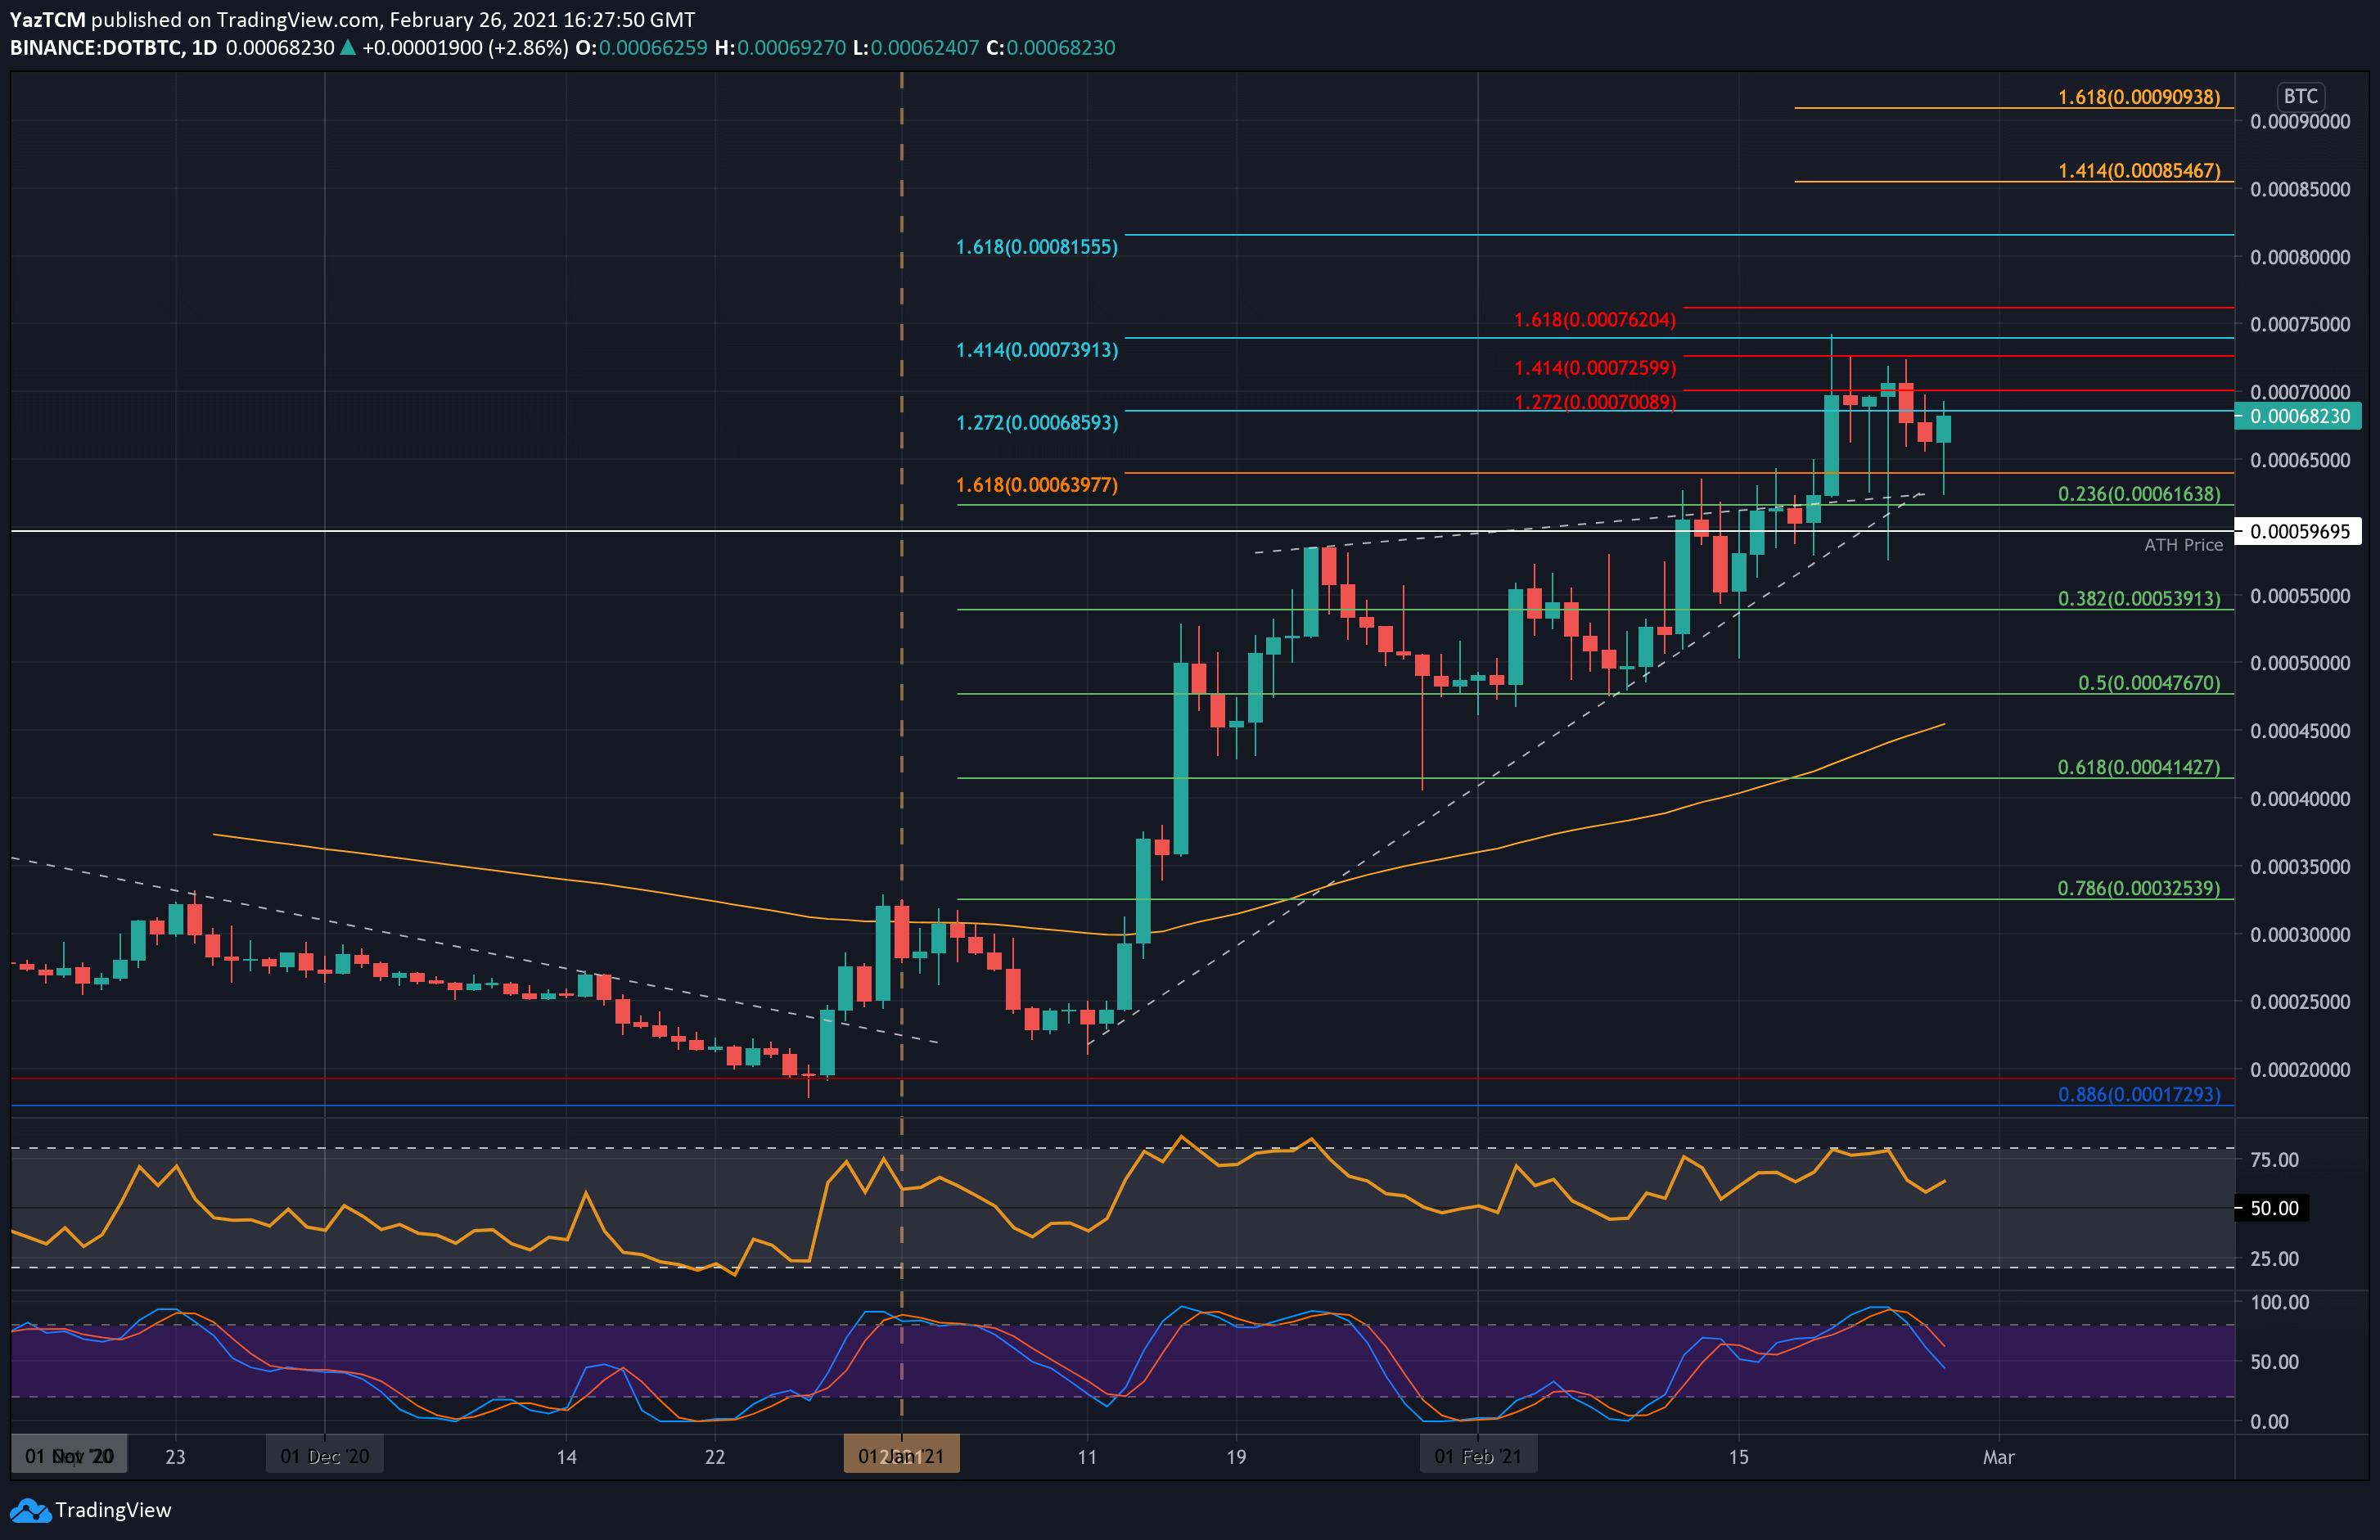
Against Bitcoin DOT is also performing well as it stayed at a similar level to where it was trading last week. It had surged as high as 0.00073 BTC (1.414 Fib Extension) on Sunday. From there, it started to move sideways as it found support at 0.000686 BTC over the week.
This support was eventually broken yesterday, which saw DOT falling as low as 00.00062 BTC today. It has since rebounded and is now trading at 0.000682 BTC.
Looking ahead, the first resistance lies at 0.0007 BTC (1.272 Fib Extension – red). This is followed by 0.000726 BTC (1.414 Fib Extension – red), 0.00074 BTC(ATH price), and 0.000762 BTC (1.618 Fib Extension – red). Added resistance is found at 0.0008 BTC and 0.00085 BTC.
On the other side, the first support lies at 0.00065 BTC. This is followed by 0.000616 BTC (.236 Fib), 0.000596 BTC, and 0.000539 BTC (.382 Fib). Additional support is found at 0.0005 BTC and 0.000475 BTC (.5 Fib).
Chainlink
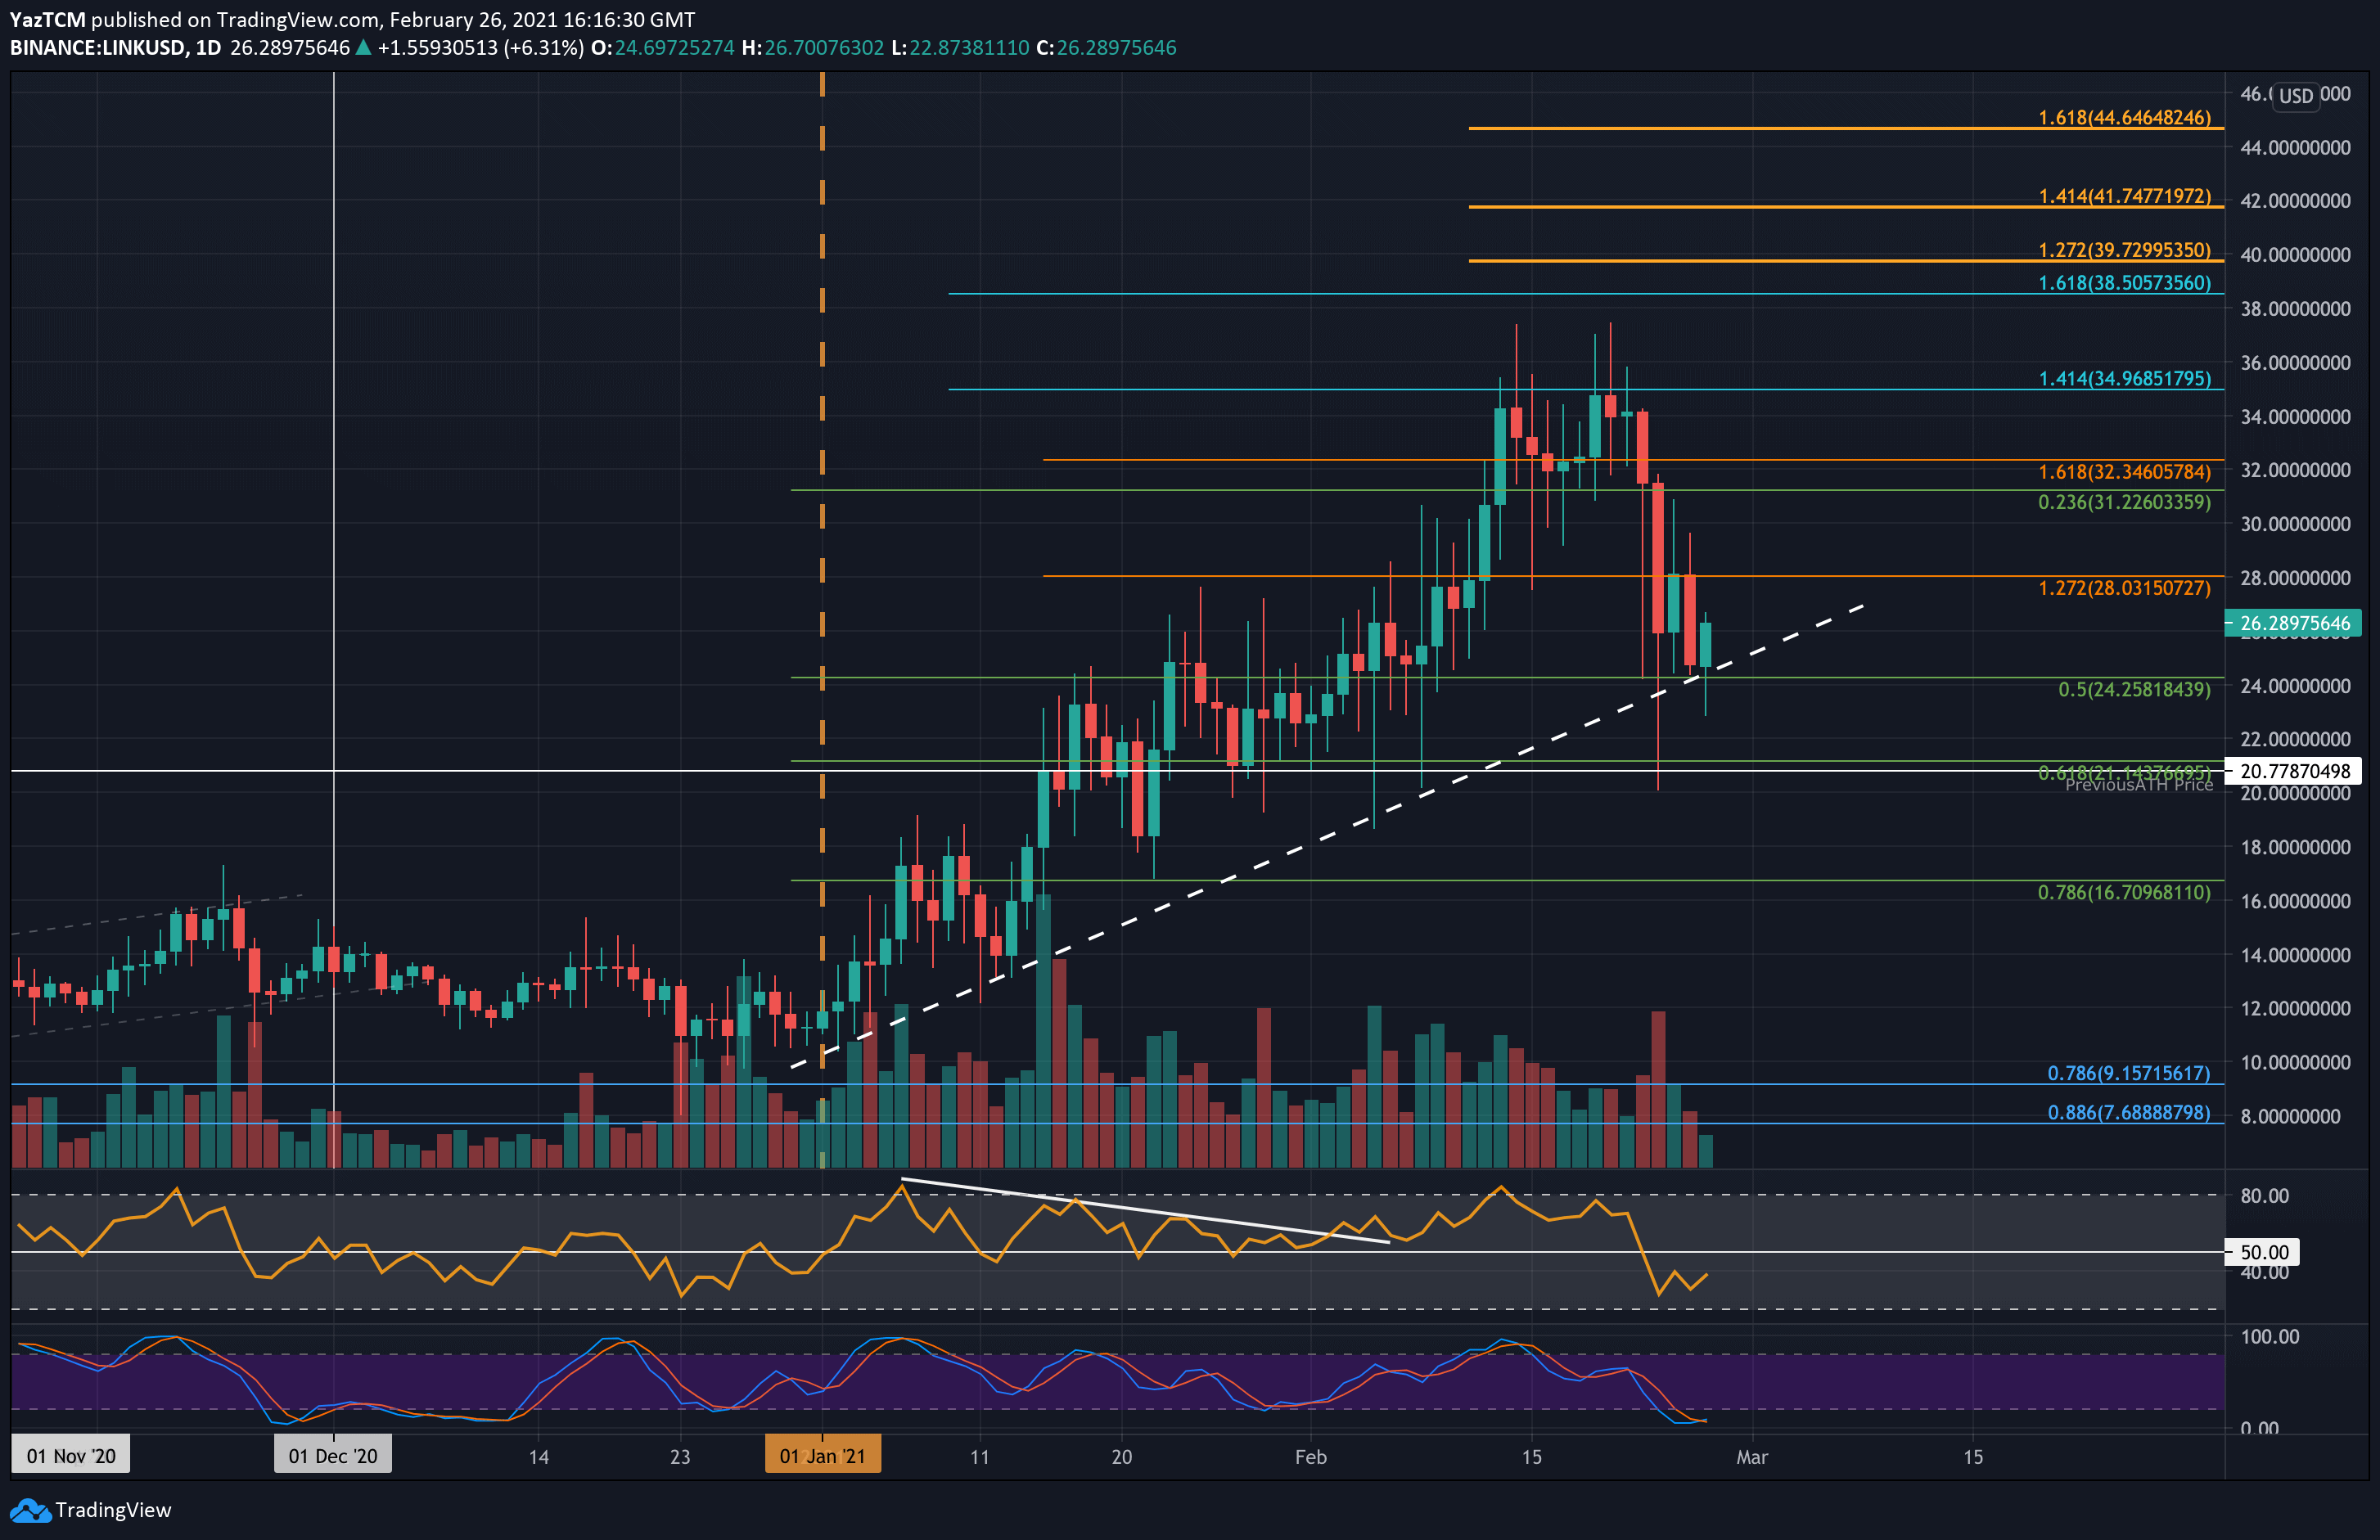
LINK saw a heavy 17.5% price drop this week as the coin slips into the $26.28 level. Over the weekend, LINK set a new ATH price at $37.45 but failed to close a daily candle above the resistance at $34.97 (1.414 Fib Extension).
From there, it started to head lower during the week until support was found at $24.25 (.5 Fib). This support was further bolstered by a rising trend line. LINK has rebounded from this support today to climb back above $26.
Looking ahead, the first resistance lies at $28. This is followed by $30, $32.35, and $34.96 (1.414 Fib Extension). Added resistance lies at $37.45 (ATH price), $38.50 (1.618 Fib Extension), and $40.
On the other side, the first strong support lies at $24.25 (.5 Fib). This is followed by $22, $21.15 (.618 Fib), and $20.
Against Bitcoin, LINK has been struggling over the past fortnight. It dropped from 0.00075 BTC and continued to slide over the past two weeks until support was found this week at 0.000526 BTC (April 2020 Highs).
Looking ahead, the first support lies at 0.000526 BTC. This is followed by 0.0005 BTC, 0.000474 BTC (downside 1.272 Fib Extension), 0.000461 BTC (.786 Fib), and 0.00045 BTC.
On the other side, resistance is first expected at 0.00058 BTC. This is followed by 0.0006 BTC, 0.00065 BTC, and 0.0007 BTC.
