This week saw nothing but green on the cryptocurrency markets as it seems everything is surging. Ethereum charted a new ATH, as well as many other altcoins, while Bitcoin attempts to reclaim K.BitcoinBitcoin saw a 15% price surge this week as the sentiment starts to turn bullish again for the primary cryptocurrency. The coin had been in a consolidation phase since hitting its ATH price at ,000 last month. Since then, it has pretty much traded sideways within the confines of a descending triangle pattern.On Tuesday, Bitcoin managed to break toward this triangle’s upside, signaling the start of the bullish momentum ahead. It continued higher throughout the week until reaching ,748 yesterday. It is now trading at ,120.Looking ahead, the first level of strong resistance lies at
Topics:
Yaz Sheikh considers the following as important: ADABTC, ADAUSD, Bitcoin (BTC) Price, BTC Analysis, BTCEUR, BTCGBP, btcusd, btcusdt, Cardano (ADA) Price, Chainlink (LINK) Price, ETH Analysis, ETHBTC, Ethereum (ETH) Price, ethusd, LINKBTC, LINKUSD, Market Updates, Price Analysis, Ripple (XRP) Price, xrpbtc, xrpusd
This could be interesting, too:
Mandy Williams writes Bitcoin ETFs Record Over .6B in Outflows in the Past 2 Weeks
Dimitar Dzhondzhorov writes Millions of ADA Sold by Cardano Whales During Market Crash – Will the Decline Continue?
Chayanika Deka writes Bitcoin Whales Offload 6,813 BTC as Selling Pressure Mounts
Wayne Jones writes Bitcoin Sentiment Hits 2022 Lows as Fear & Greed Index Falls to 10
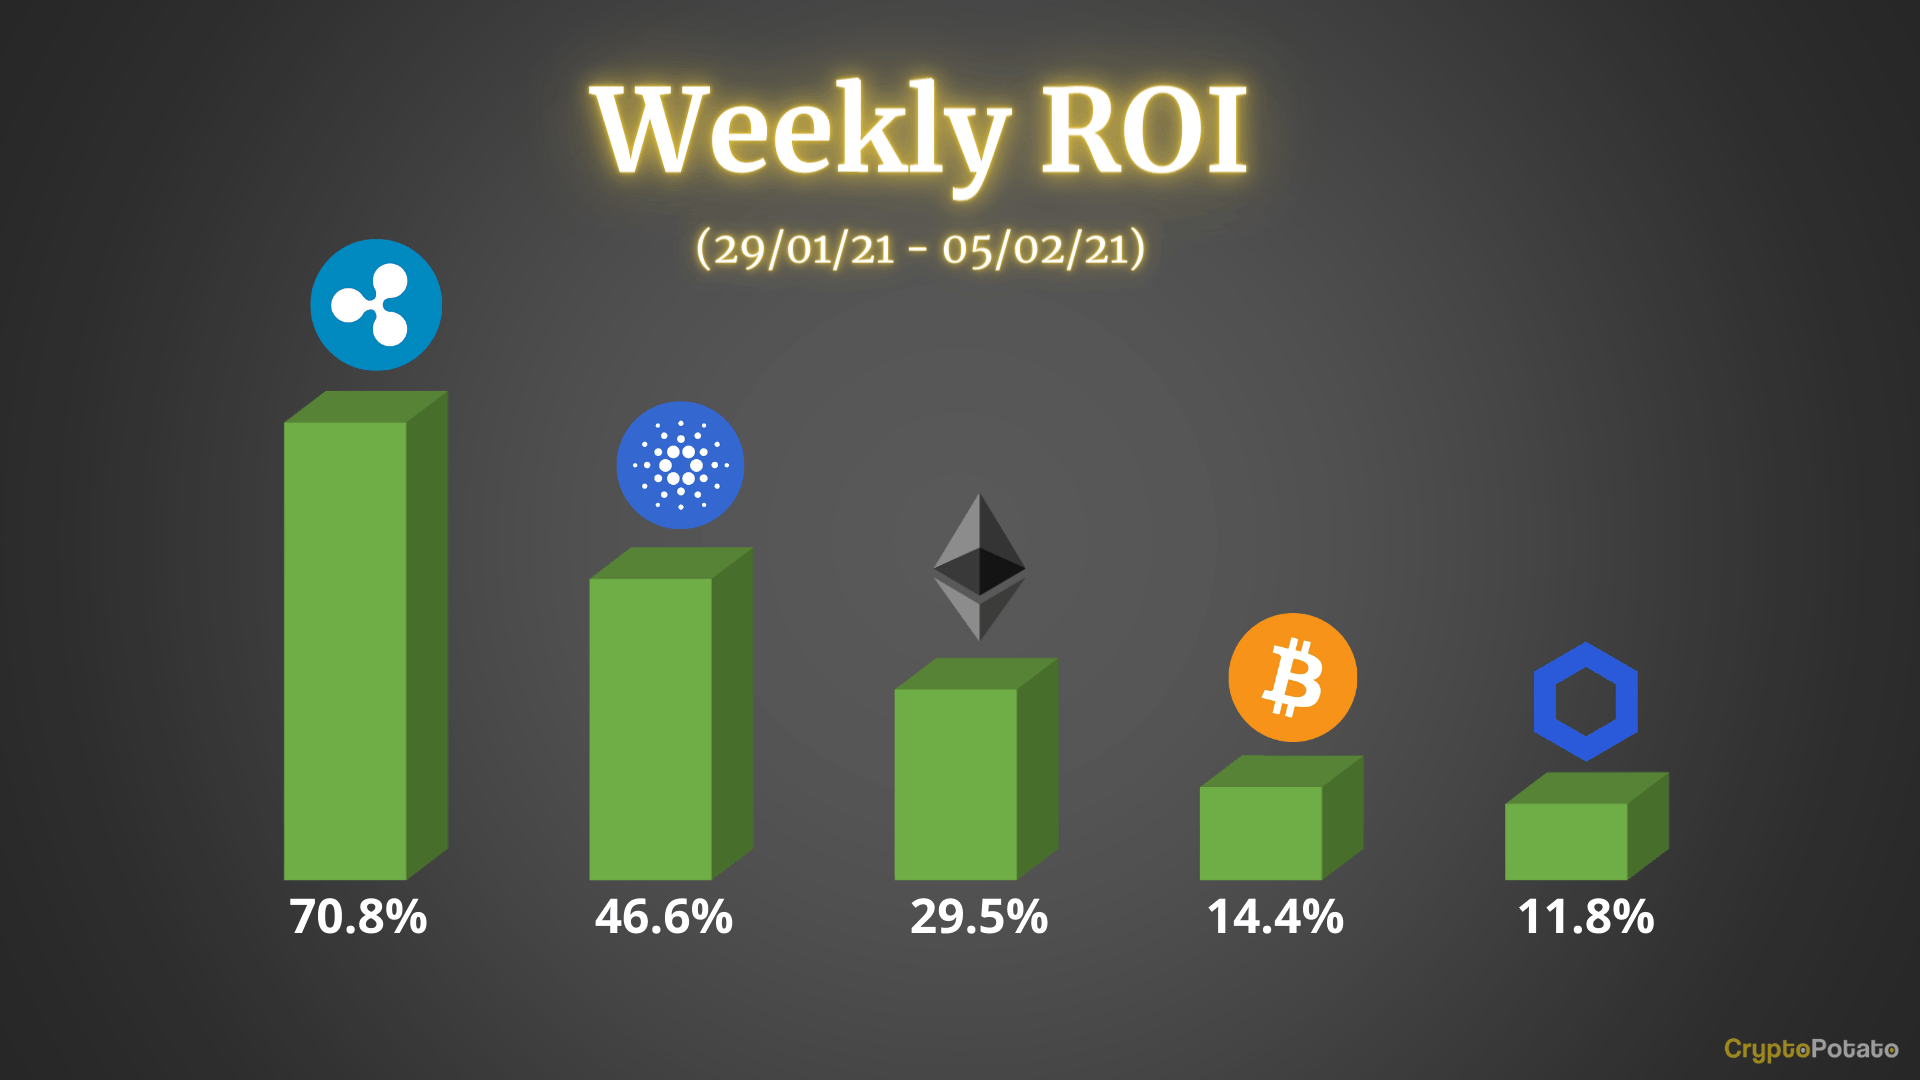
This week saw nothing but green on the cryptocurrency markets as it seems everything is surging. Ethereum charted a new ATH, as well as many other altcoins, while Bitcoin attempts to reclaim $38K.
Bitcoin
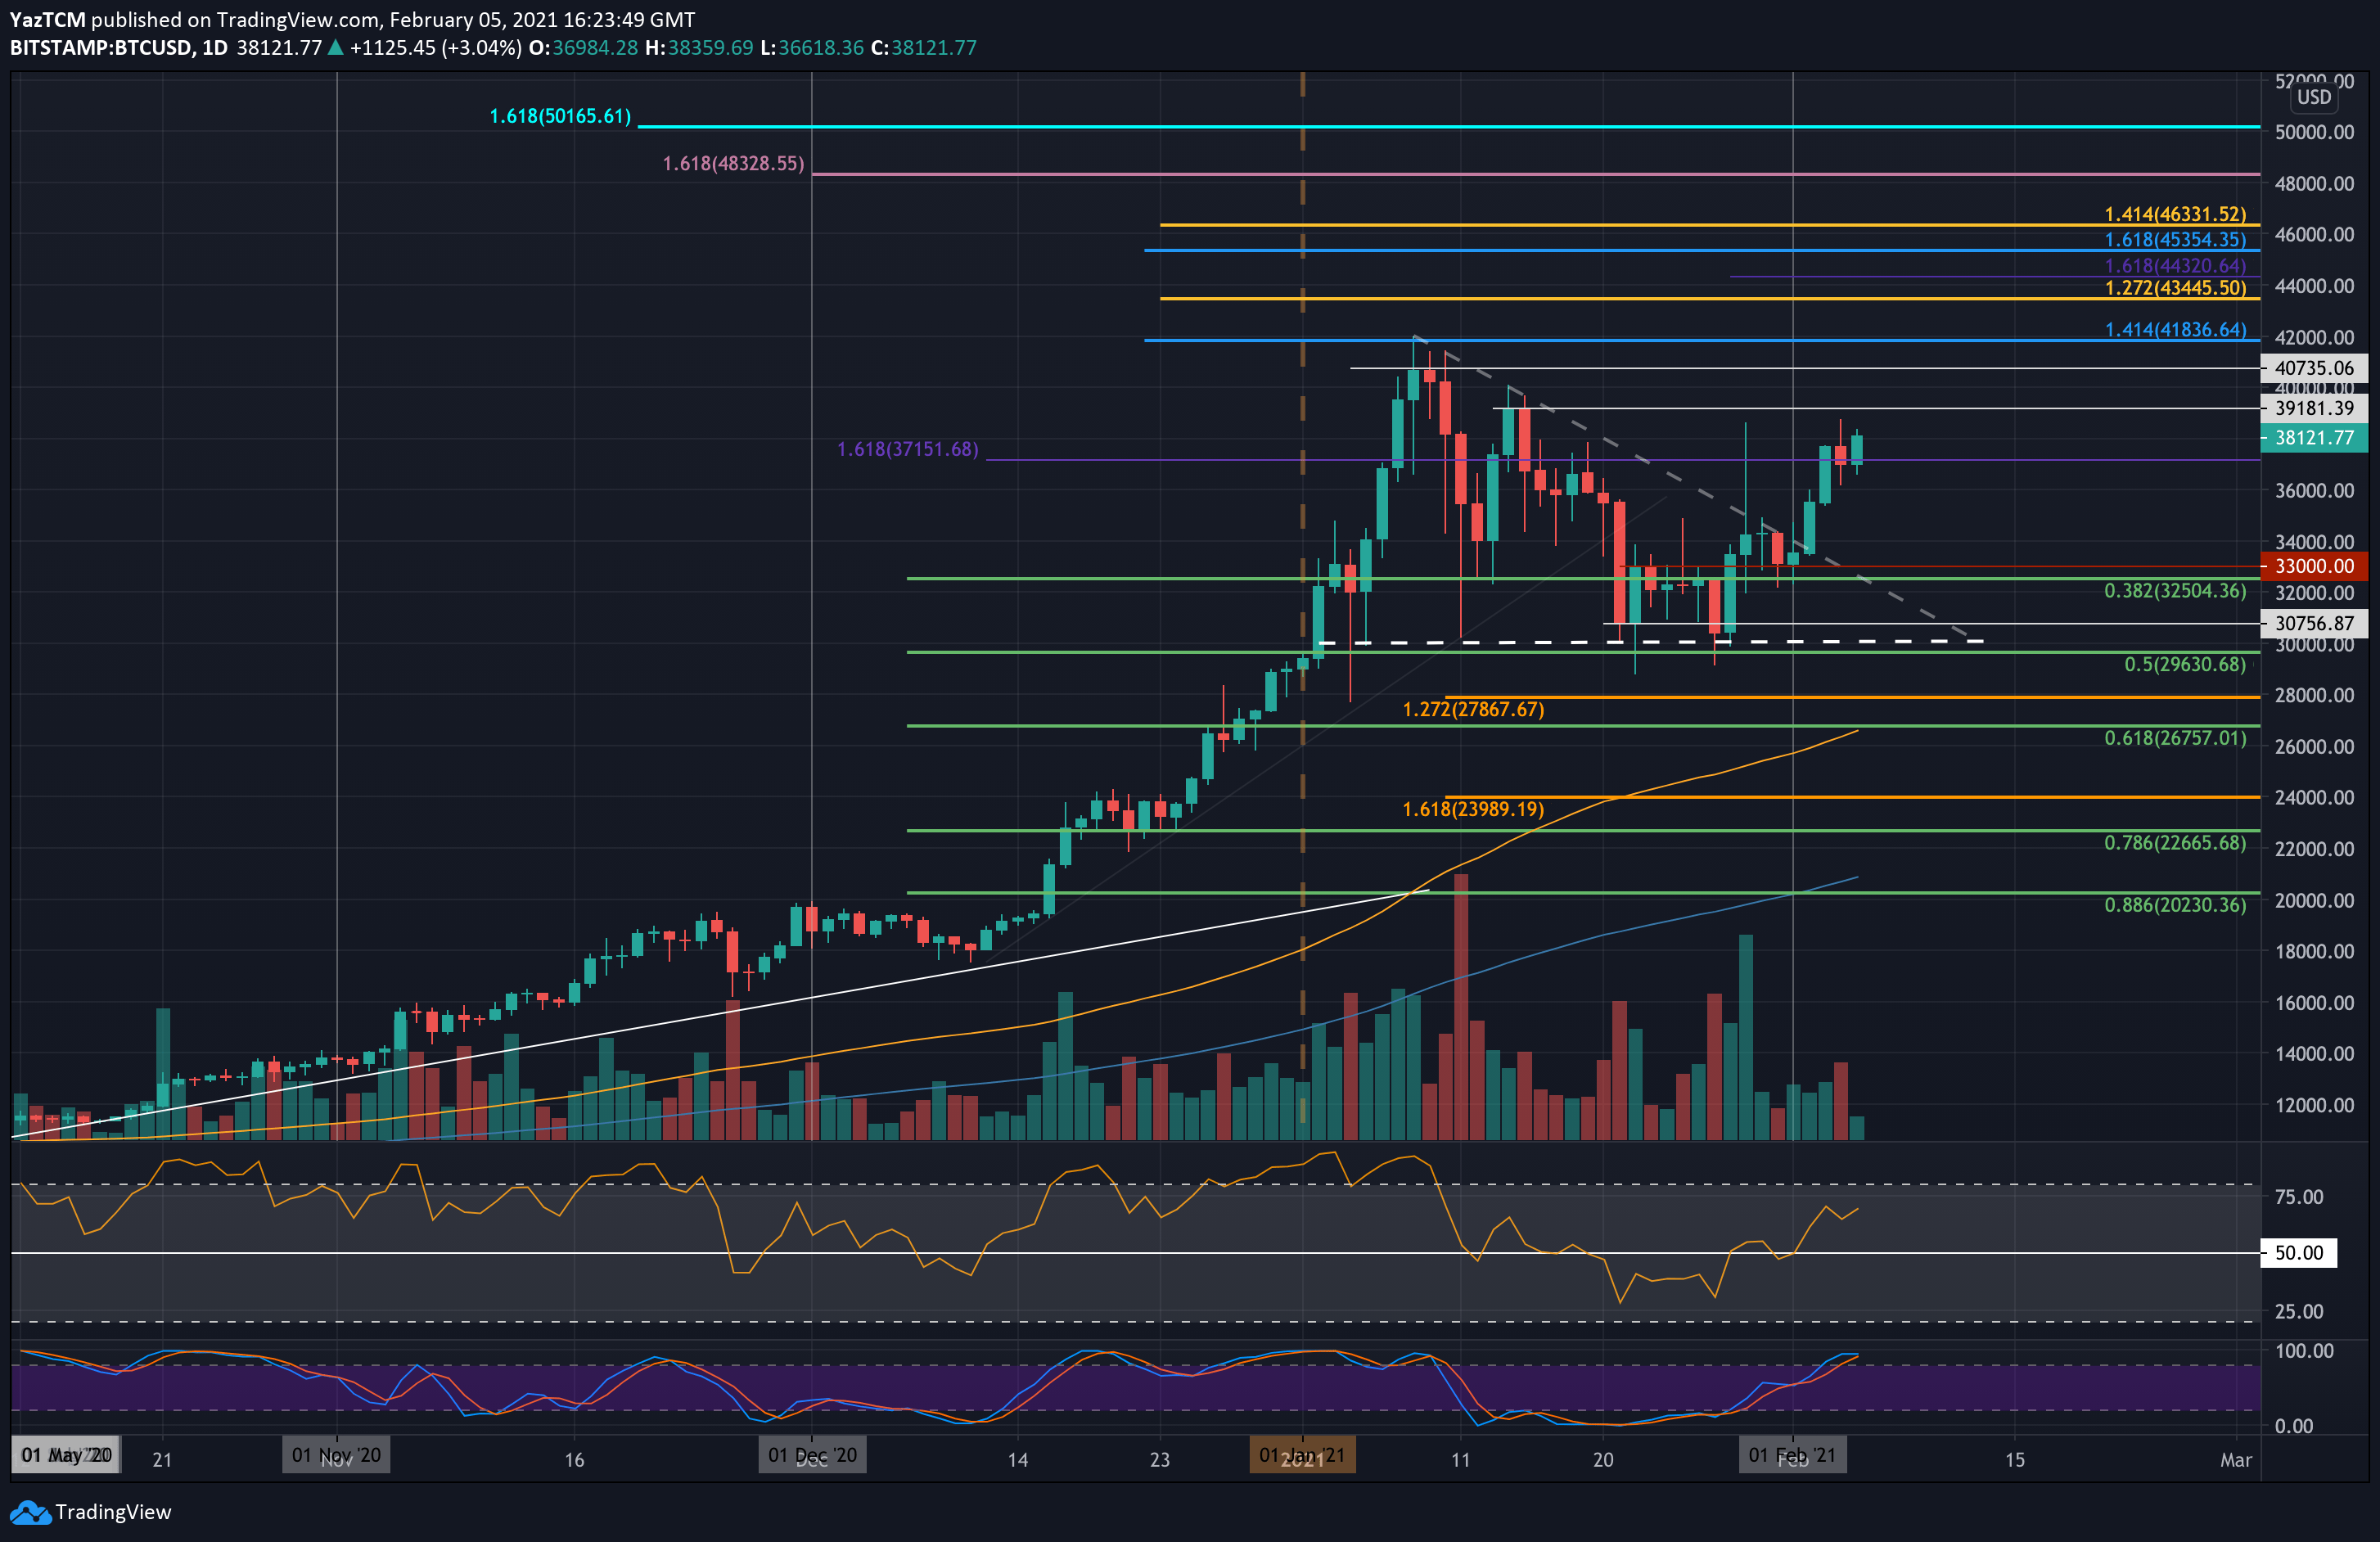
Bitcoin saw a 15% price surge this week as the sentiment starts to turn bullish again for the primary cryptocurrency. The coin had been in a consolidation phase since hitting its ATH price at $42,000 last month. Since then, it has pretty much traded sideways within the confines of a descending triangle pattern.
On Tuesday, Bitcoin managed to break toward this triangle’s upside, signaling the start of the bullish momentum ahead. It continued higher throughout the week until reaching $38,748 yesterday. It is now trading at $38,120.
Looking ahead, the first level of strong resistance lies at $39,180. This is followed by $40,000, $40,735, and then the ATH price of $42,000. Beyond the ATH, additional resistance lies at $43,4445 (1.272 Fib Extension – yellow), $44,320 (short term 1.618 Fib Extension), and $46,331 (1.414 Fib Extnesion – yellow).
On the other side, the first support lies at $36,000. This is followed by $35,140, $34,000, and $33,000. Additional support is found at $32,500 (.382 Fib), $30,750, and $30,000.
Ethereum
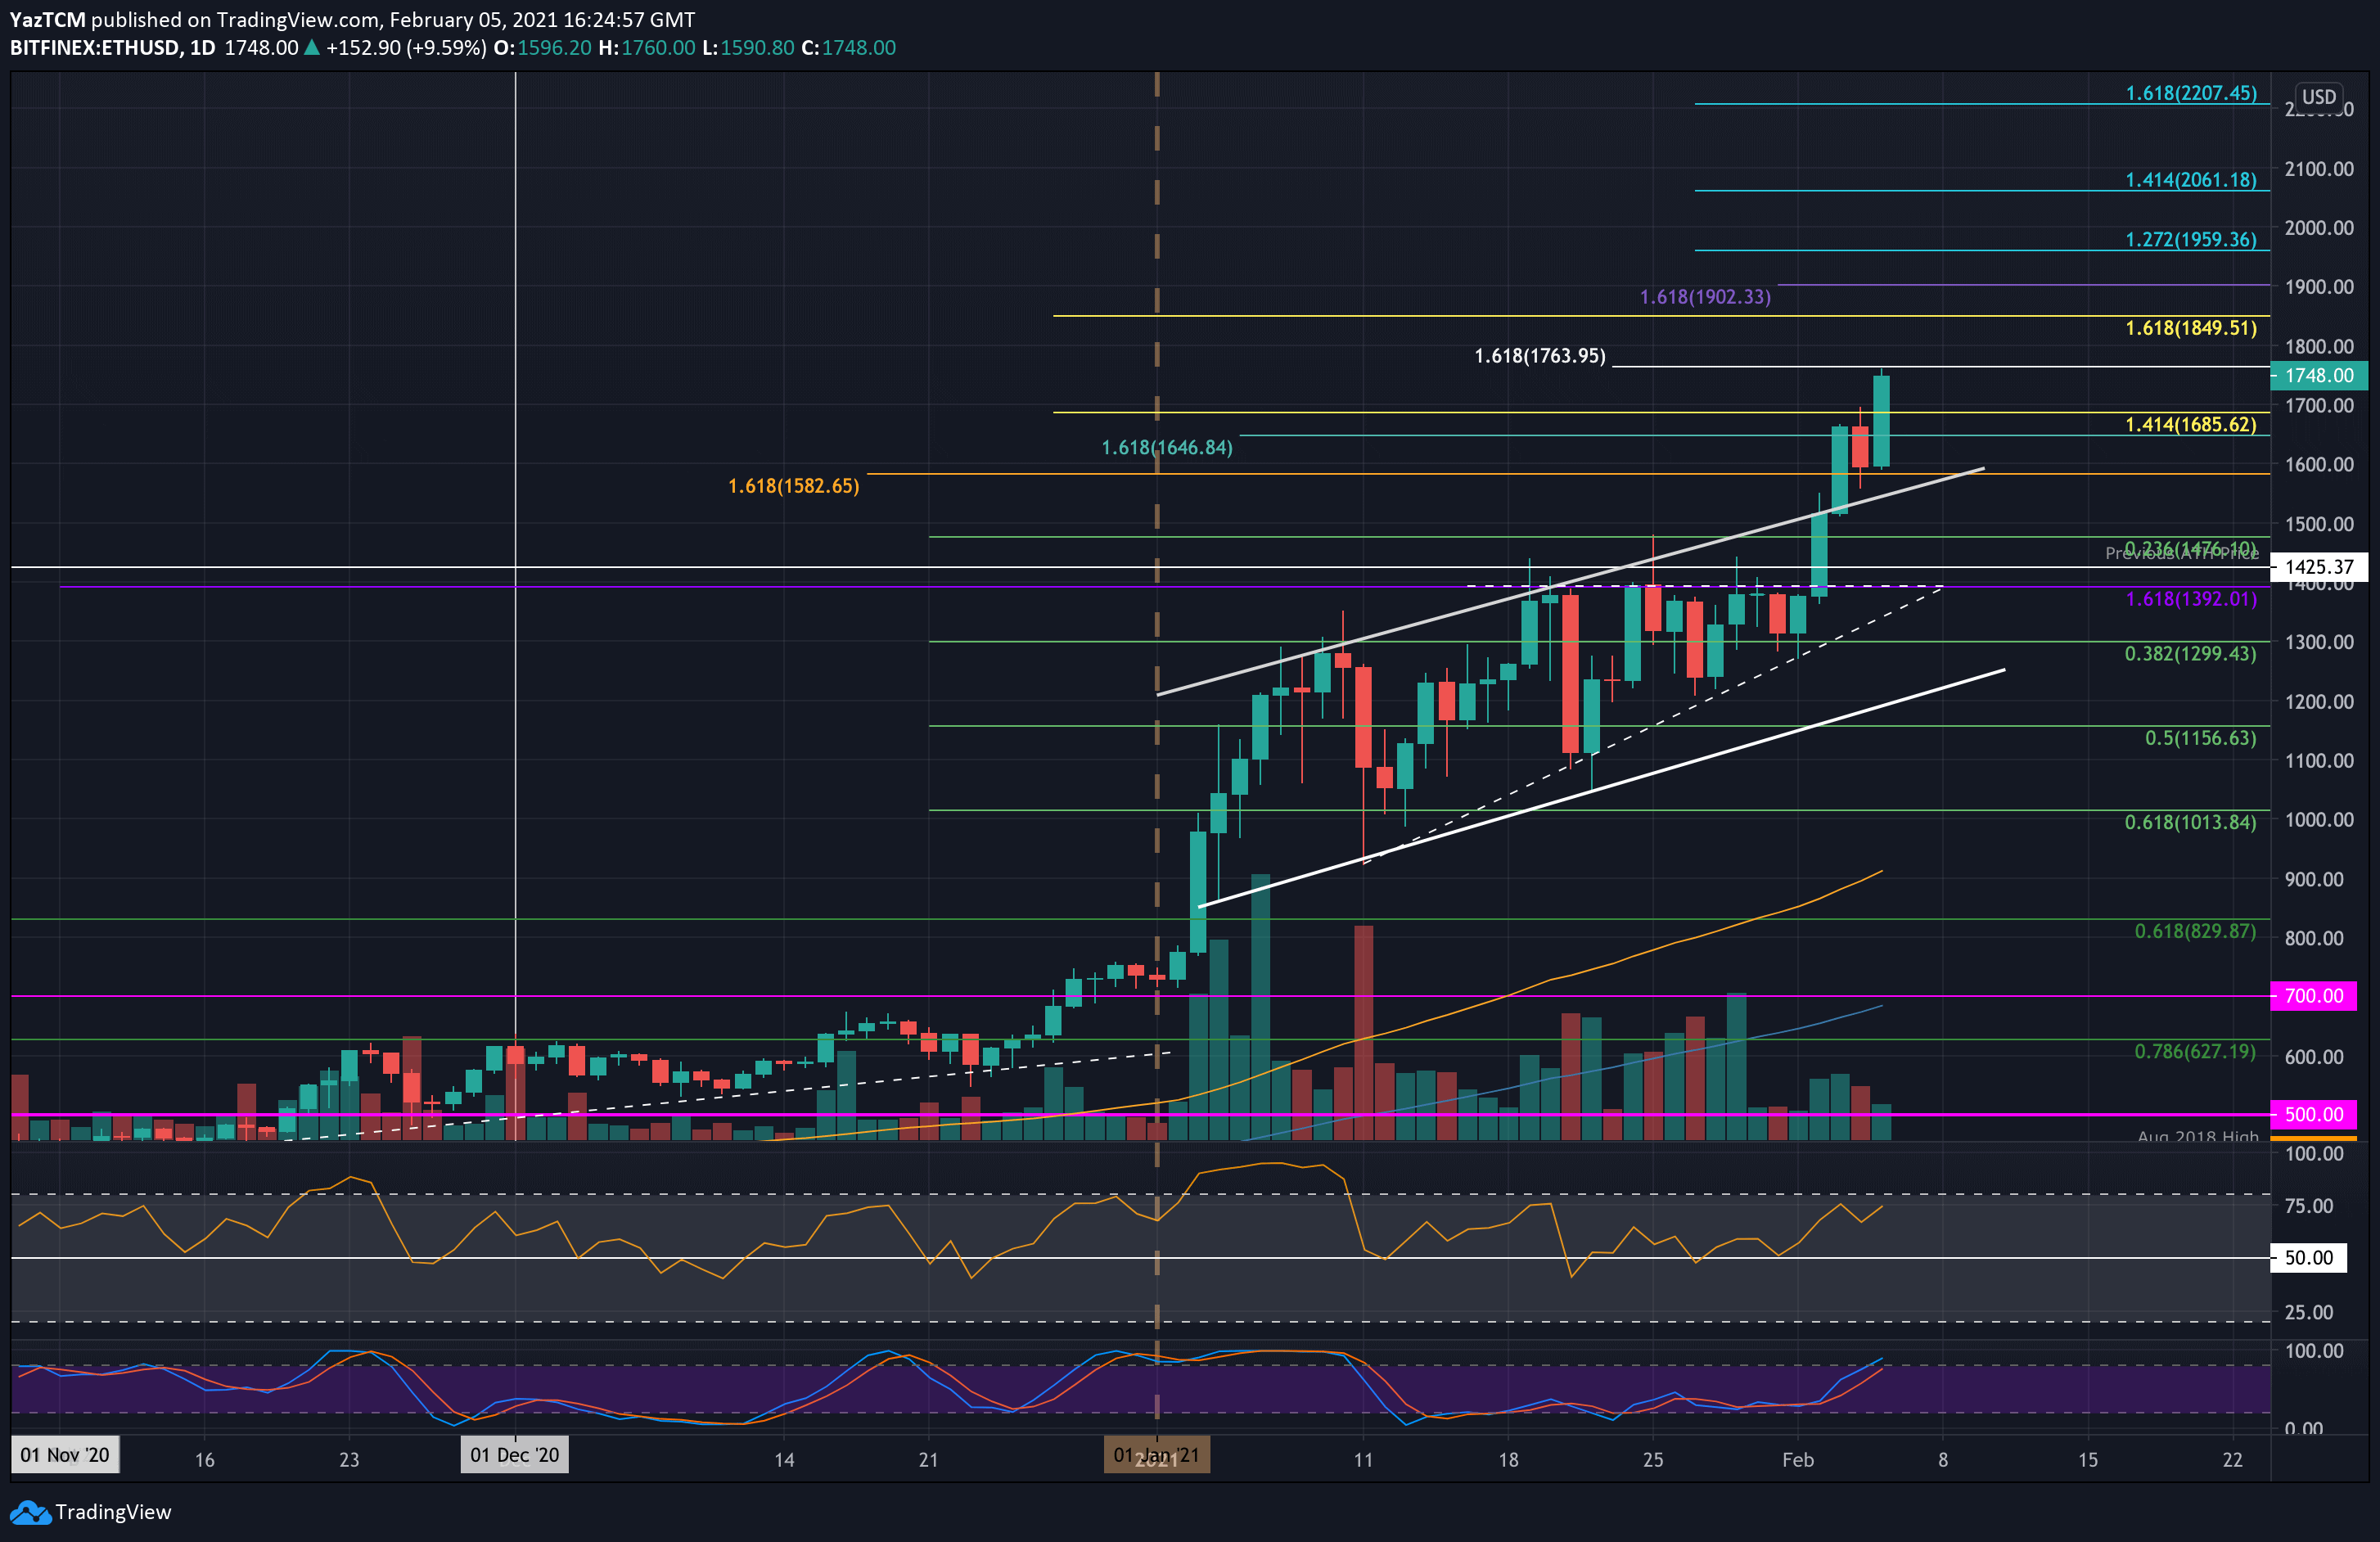
Ethereum is up by a whopping 30% over the course of the past week as it reached a new ATH price of $1784 today. The cryptocurrency was also trading in a phase of consolidation at the start of the week as it remained trapped inside an ascending triangle pattern, with the roof at $1392.
On Tuesday, ETH managed to smash above the triangle as it started. On Wednesday, it managed to break the upper boundary of an ascending price channel, turning the market parabolic.
Today, it surged by another 7.6%, allowing the coin to reach $1784 (1.618 Fib Extension).
Looking ahead, if the buyers break the new ATH and push above $1800, the first resistance lies at $1850 (1.618 Fib Extension – yellow). This is followed by $1900, $1960 (1.272 Fib Extension), $2000, and $2060 (1.414 Fib Extension).
On the other side, the first support lies at $1700. This is followed by $1700, $1476 (.236 Fib), $1425, and $1390.
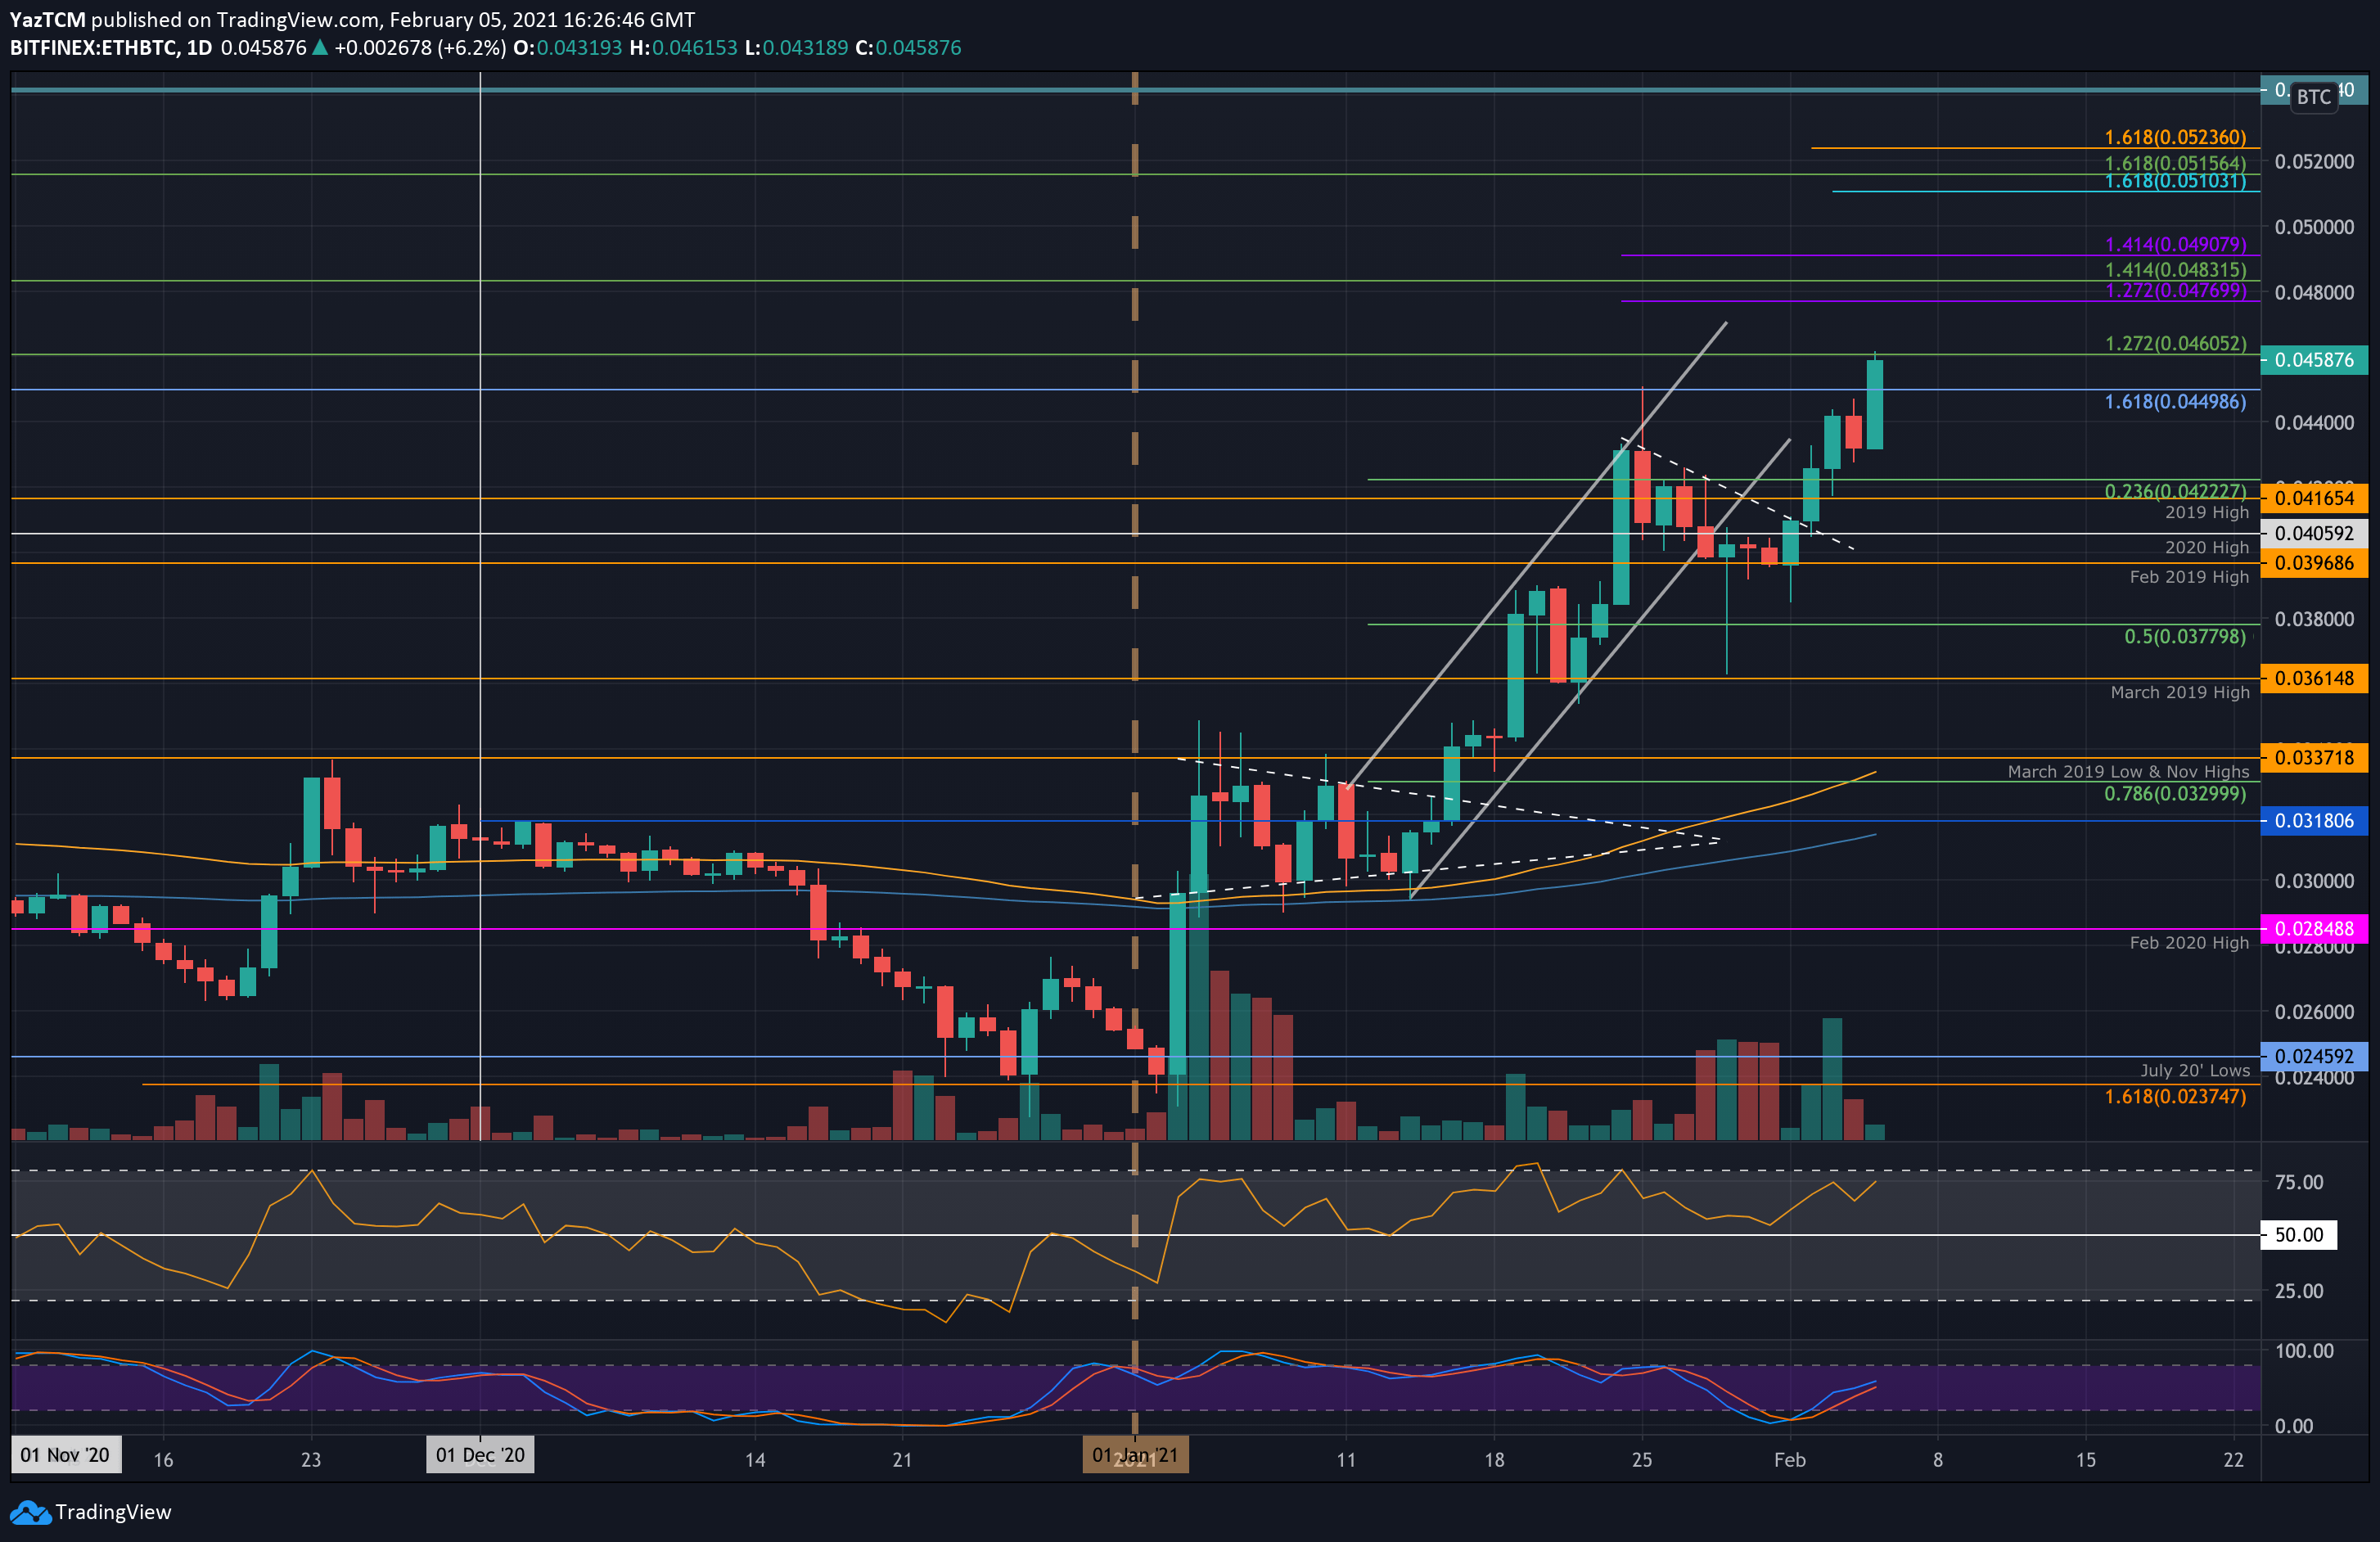
Ethereum is also performing remarkably well against Bitcoin. It started the week by rebounding from the Feb 2019 support at 0.039 BTC as it pushed above a descending trend line. From there, it started to surge higher until meeting resistance at 0.044 BTC on Wednesday.
Today, ETH managed to push beyond 0.044 BTC as it reached the resistance at 0.046 BTC (1.272 Fib Extension).
Looking ahead, the first level of resistance lies at 0.0476 BTC. This is followed by 0.0483 BTC (1.414 Fib Extension), 0.049 BTC, and 0.05 BTC. Added resistance is found at 0.051 BTC, 0.0515 BTC, and 0.0523 BTC.
On the other side, the first support lies at 0.044 BTC. This is followed by 0.0422 BTC (.236 Fib), 0.0416 BTC (2019 High), 0.0405 BTC (2020 High), and 0.0396 (Feb 20119 High & .382 Fib).
Ripple
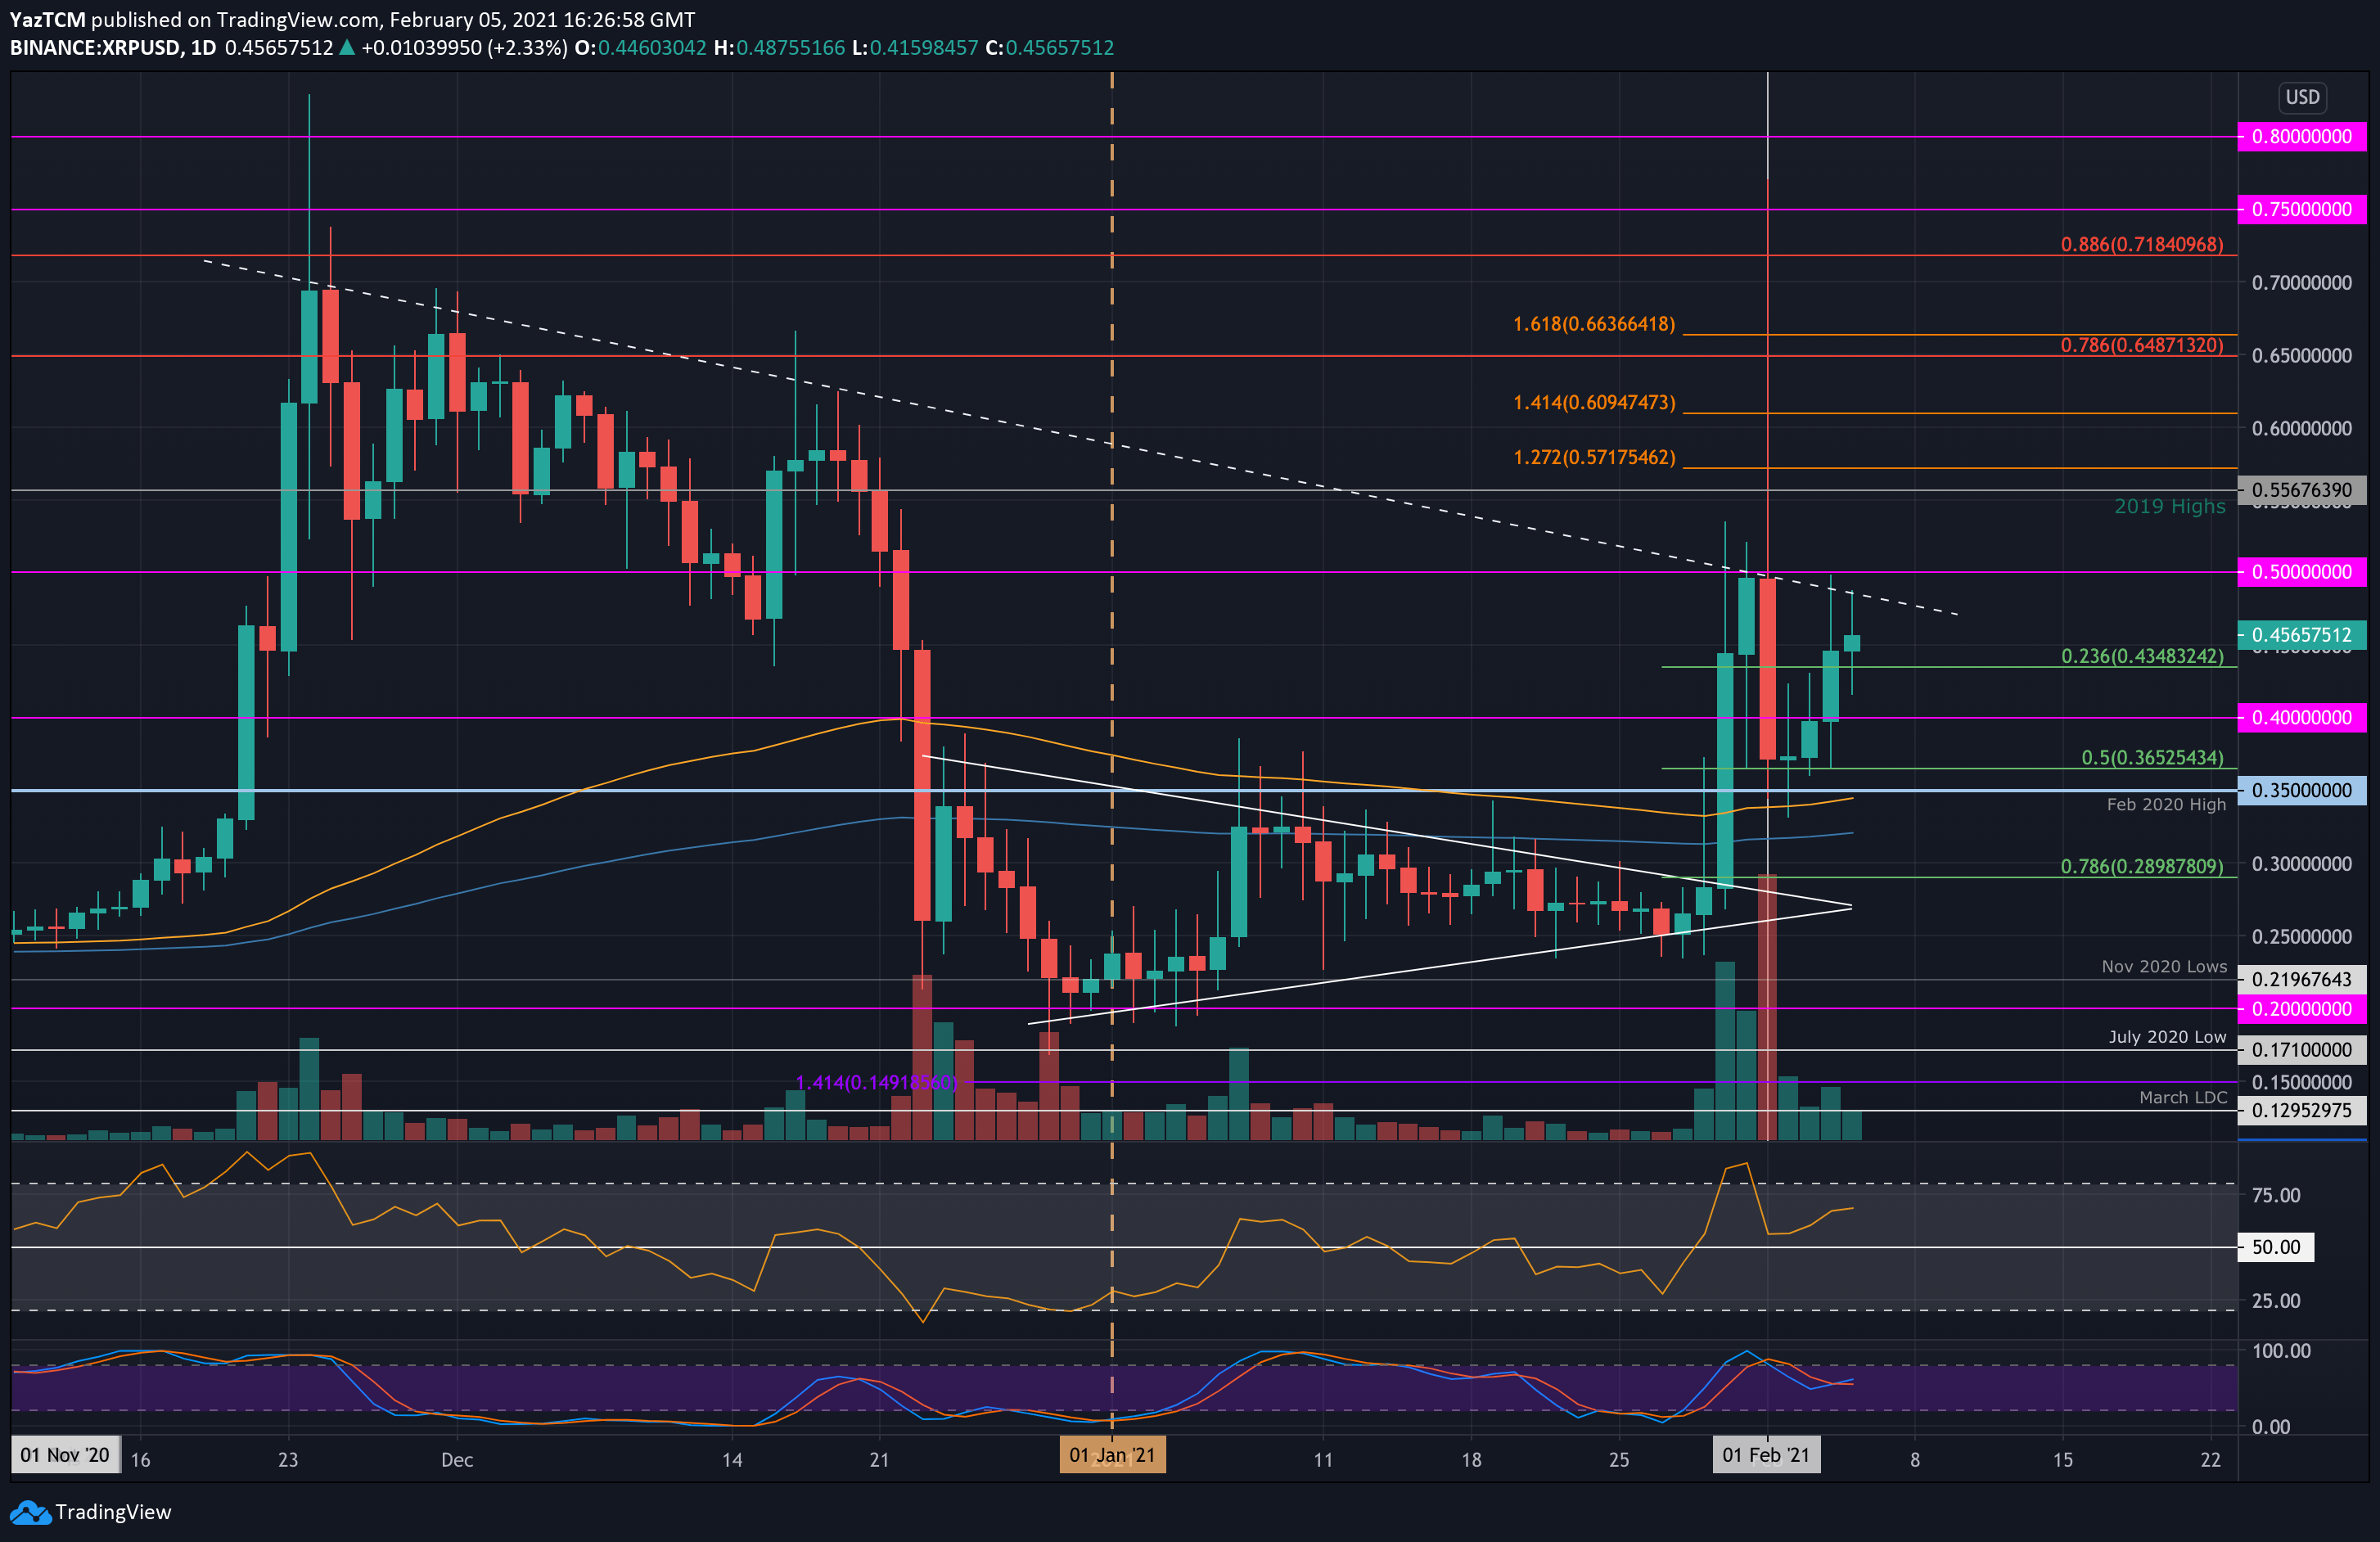
XRP is up by a powerful 70% this week as it currently trades around $0.45. The cryptocurrency had an interesting week as it broke beyond its consolidation triangle last Friday and started to push higher. By Sunday, it had already reached $0.5.
On Monday, XRP saw some whipsaw-like trading action in which it surged as high as $0.77 but then quickly dropped to as close the day at $0.365 (.5 Fib). It held this support through the week and eventually bounced higher from there yesterday.
It is now testing resistance at a descending trend line that dates back to early December 2020.
Looking ahead, if it can break the resistance at the descending trend line, the first level of higher resistance lies at $0.5. This is followed by $0.556 (2019 Highs), $0.517 (1.272 Fib Extension), $0.61 (1.414 Fib Extension), and $0.65 (bearish .786 Fib). Added resistance lies at $0.7, $0.718, $0.75, and $0.77.
On the other side, the first support lies at $0.434 (.236 Fib). This is followed by $0.4, $0.365 (.5 Fib), $0.35 (Feb 2020 High & 100-days EMA), and $0.3.
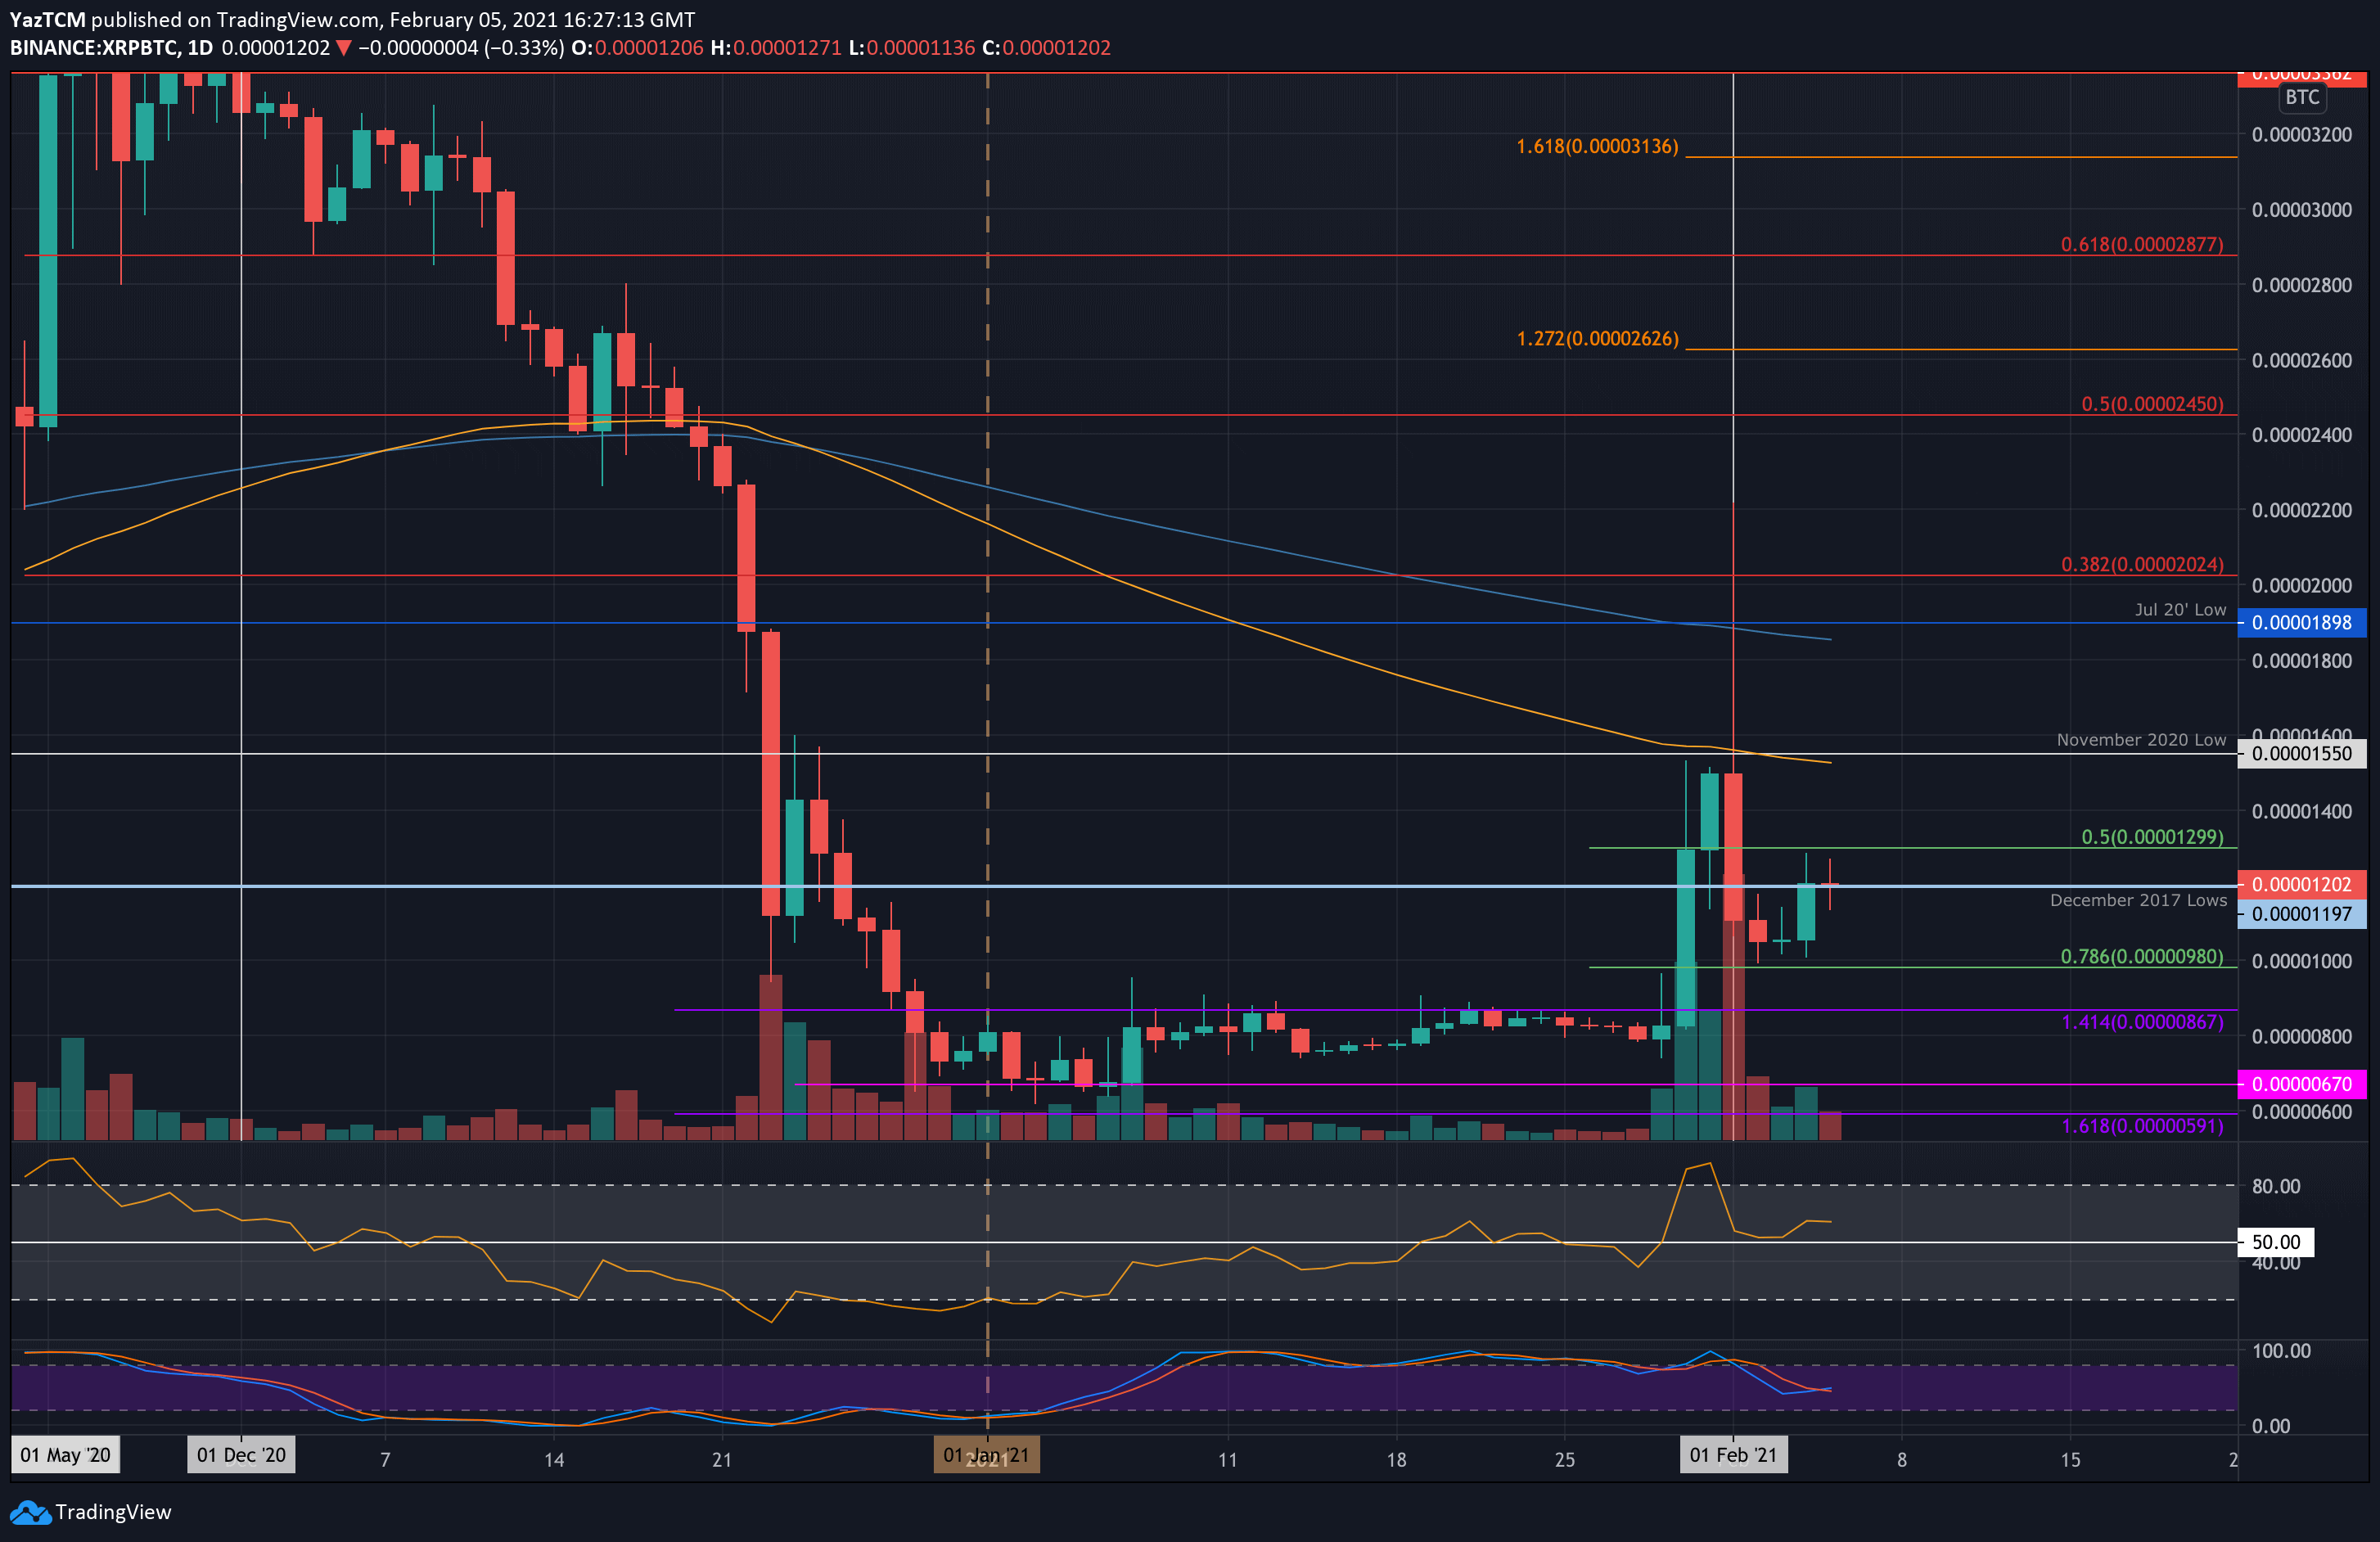
Against Bitcoin, XRP is also performing well as it trades around 1200 SAT. Last Friday, the coin broke its previous range when it penetrated above 67 SAT to reach 1540 SAT by Sunday. On Monday, it spiked as high as 2200 SAT before dropping lower into the 980 SAT (.786 Fib) support on Tuesday.
It has since rebounded from there as it tests the December 2017 lows at 1200 SAT today.
Moving forward, if the bulls break 1200 SAT, the first resistance lies at 1550 SAT (Nov 2020 lows & 100-days EMA0. This is followed by 1900 SAT (July 20 lows & 200-days EMA), 2025 SAT (bearish .382 Fib), and 2200 SAT.
On the other side, the first support lies at 1000 SAT. This is closely followed by 980 SAT (.786 Fib), 867 SAT (upper boundary of previous range), 700 SAT, and 670 SAT.
Cardano
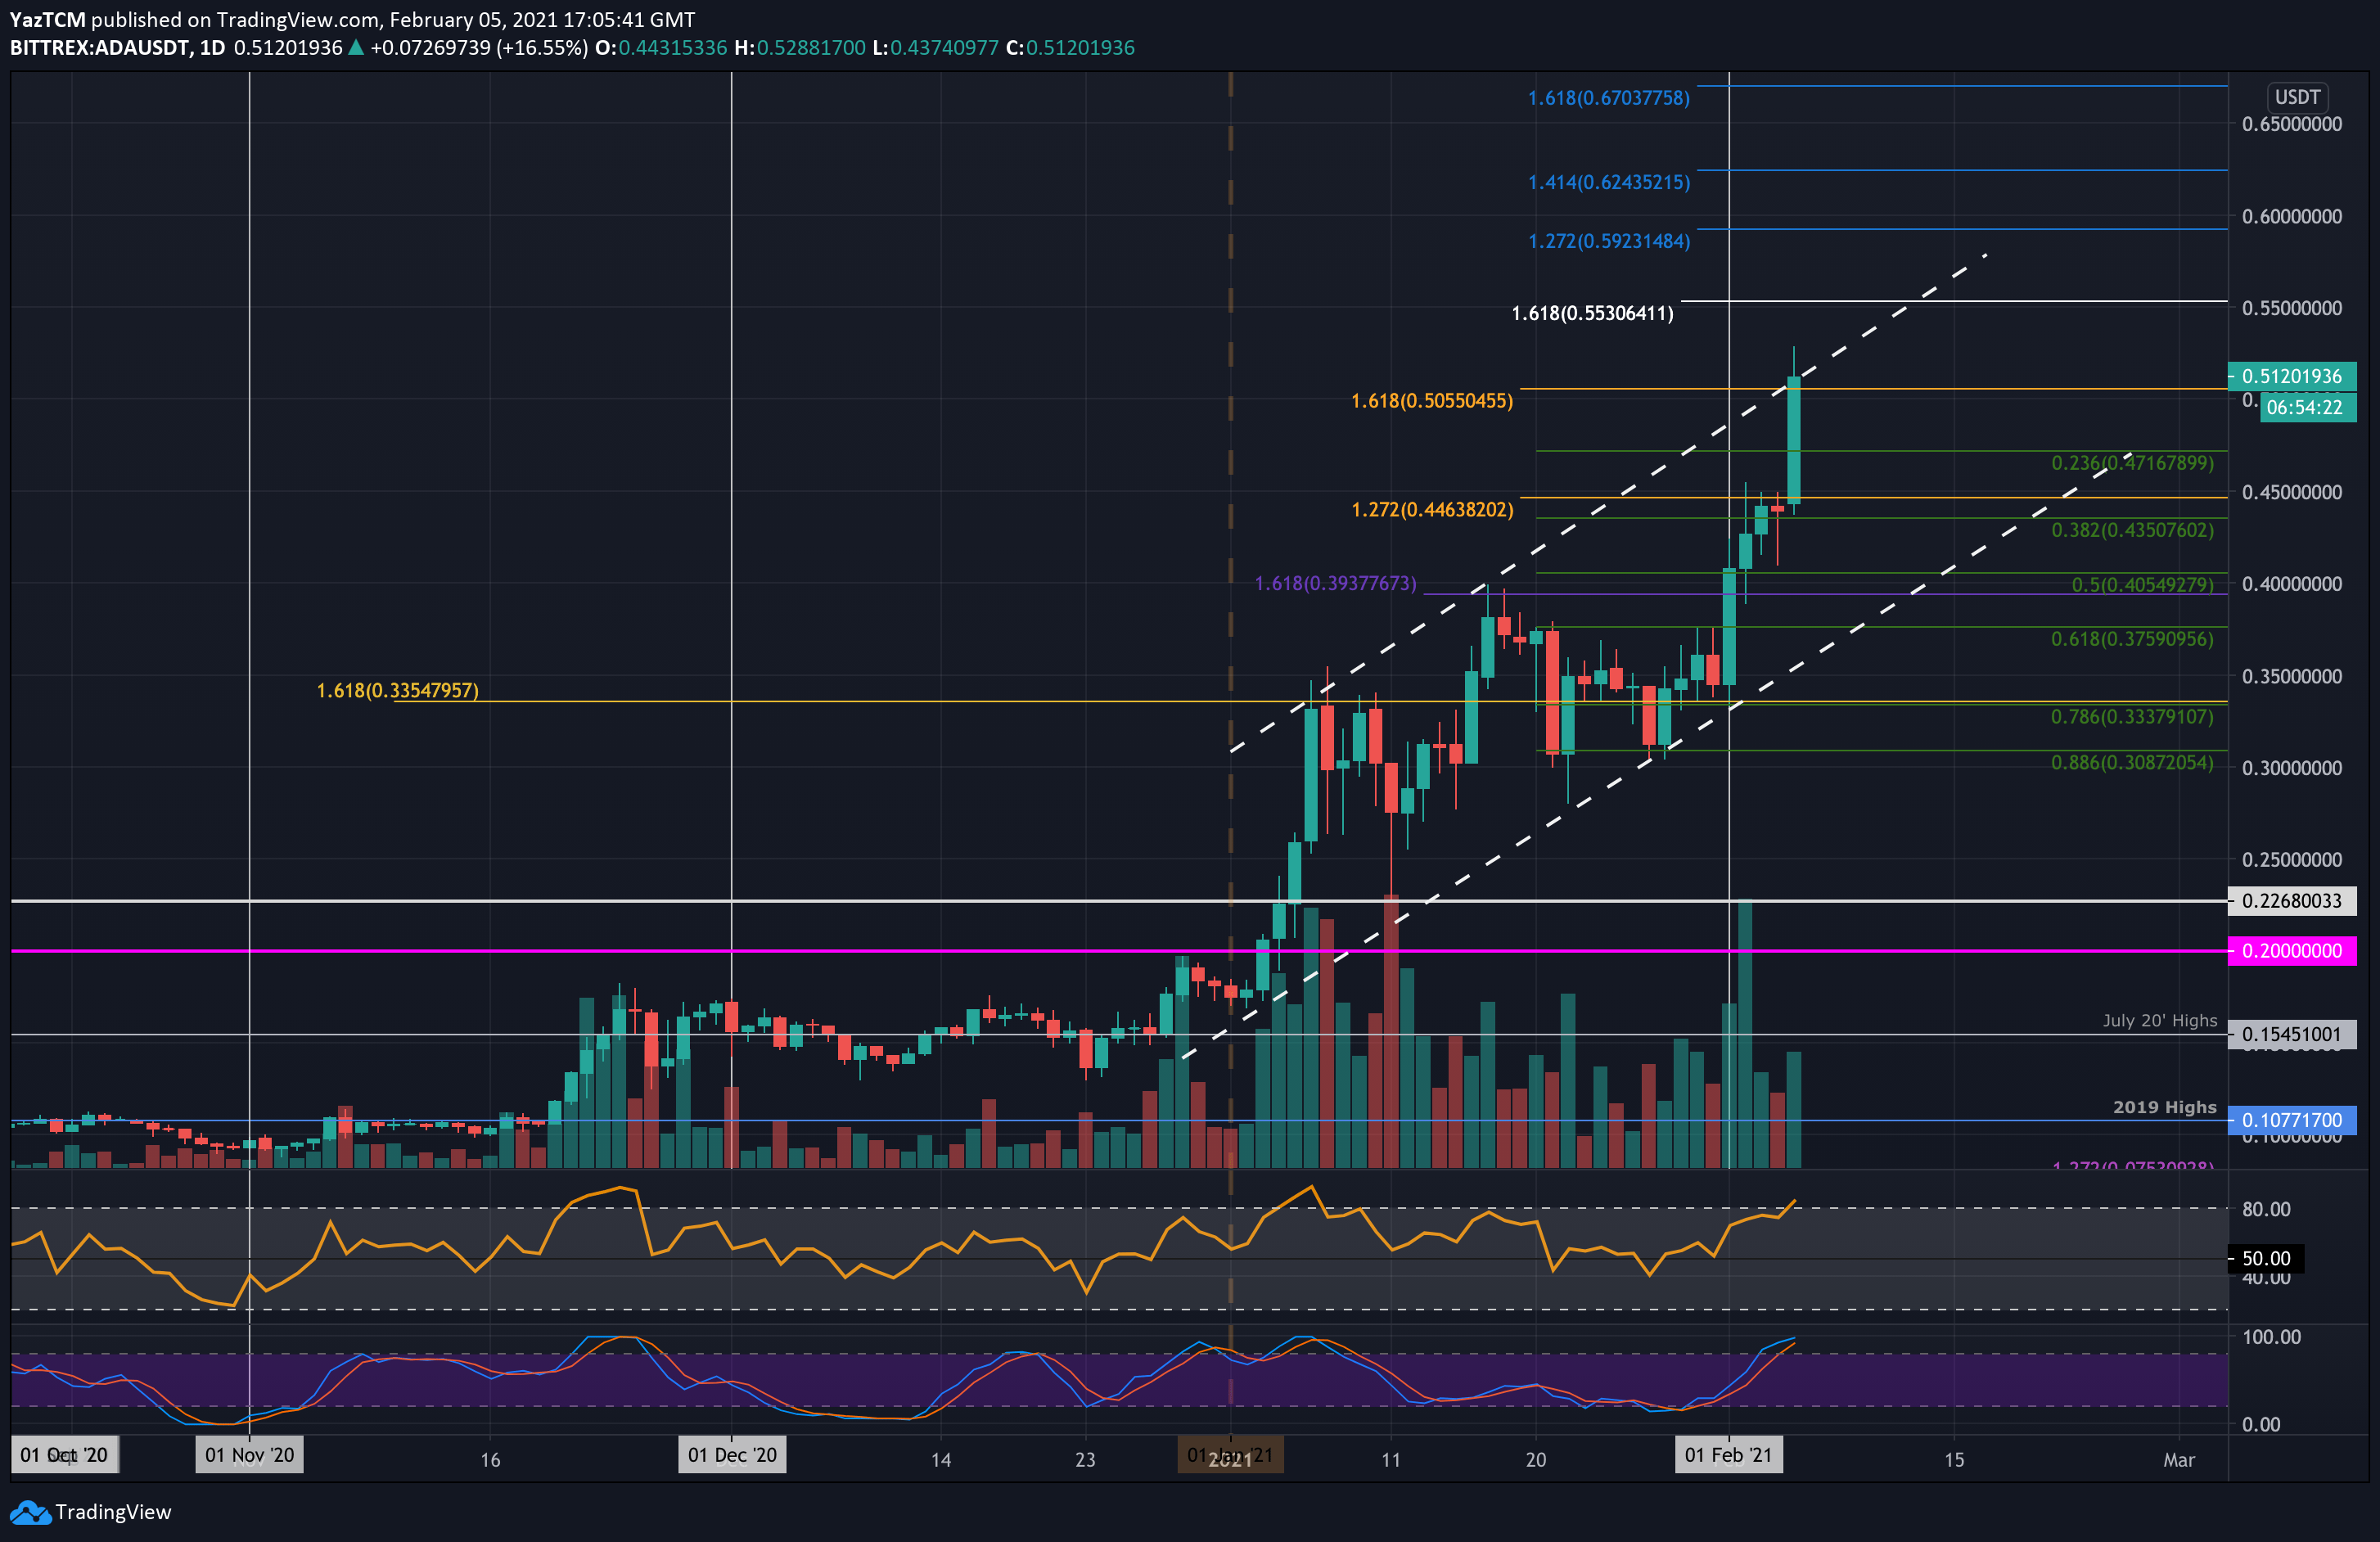
ADA managed to climb by a total of 47% over the past week as it climbs above $0.5 to reach $0.512. The coin started the week by bouncing from support at $0.333 as it started to push higher. On Monday, it managed to take out January’s resistance at $0.393.
It continued higher from there until meeting resistance at $0.446 (1.272 Fib Extension) yesterday. Today, Cardano surged by another 20.5%, allowing it to climb above $0.5 and reach the current $0.512 level.
We can see that ADA is trading within an ascending price channel. If ADA can close above this channel, it is likely to turn parabolic and shoot higher.
Looking ahead, if the bulls break the upper boundary of the channel, the first resistance lies at $0.553 (1.618 Fib Extension). This is followed by $0.592 (1.272 Fib Extension), $0.6, and $0.643 (1.414 Fib Extension). Additional resistance lies at $0.65 and $0.67 (1.618 Fib Extnesion – blue).
On the other side, the first support lies at $0.5. This is followed by $0.471 (.236 Fib), $0.45, and $0.435 (.382 Fib). Added support lies at $0.405 (.5 Fib & lower boundary of the channel) and $0.375 (.618 Fib).
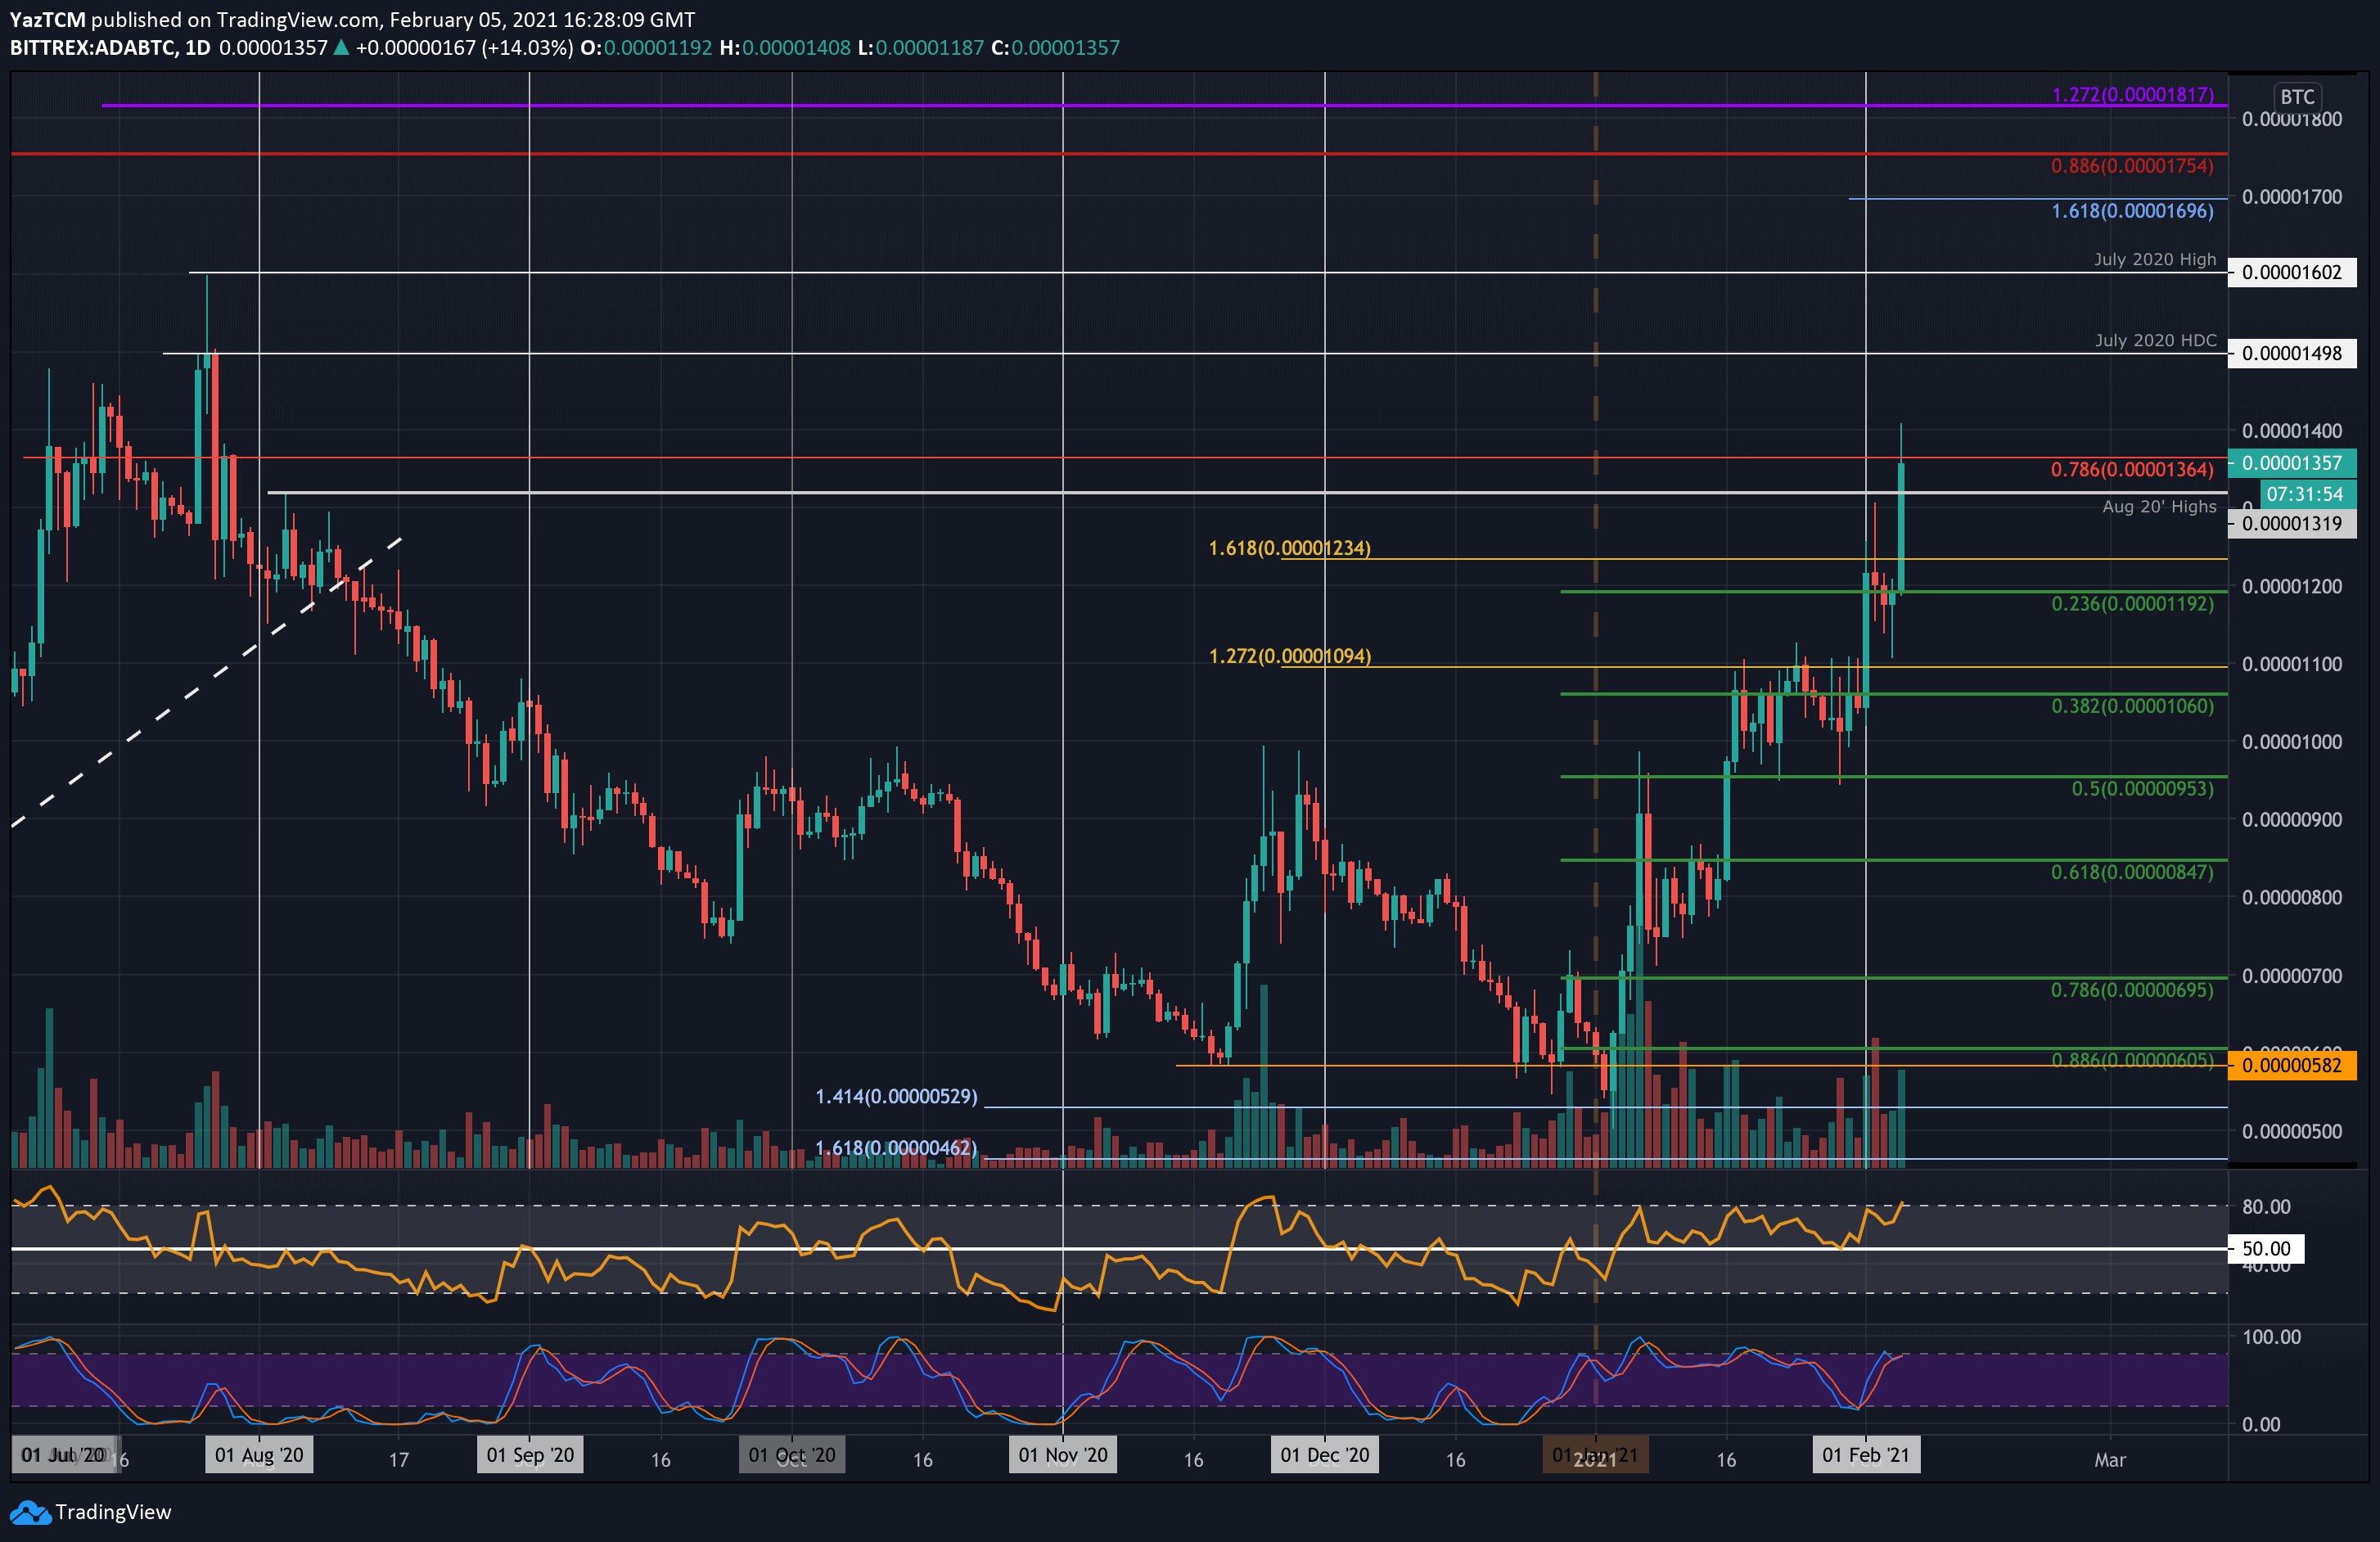
Against Bitcoin, ADA has managed to push into 7-month highs as it reached the current 1365 SAT resistance (bearish .786 Fib). It started the week by bouncing higher from the 1000 SAT level and breaking the January resistance at 1100 SAT on Monday.
It continued higher over the week until surging today to break the April 2020 highs and reach as high as 1400 SAT today. It has since dropped to 1365 SAT.
Looking ahead, if the bulls can break 1365 SAT, higher resistance lies at 1400 SAT. This is followed by 1500 SAT (July 2020 High-Day closing price), 1600 SAT (July 2020 Highs), and 1700 SAT (1.618 Fib Extension). Added resistance lies at 1755 SAT and 1800 SAT.
On the other side, the first support lies at 1320 SAT (April 2020 Highs). This is followed by 1200 SAT (.236 Fib), 1100 SAT, 1000 SAT (.382 Fib), and 950 SAT (.5 Fib).
Chainlink
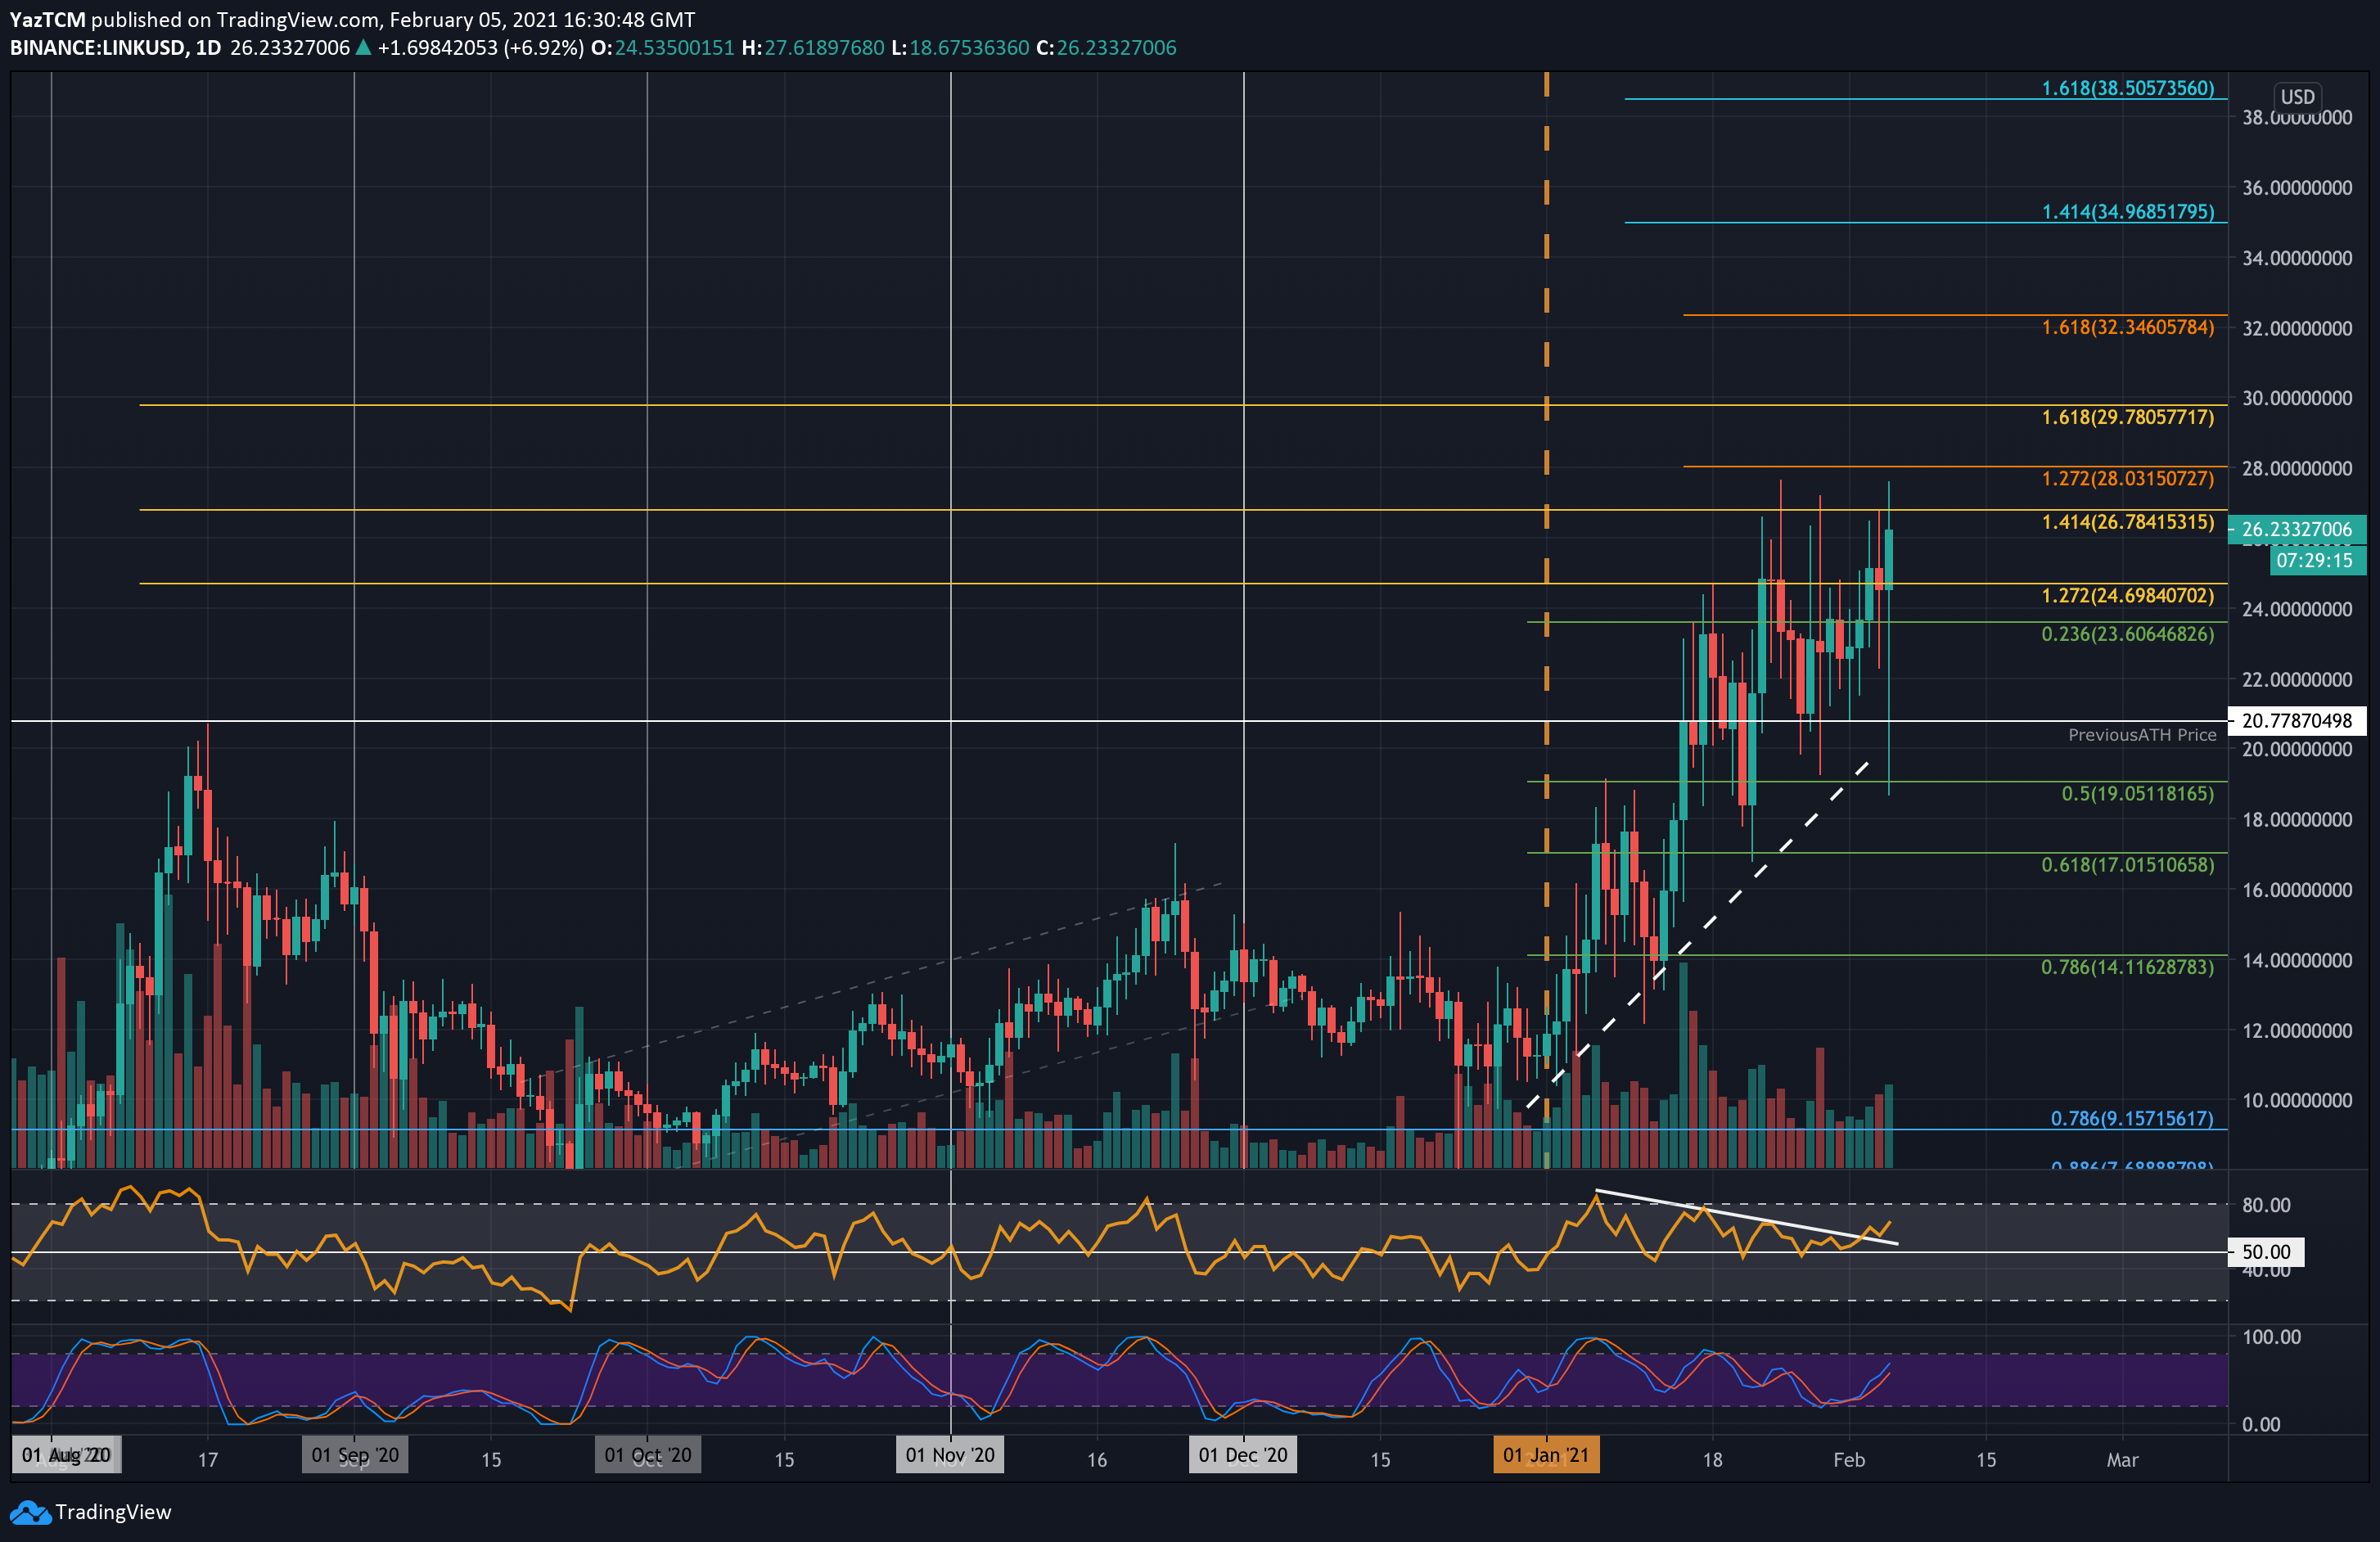
Chainlink saw a smaller 12% price hike this week as it currently trades around $26.23. The outlook for LINK is quite promising because it broke the resistance at $24.70 and, if it closes above here, it should end up surging higher again.
Looking ahead, the first resistance lies at $26.78. This is followed by $28 (short term 1.272 Fib Extension), $29.78 (1.618 Fib Extension), and $32.35 (short term 1.618 Fib Extension). Added resistance lies at $34, $35, and $36.
On the other side, the first support lies at $23.60. This is followed by $22, $20.77, and $20. Additional support is found at $19.05 (.5 Fib) and $18.
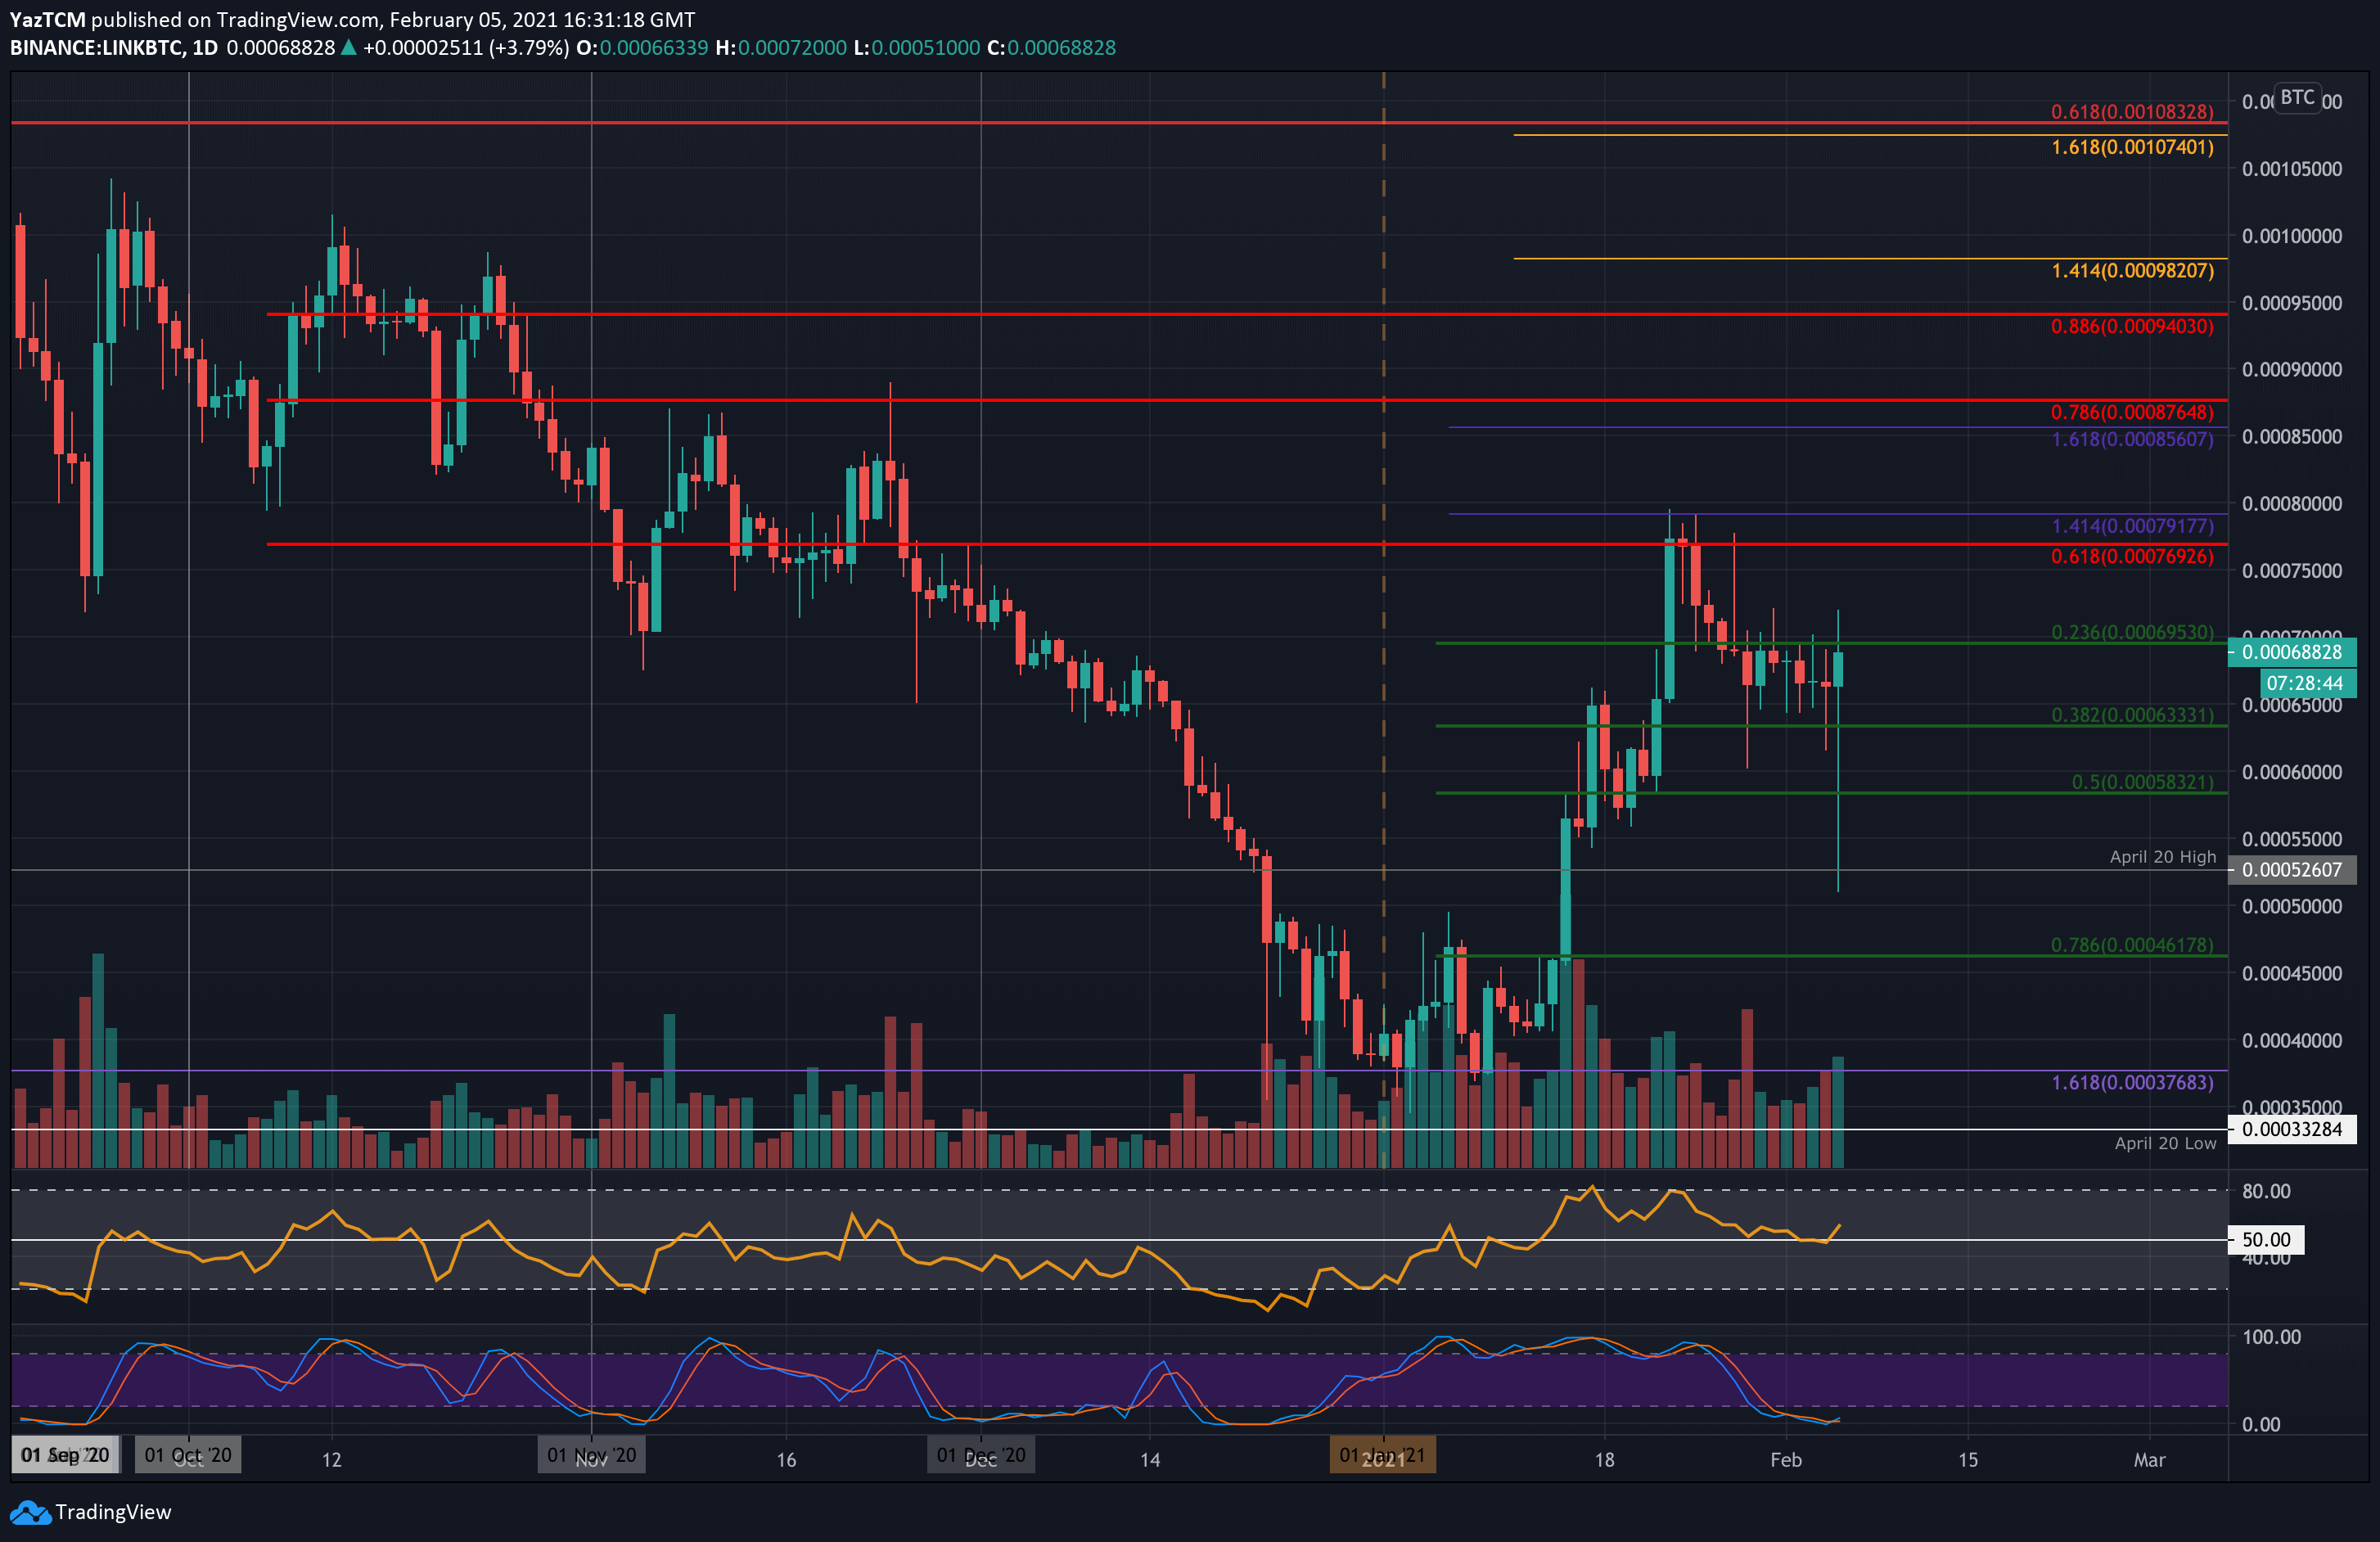
Against Bitcoin, LINK is trading in the same place it was last week at 0.000688 BTC. The coin had spiked much lower today, reaching 0.00051 BTC but quickly recovered to the weekly average.
Looking ahead, the resistance at 0.0007 BTC is the first level for LINK to take out. Above this, resistance lies at 0.00076 BTC, 0.000791 BTC (1.414 Fib Extension), 0.0008 BTC, and 0.000856 BTC.
On the other side, support first lies at 0.00065 BTC. This is followed by 0.000633 BTC (.382 Fib), 0.0006 BTC, and 0.000582 BTC (.5 Fib). Added support is found at 0.000526 BTC (April 2020 Highs) and 0.0005 BTC.