This week has been particularly volatile. Bitcoin went on a massive correction, jumped back to K, and dropped again just a few hours ago. The majority of the altcoins followed. Polkadot (DOT), however, went on an impressive rally as can be seen in the below ROI chart for the coins we’ve selected this week.BitcoinBitcoin is down by a concerning 13.8% over the past week as it currently trades beneath ,000. The downturn for Bitcoin started on Monday when it dropped by a steep 25% to reach as low as ,100. It quickly rebounded from there to establish support at ,500 (.382 Fib Retracement).On Wednesday, Bitcoin rebounded from the ,500 support and started to push higher. It managed to reach as high as ,000 yesterday but could not close a daily candle above the resistance at a
Topics:
Yaz Sheikh considers the following as important: ADABTC, ADAUSD, Bitcoin (BTC) Price, BTC Analysis, BTCEUR, BTCGBP, btcusd, btcusdt, Cardano (ADA) Price, DOTBTC, DOTUSD, DOTUSDT, ETH Analysis, ETHBTC, Ethereum (ETH) Price, ethusd, Market Updates, Polkadot (DOT) Price, Price Analysis, Ripple (XRP) Price, XRP Analysis, xrpbtc, xrpusd
This could be interesting, too:
Mandy Williams writes Bitcoin ETFs Record Over .6B in Outflows in the Past 2 Weeks
Dimitar Dzhondzhorov writes Millions of ADA Sold by Cardano Whales During Market Crash – Will the Decline Continue?
Chayanika Deka writes Bitcoin Whales Offload 6,813 BTC as Selling Pressure Mounts
Wayne Jones writes Bitcoin Sentiment Hits 2022 Lows as Fear & Greed Index Falls to 10
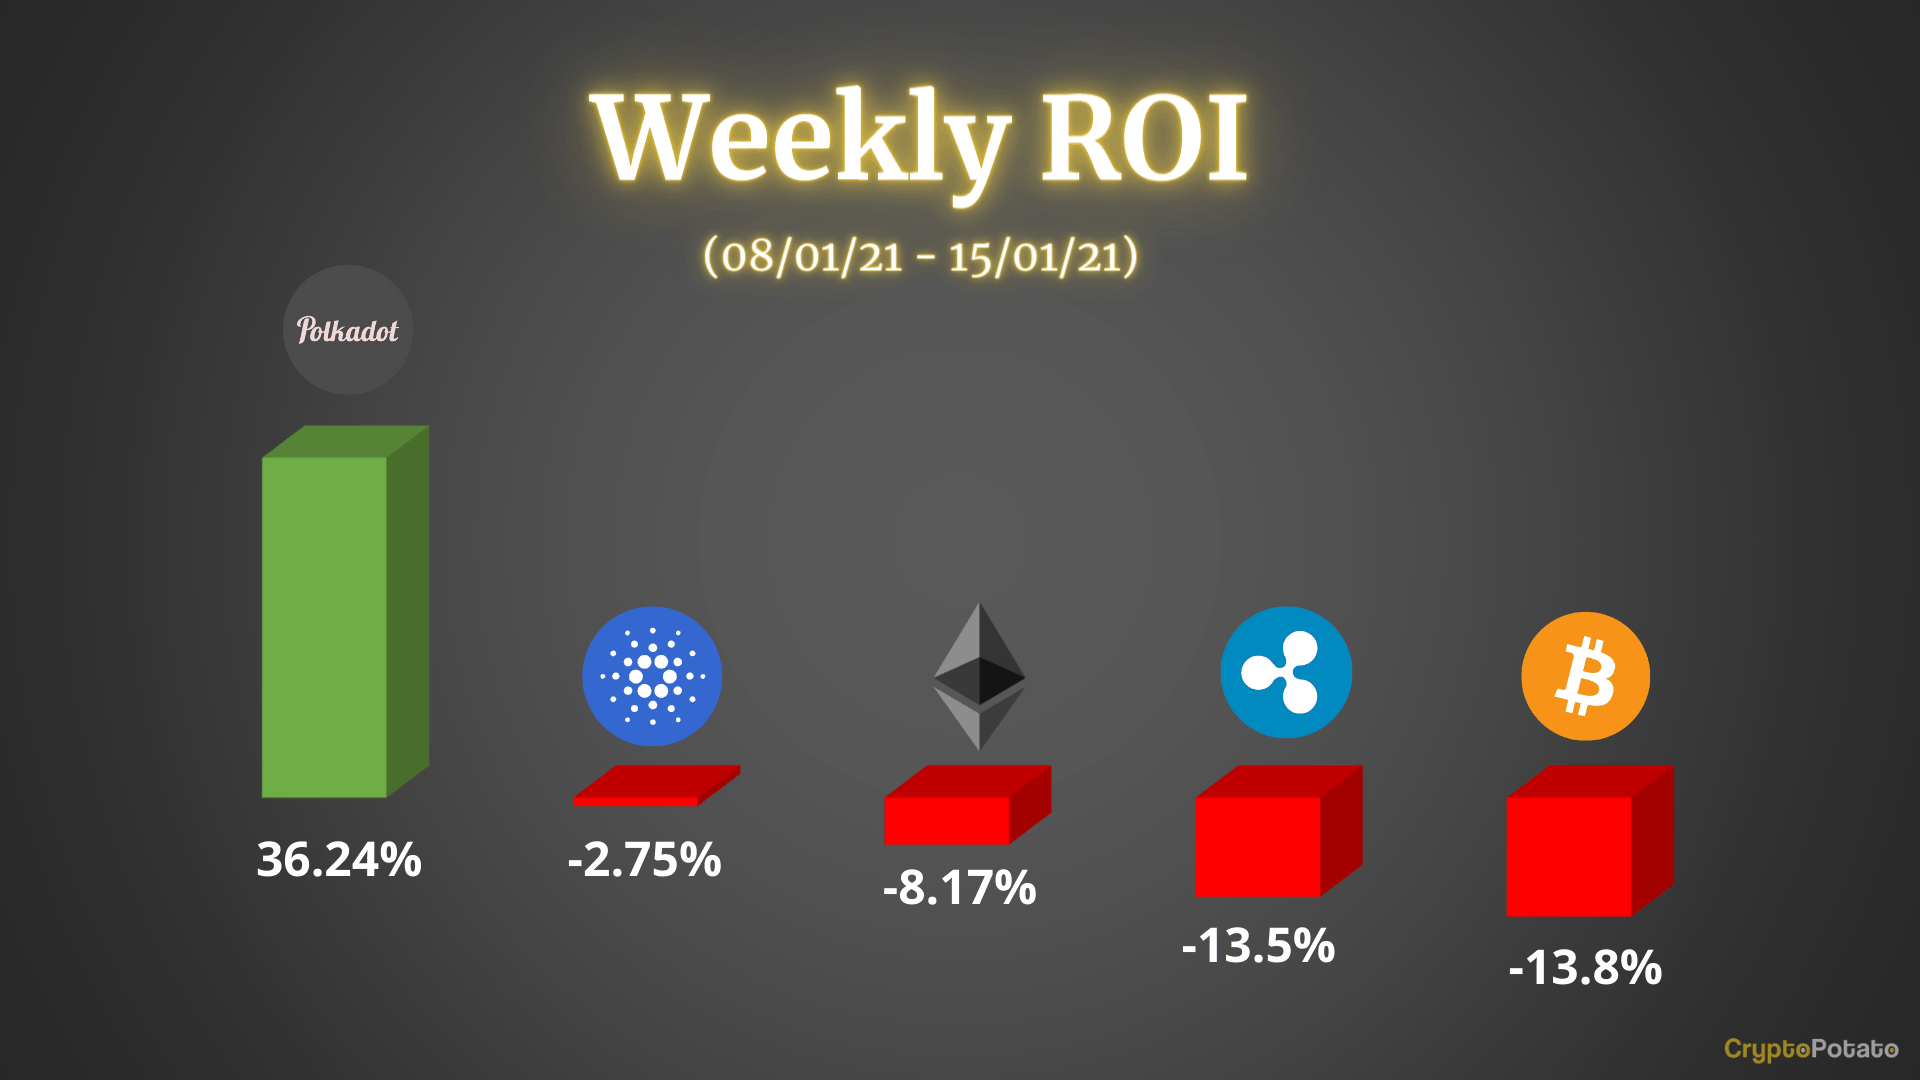
This week has been particularly volatile. Bitcoin went on a massive correction, jumped back to $40K, and dropped again just a few hours ago. The majority of the altcoins followed. Polkadot (DOT), however, went on an impressive rally as can be seen in the below ROI chart for the coins we’ve selected this week.
Bitcoin
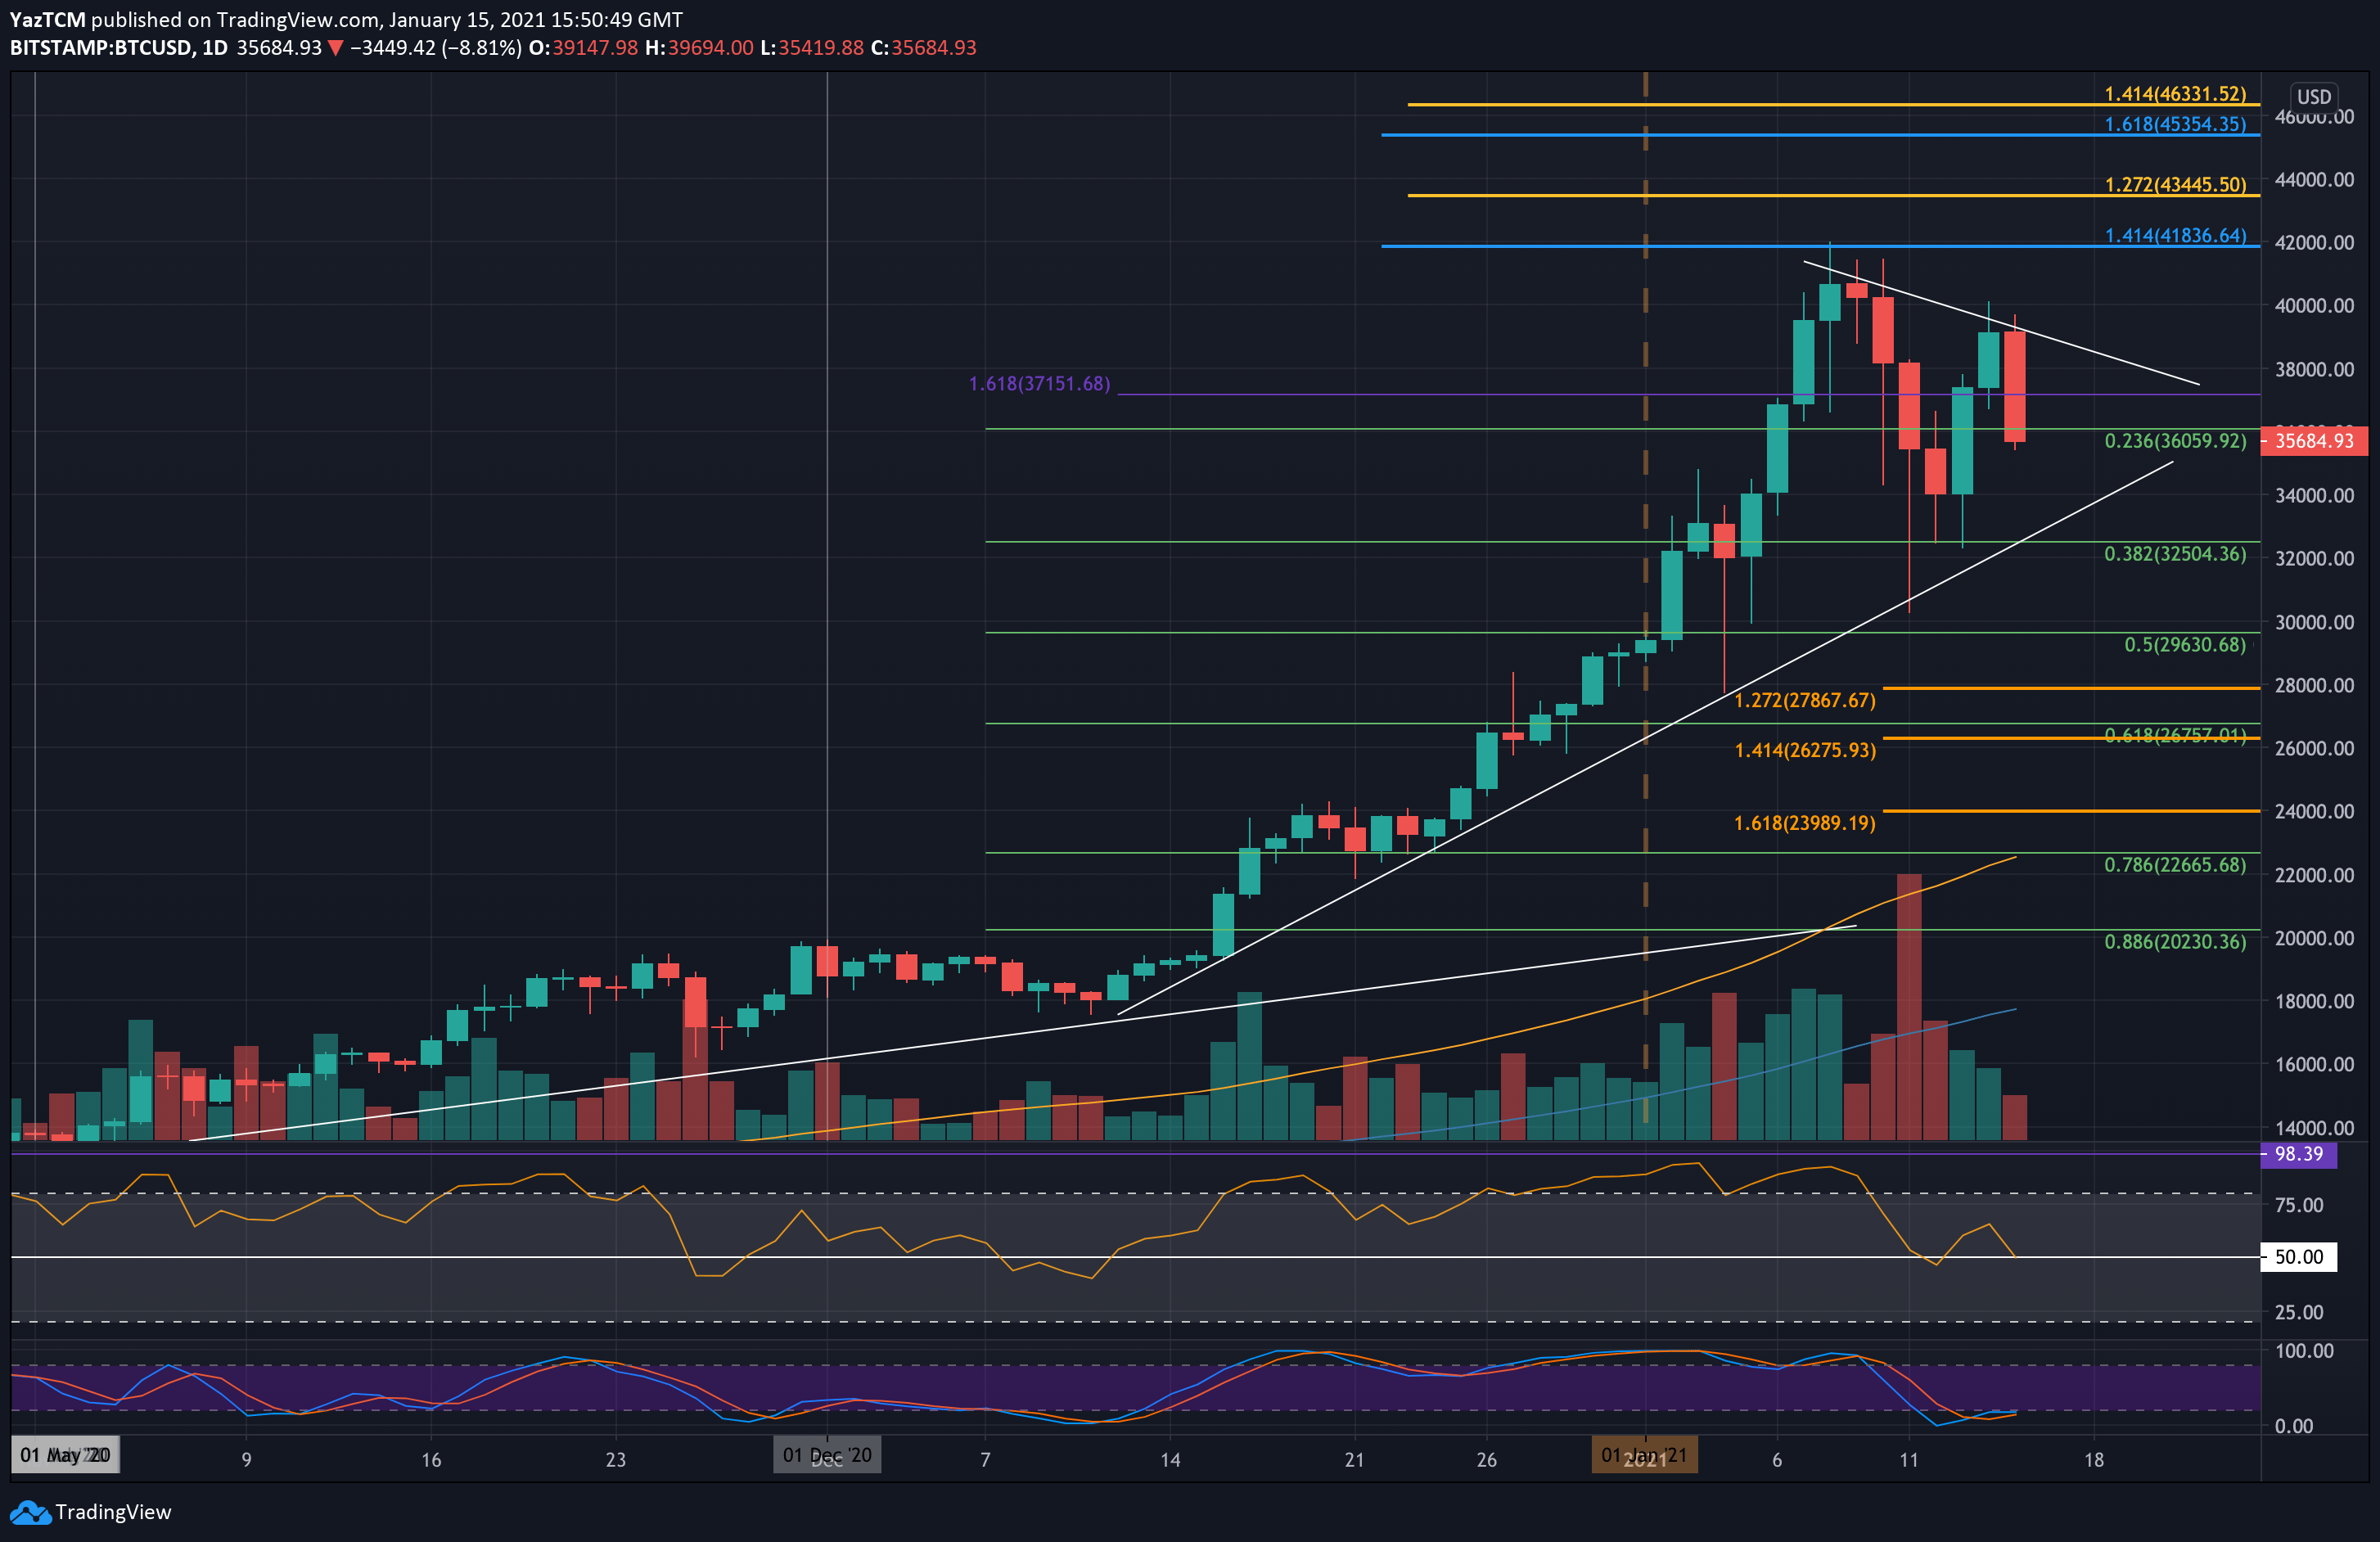
Bitcoin is down by a concerning 13.8% over the past week as it currently trades beneath $36,000. The downturn for Bitcoin started on Monday when it dropped by a steep 25% to reach as low as $30,100. It quickly rebounded from there to establish support at $32,500 (.382 Fib Retracement).
On Wednesday, Bitcoin rebounded from the $32,500 support and started to push higher. It managed to reach as high as $40,000 yesterday but could not close a daily candle above the resistance at a short term falling trend line.
As a result, Bitcoin went on to drop by 10% today as it fell beneath the support at $36,000, provided by a .236 Fib Retracement,to hit $34.480 before recovering to about $35,600 (at the time of writing).
Looking ahead, the first level of support lies at $35,000. This is followed by $34,000, the rising trend line, $32,500 (.382 Fib Retracement), and $30,000. Added support is found at $29,630 (.5 Fib retracement).
On the other side, the first level of resistance lies at $37,150. This is followed by $38,000, the falling trend line, $40,000, and $42,000. Beyond the ATH, resistance is found at $43,446 (1.272 Fib Extension), and $44,000.
Ethereum
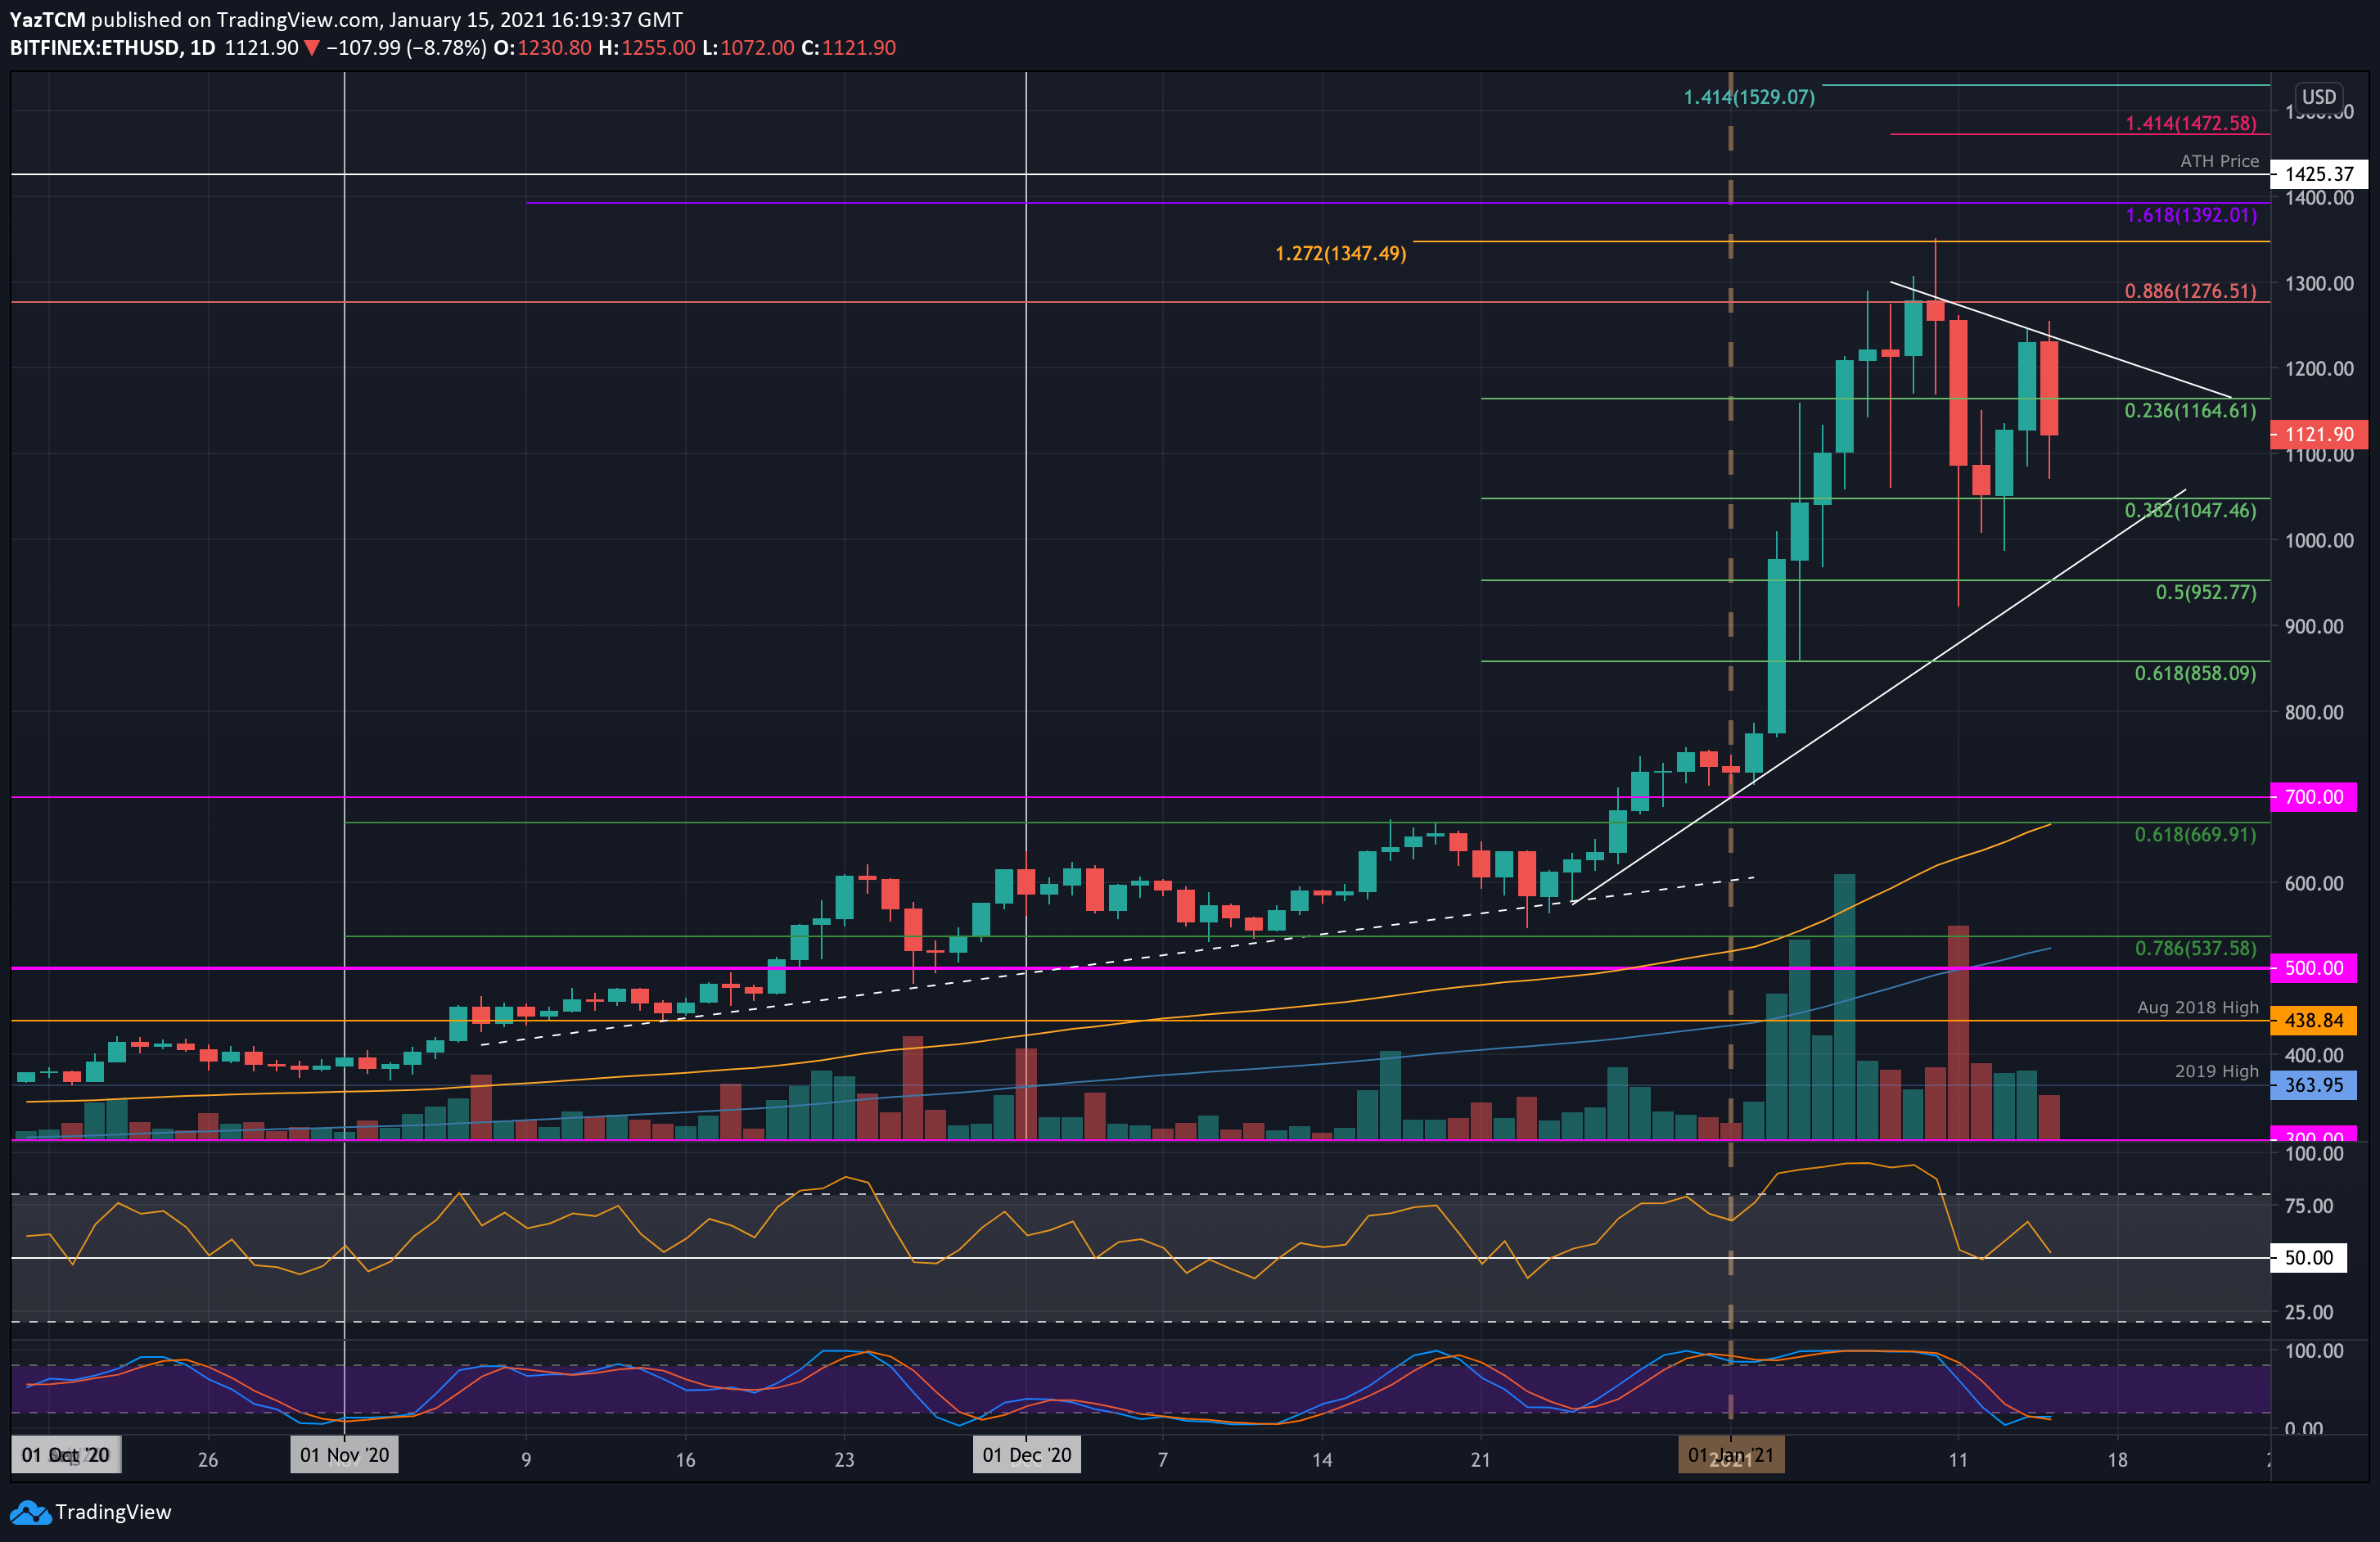
Ethereum is down by 8.2% over the past week as it currently trades around $1,130. It was trading at the resistance of around $1,276 (bearish .886 Fib) at the start of the week and began to head lower from there when Bitcoin dropped by 25% on Monday.
Luckily, the bulls managed to establish support at $1,047 (.382 Fib Retracement) and rebounded from there on Wednesday. Yesterday, they ran into resistance at a falling trend line and could not overcome this level. It has since dropped lower from this resistance.
Moving forward, if the sellers push lower, the first level of support lies at $1,100. This is followed by support at $1,050 (.382 Fib), $1,000, and $950 (.5 Fib Retracement).
On the other side, resistance first lies at the falling trend line. Above the trend line, resistance is located at $1,276 (bearish .886 Fib), $1,300, and $1,350 (1.272 Fib Extension). This is followed by $1,390, $1,4000, and $1,425 (ATH price).
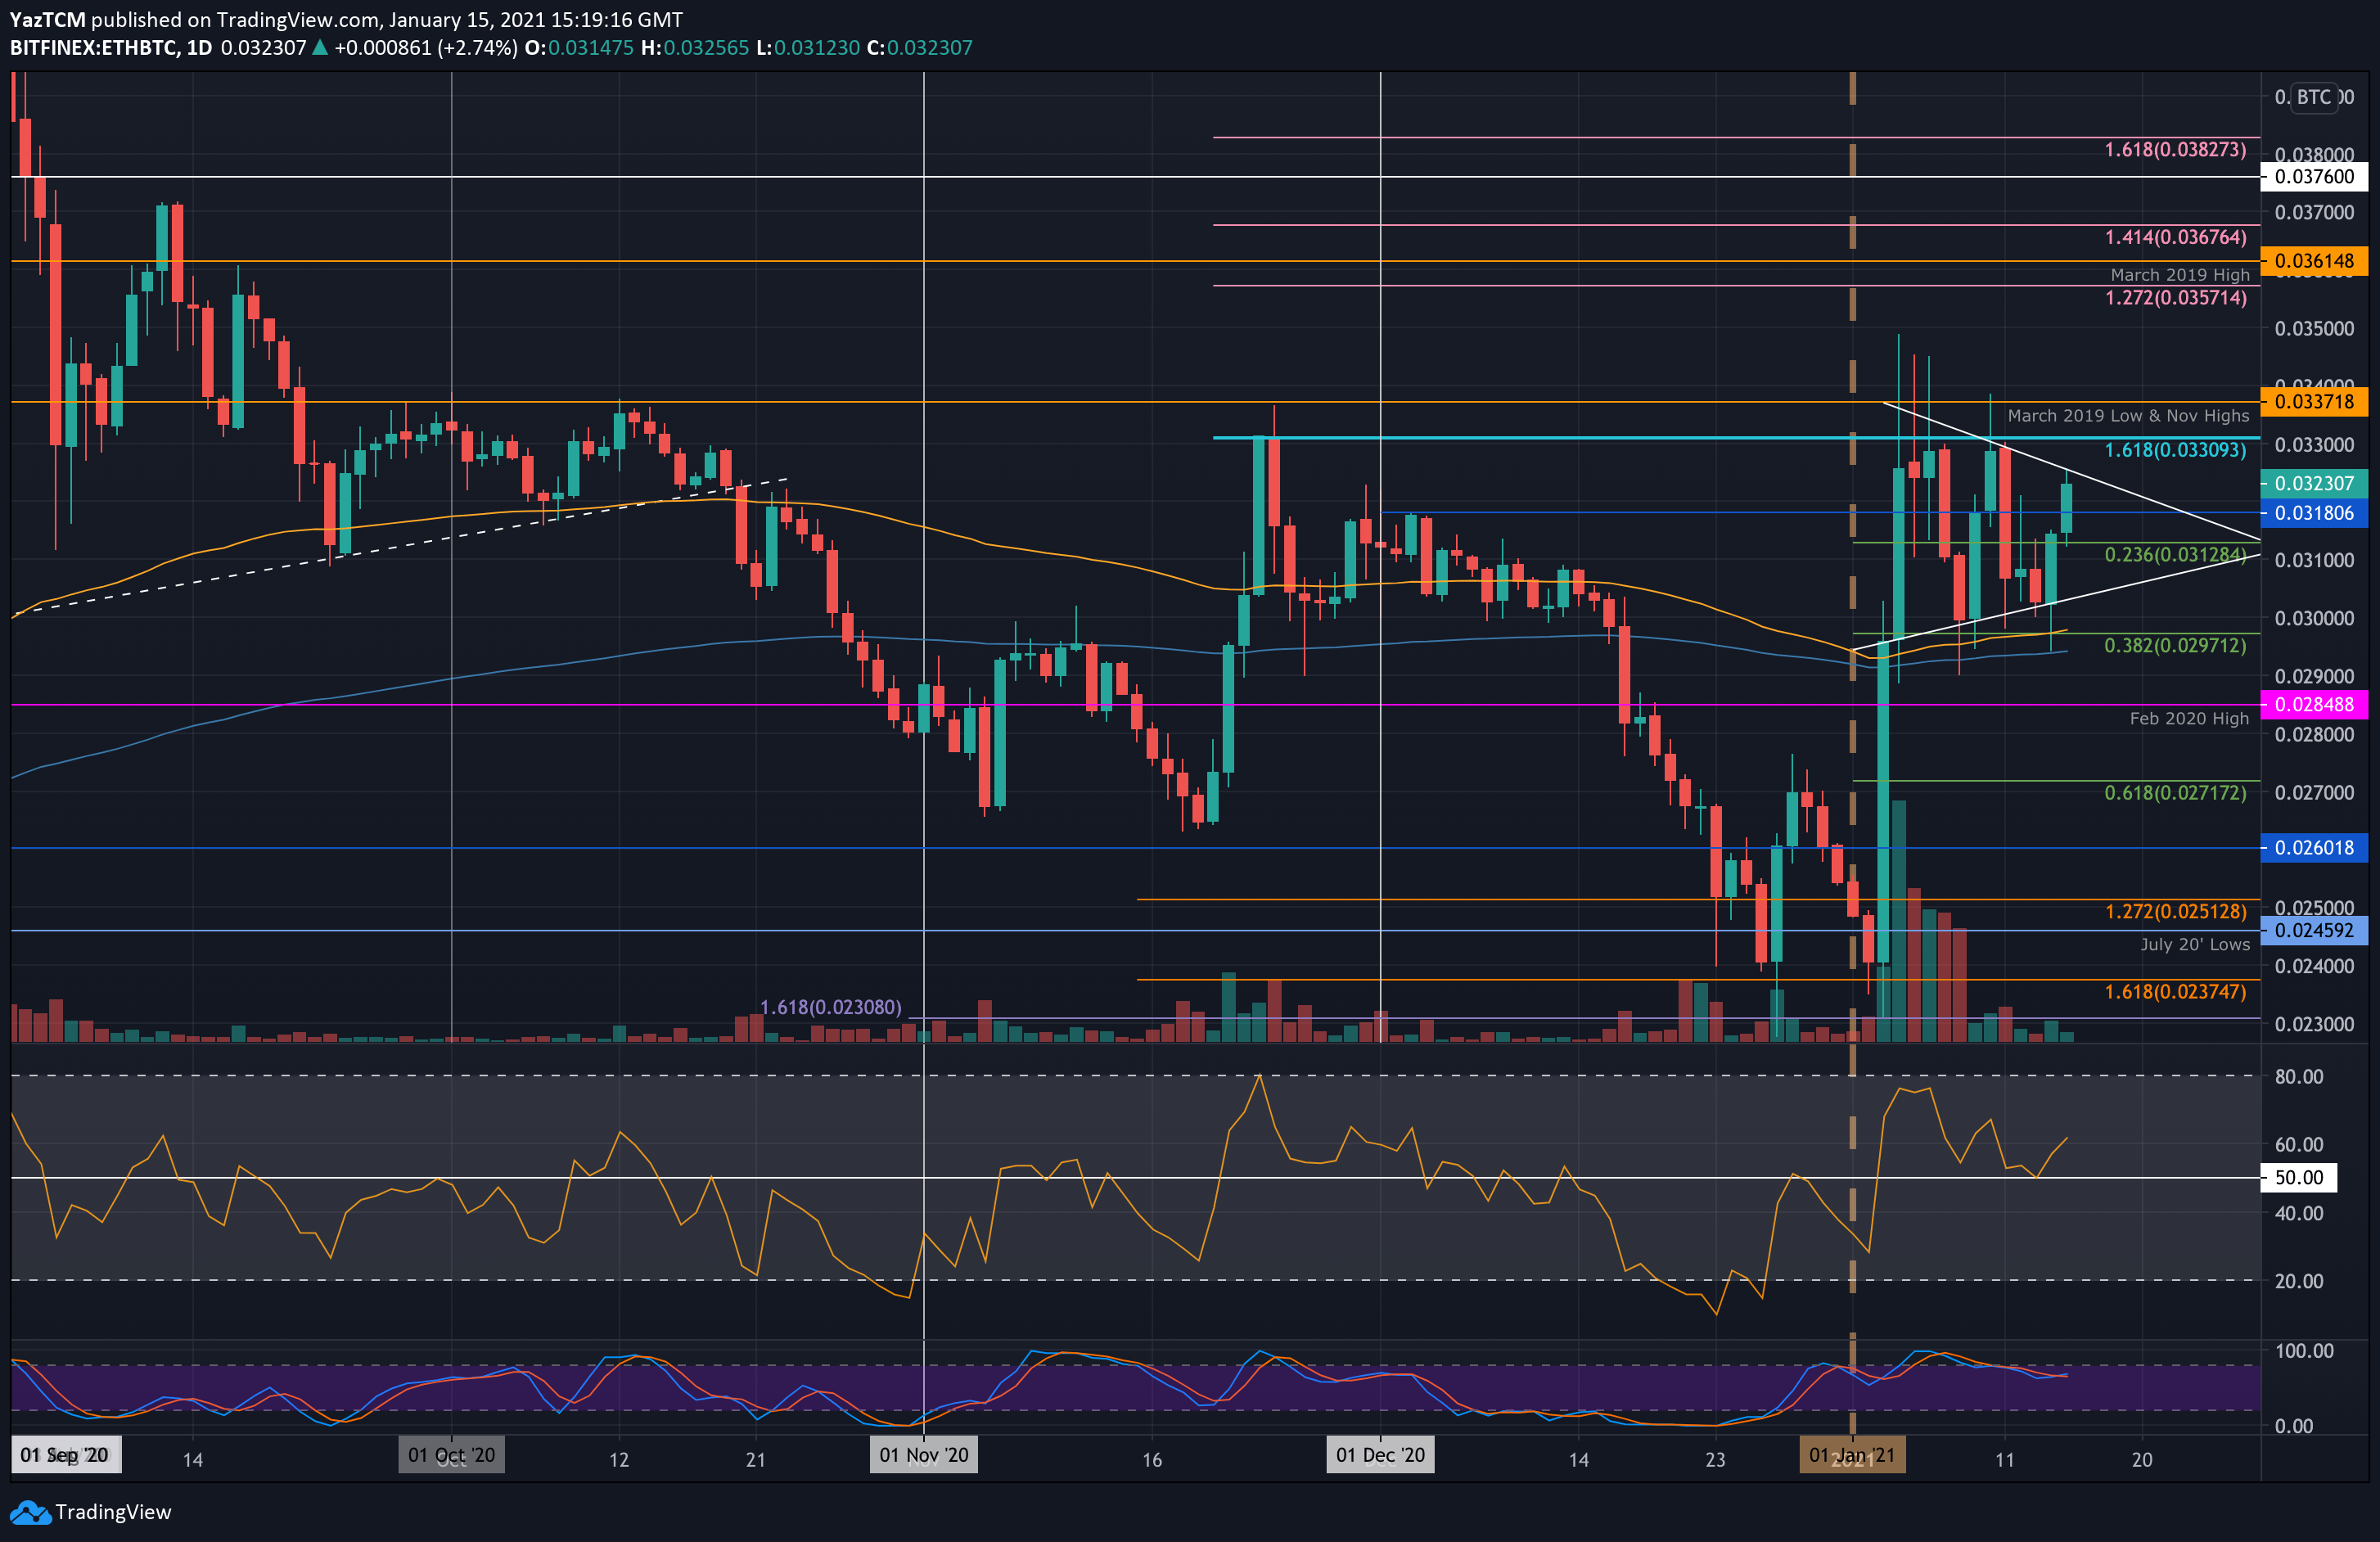
Against Bitcoin, ETH started the week by bouncing higher from 0.03 BTC but still was unable to overcome the January 2021 resistance around 0.03309 BTC. From there, ETH headed lower again but managed to find support at the lower boundary of a short term symmetrical triangle. After briefly spiking beneath the triangle, ETH bounced from the 200-days EMA support and started to push higher yesterday.
Today, it is trading around 0.0323 BTC as it attempts to penetrate the triangle’s upper boundary.
Looking ahead, if the buyers break the triangle, the first level of resistance lies at 0.03309 BTC. This is followed by resistance at 0.0337 BTC (November 2020 highs), 0.034 BTC, and 0.035 BTC. added support lies at 0.0357 BTC (1.272 Fib Extension), 0.0361 BTC (March 2019 High), and 0.0367 BTC.
On the other side, support is first located at 0.0318 BTC (December 2020 highs). This is followed by 0.0312 BTC (.236 Fib), the lower boundary of the triangle, and 0.03 BTC. Additional support is found at 0.0297 BTC (.382 Fib) and 0.029 BTC.
Ripple
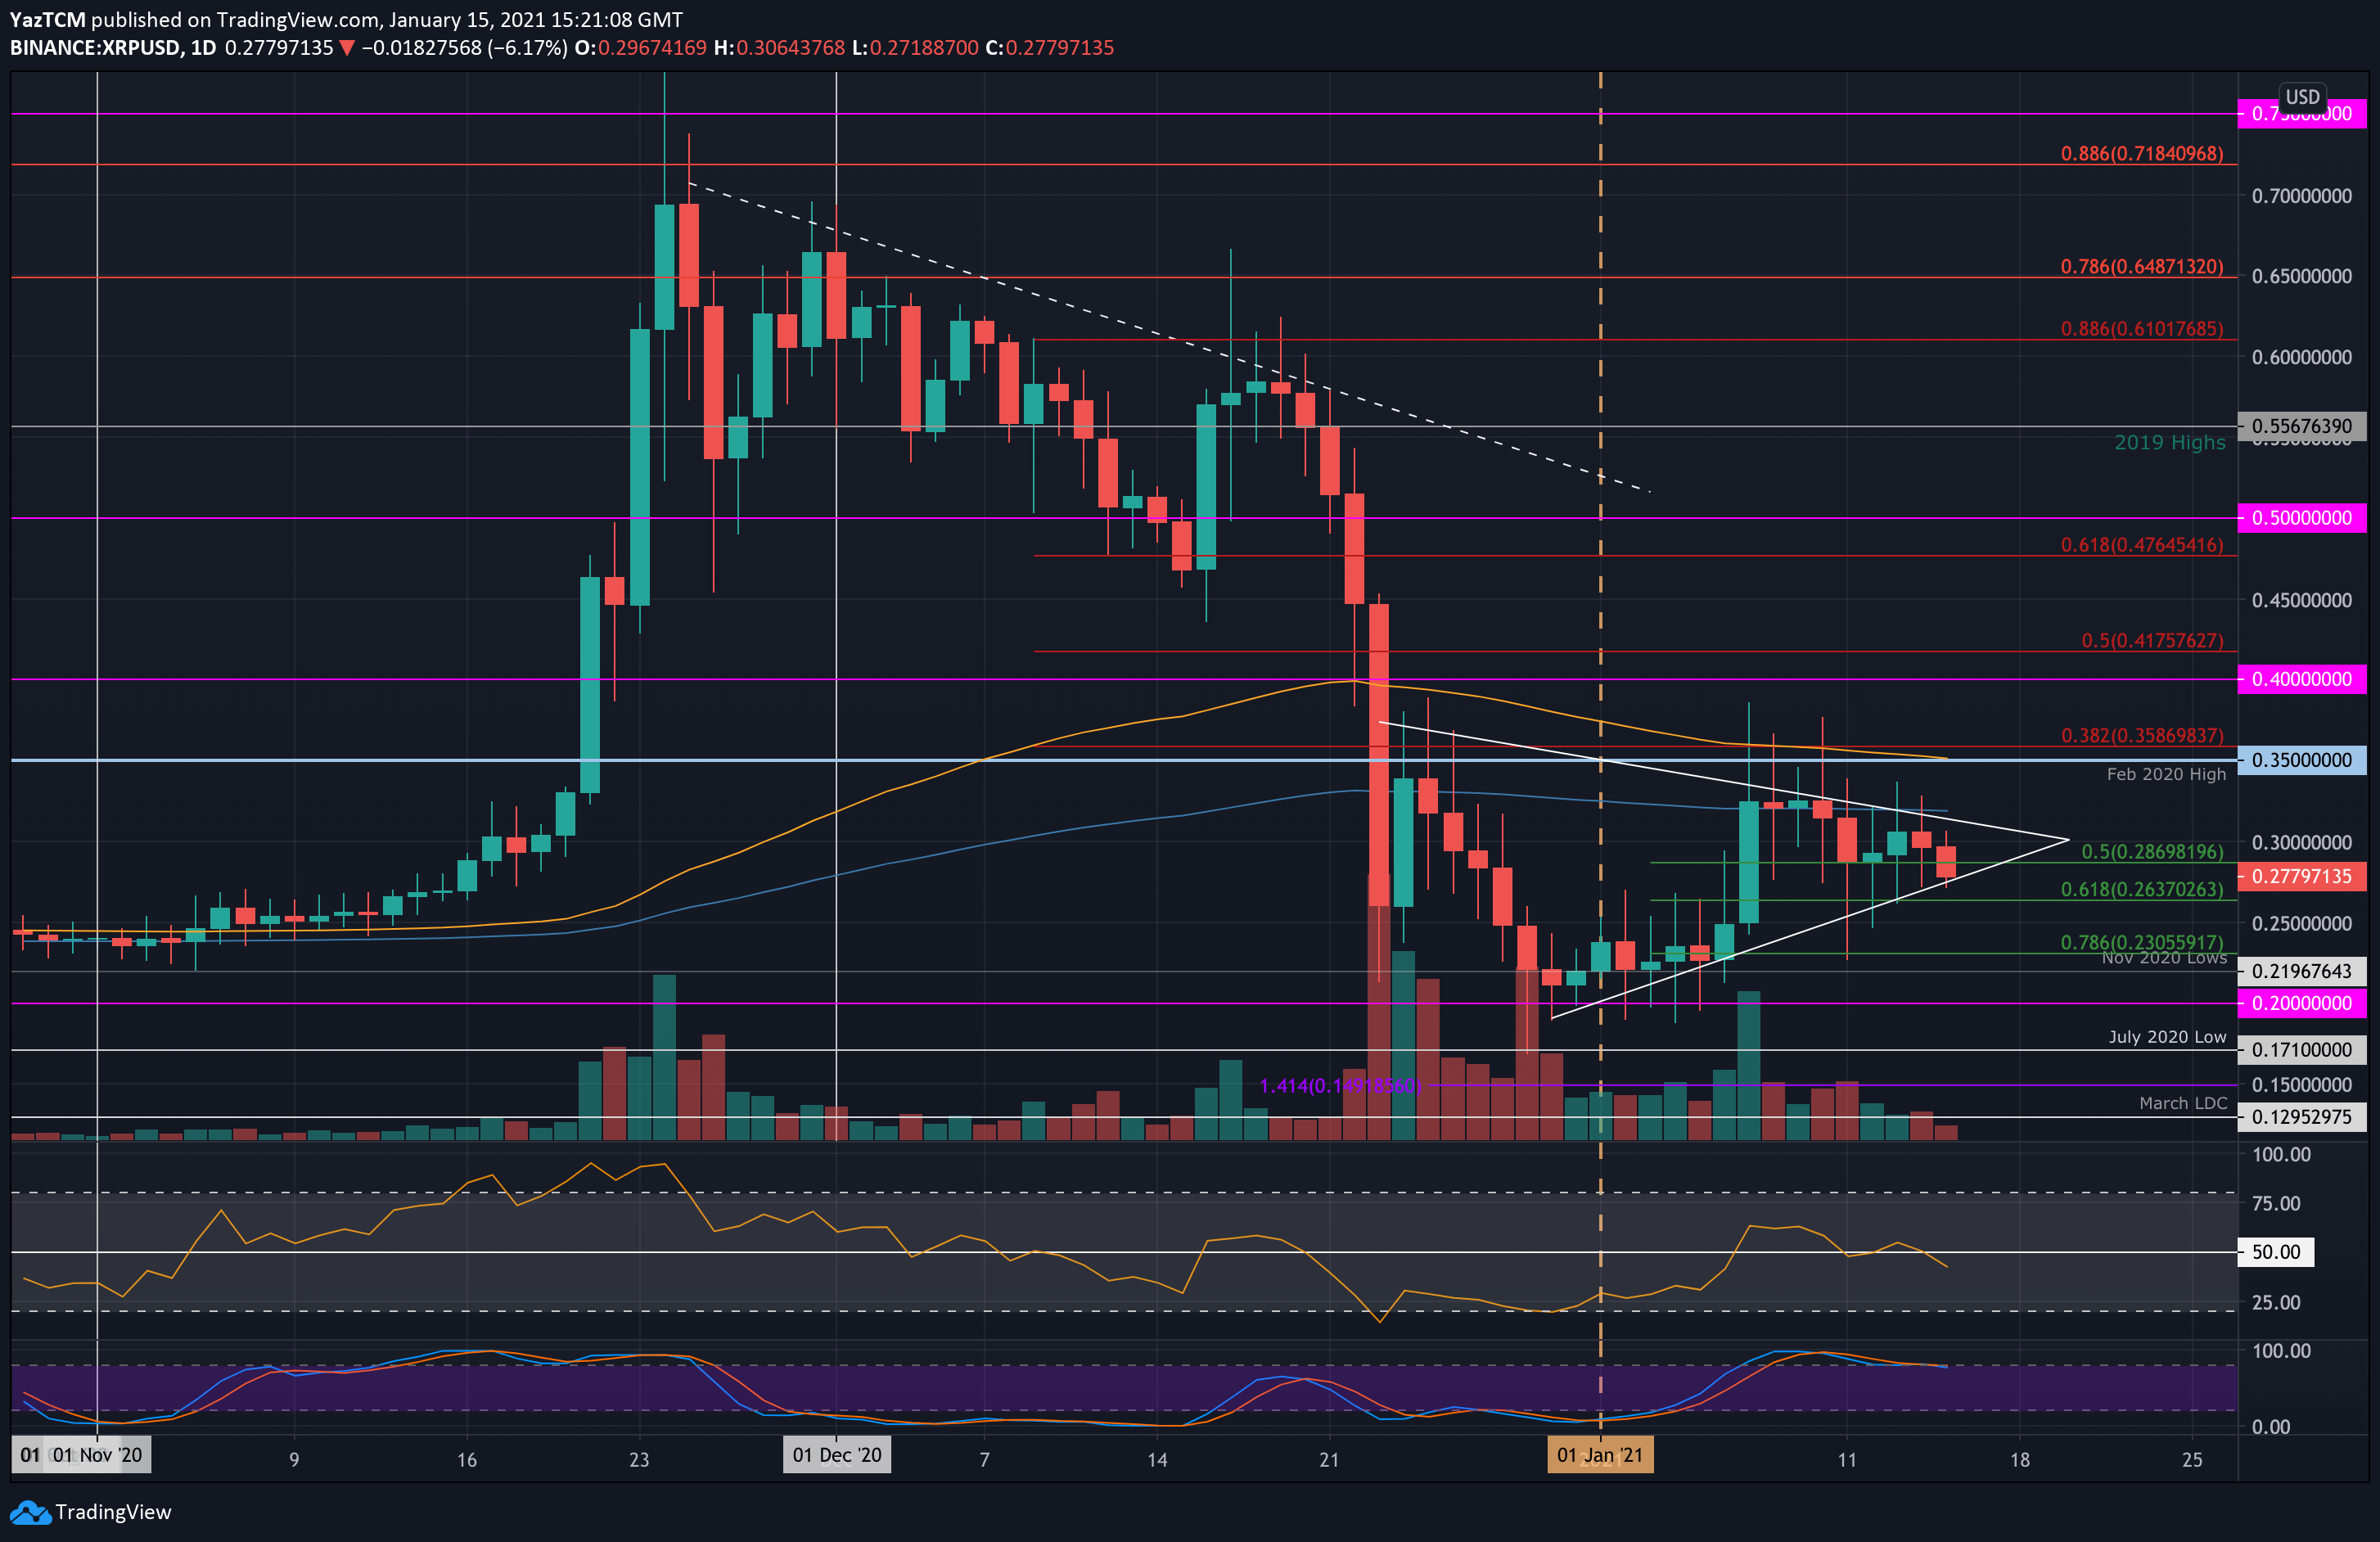
XRP dropped by another 13.5% this week as it falls into the $0.277 level. The cryptocurrency was trading at the 200-days EMA at the start of the week but failed to break resistance at the upper boundary of a triangle.
As a result, XRP started to head lower throughout the week as it fell into support at $0.286 (.5 Fib). It held this support for most of the week but collapsed beneath there today as it trades at $0.277. It is not battling to remain above the triangle.
Looking ahead, if the bears push beneath the lower boundary of the triangle, the first level of support lies at $0.263 (.618 Fib). This is followed by support at $0.25, $0.23 (.786 Fib), $0.219 (November 2020 lows), and $0.2.
On the other side, resistance first lies at $0.3. Thi sis followed by the upper border of the triangle, $0.35 (Feb 2020 highs), $0.358 (bearish .382 Fib), and $0.4.
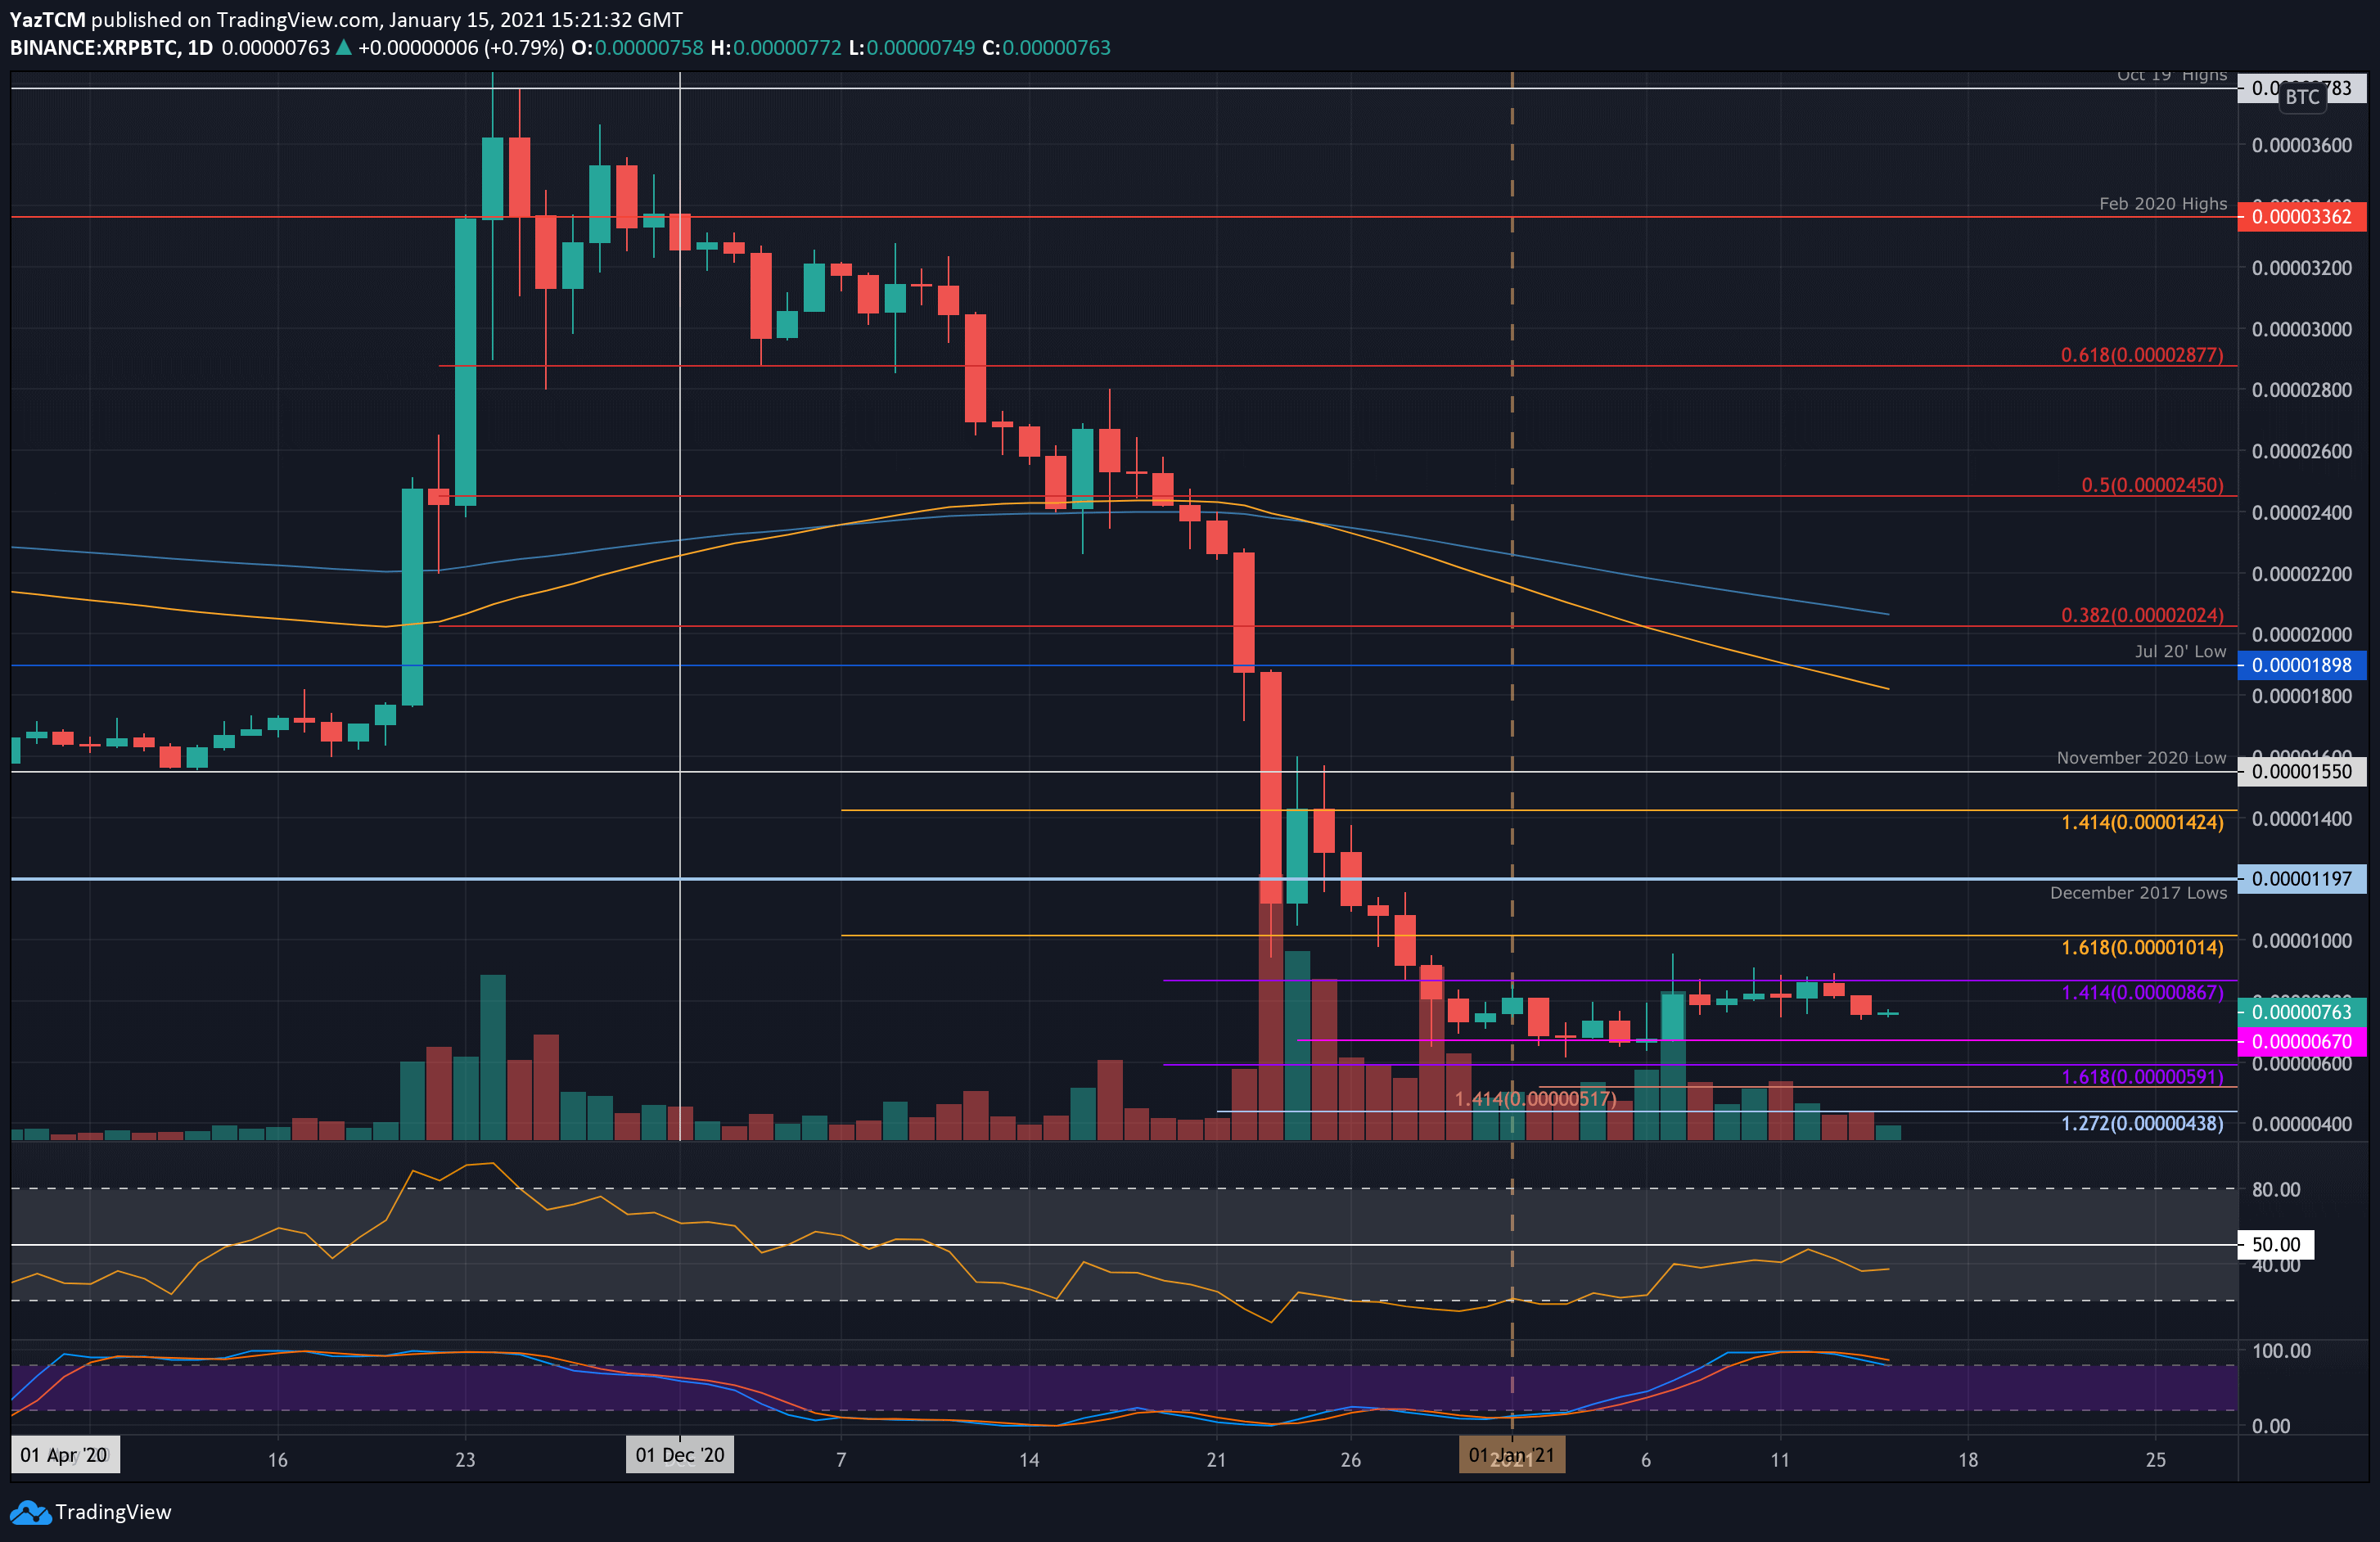
Against Bitcoin, XRP continues to trade sideways between resistance at 867 SAT and support at 670 SAT. It has been between these two boundaries for the entire period of 2021 and must break one of these levels to dictate the next direction for the market.
Moving forward, if the sellers push lower, the first level of support lies at 700 SAT. This is followed by 670 SAT, 600 SAT, 590 SAT, and 520 SAT.
On the other side, resistance lies at 867 SAT, 1000 SAT, 1200 SAT (December 2017 lows), and 1400 SAT.
Polkadot
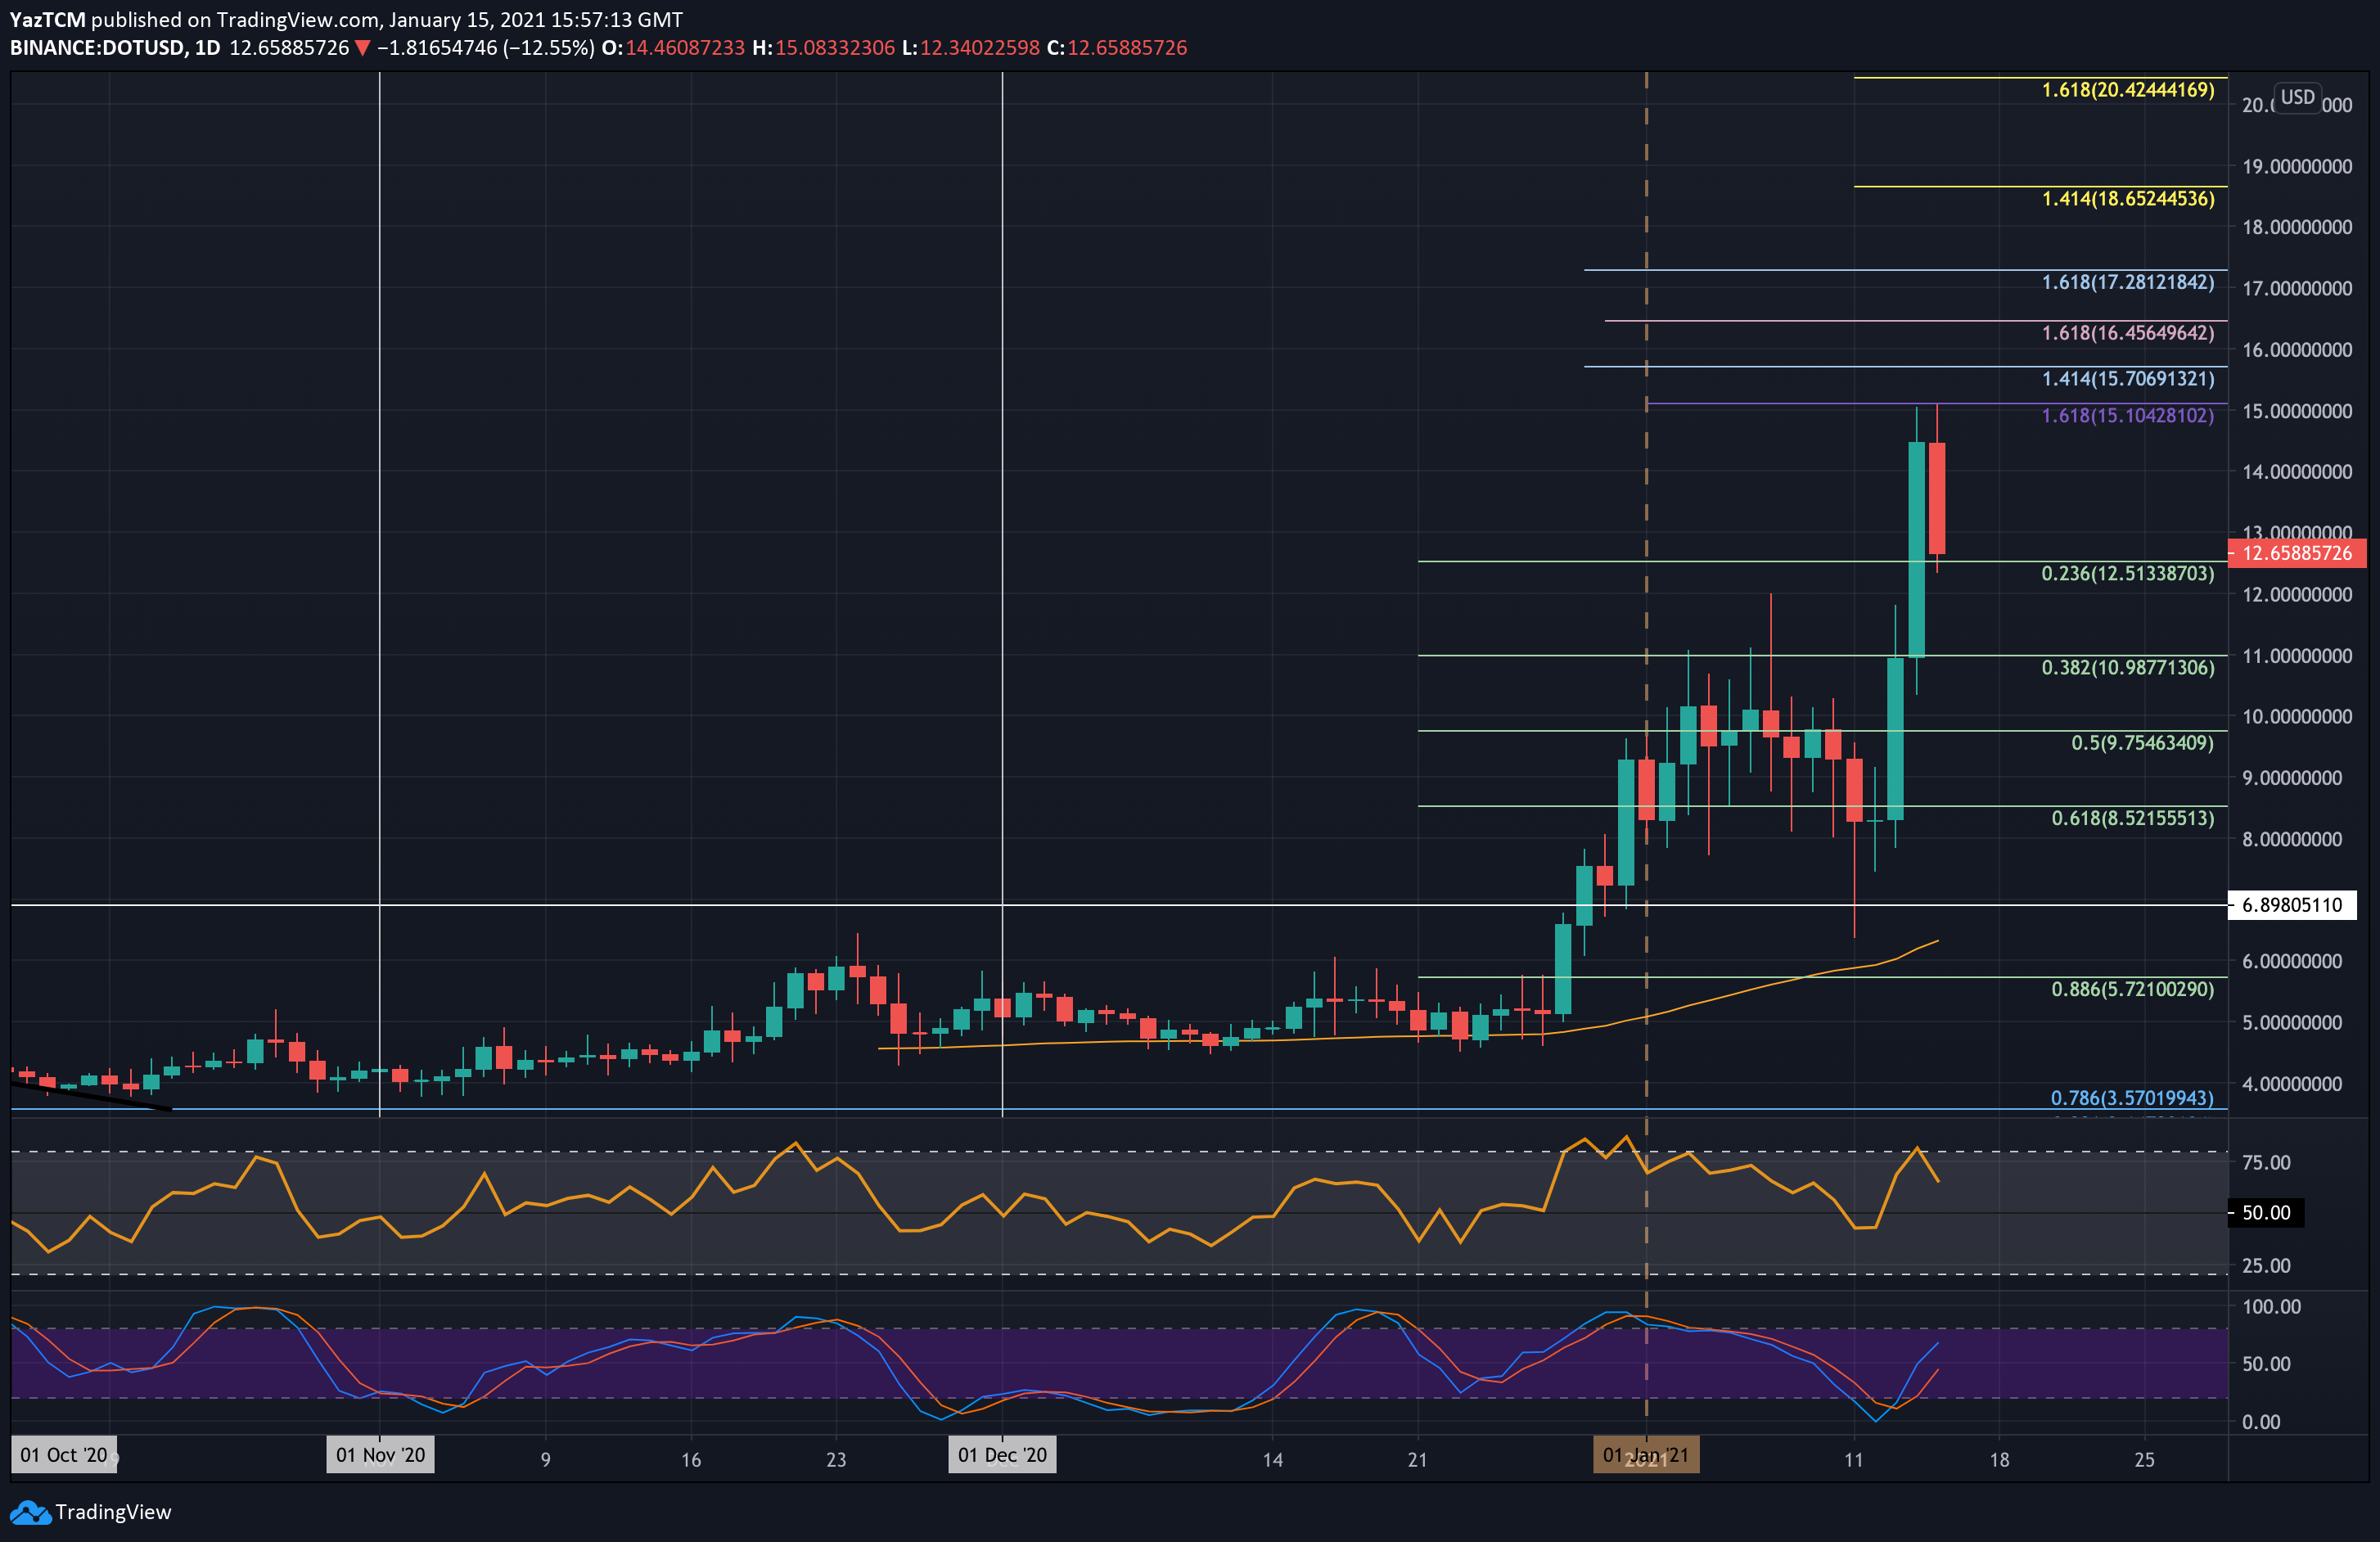
DOT saw a powerful 36% price explosion this week as it sets a new ATH at $15.10 today. The cryptocurrency started the week by dropping into the support at $8.00. It rebounded from there on Wednesday as it began to push higher into the $11 resistance.
Yesterday, DOT continued to surge much higher above $11 as it passed $14 to reach as high as $15.10. There, it ran into resistance at a 1.618 Fib Extension and could not overcome it today. DOT has since dropped to $12.50 (.236 Fib Retracement).
Looking ahead, if the sellers break beneath $12.50, the first level of support lies at $12. This is followed by support at $11 (.382 Fib), $10, $9.75 (.5 Fib), $9, and $8.50 (.618 Fib).
On the other side, the first level of resistance lies at $14. This is followed by $15.10, $15.70 (1.414 Fib Extension), $16.45 (1.618 Fib Extension – pink), and $17.28 (1.618 Fib Extension). Added resistance lies at $18 ad $18.65.
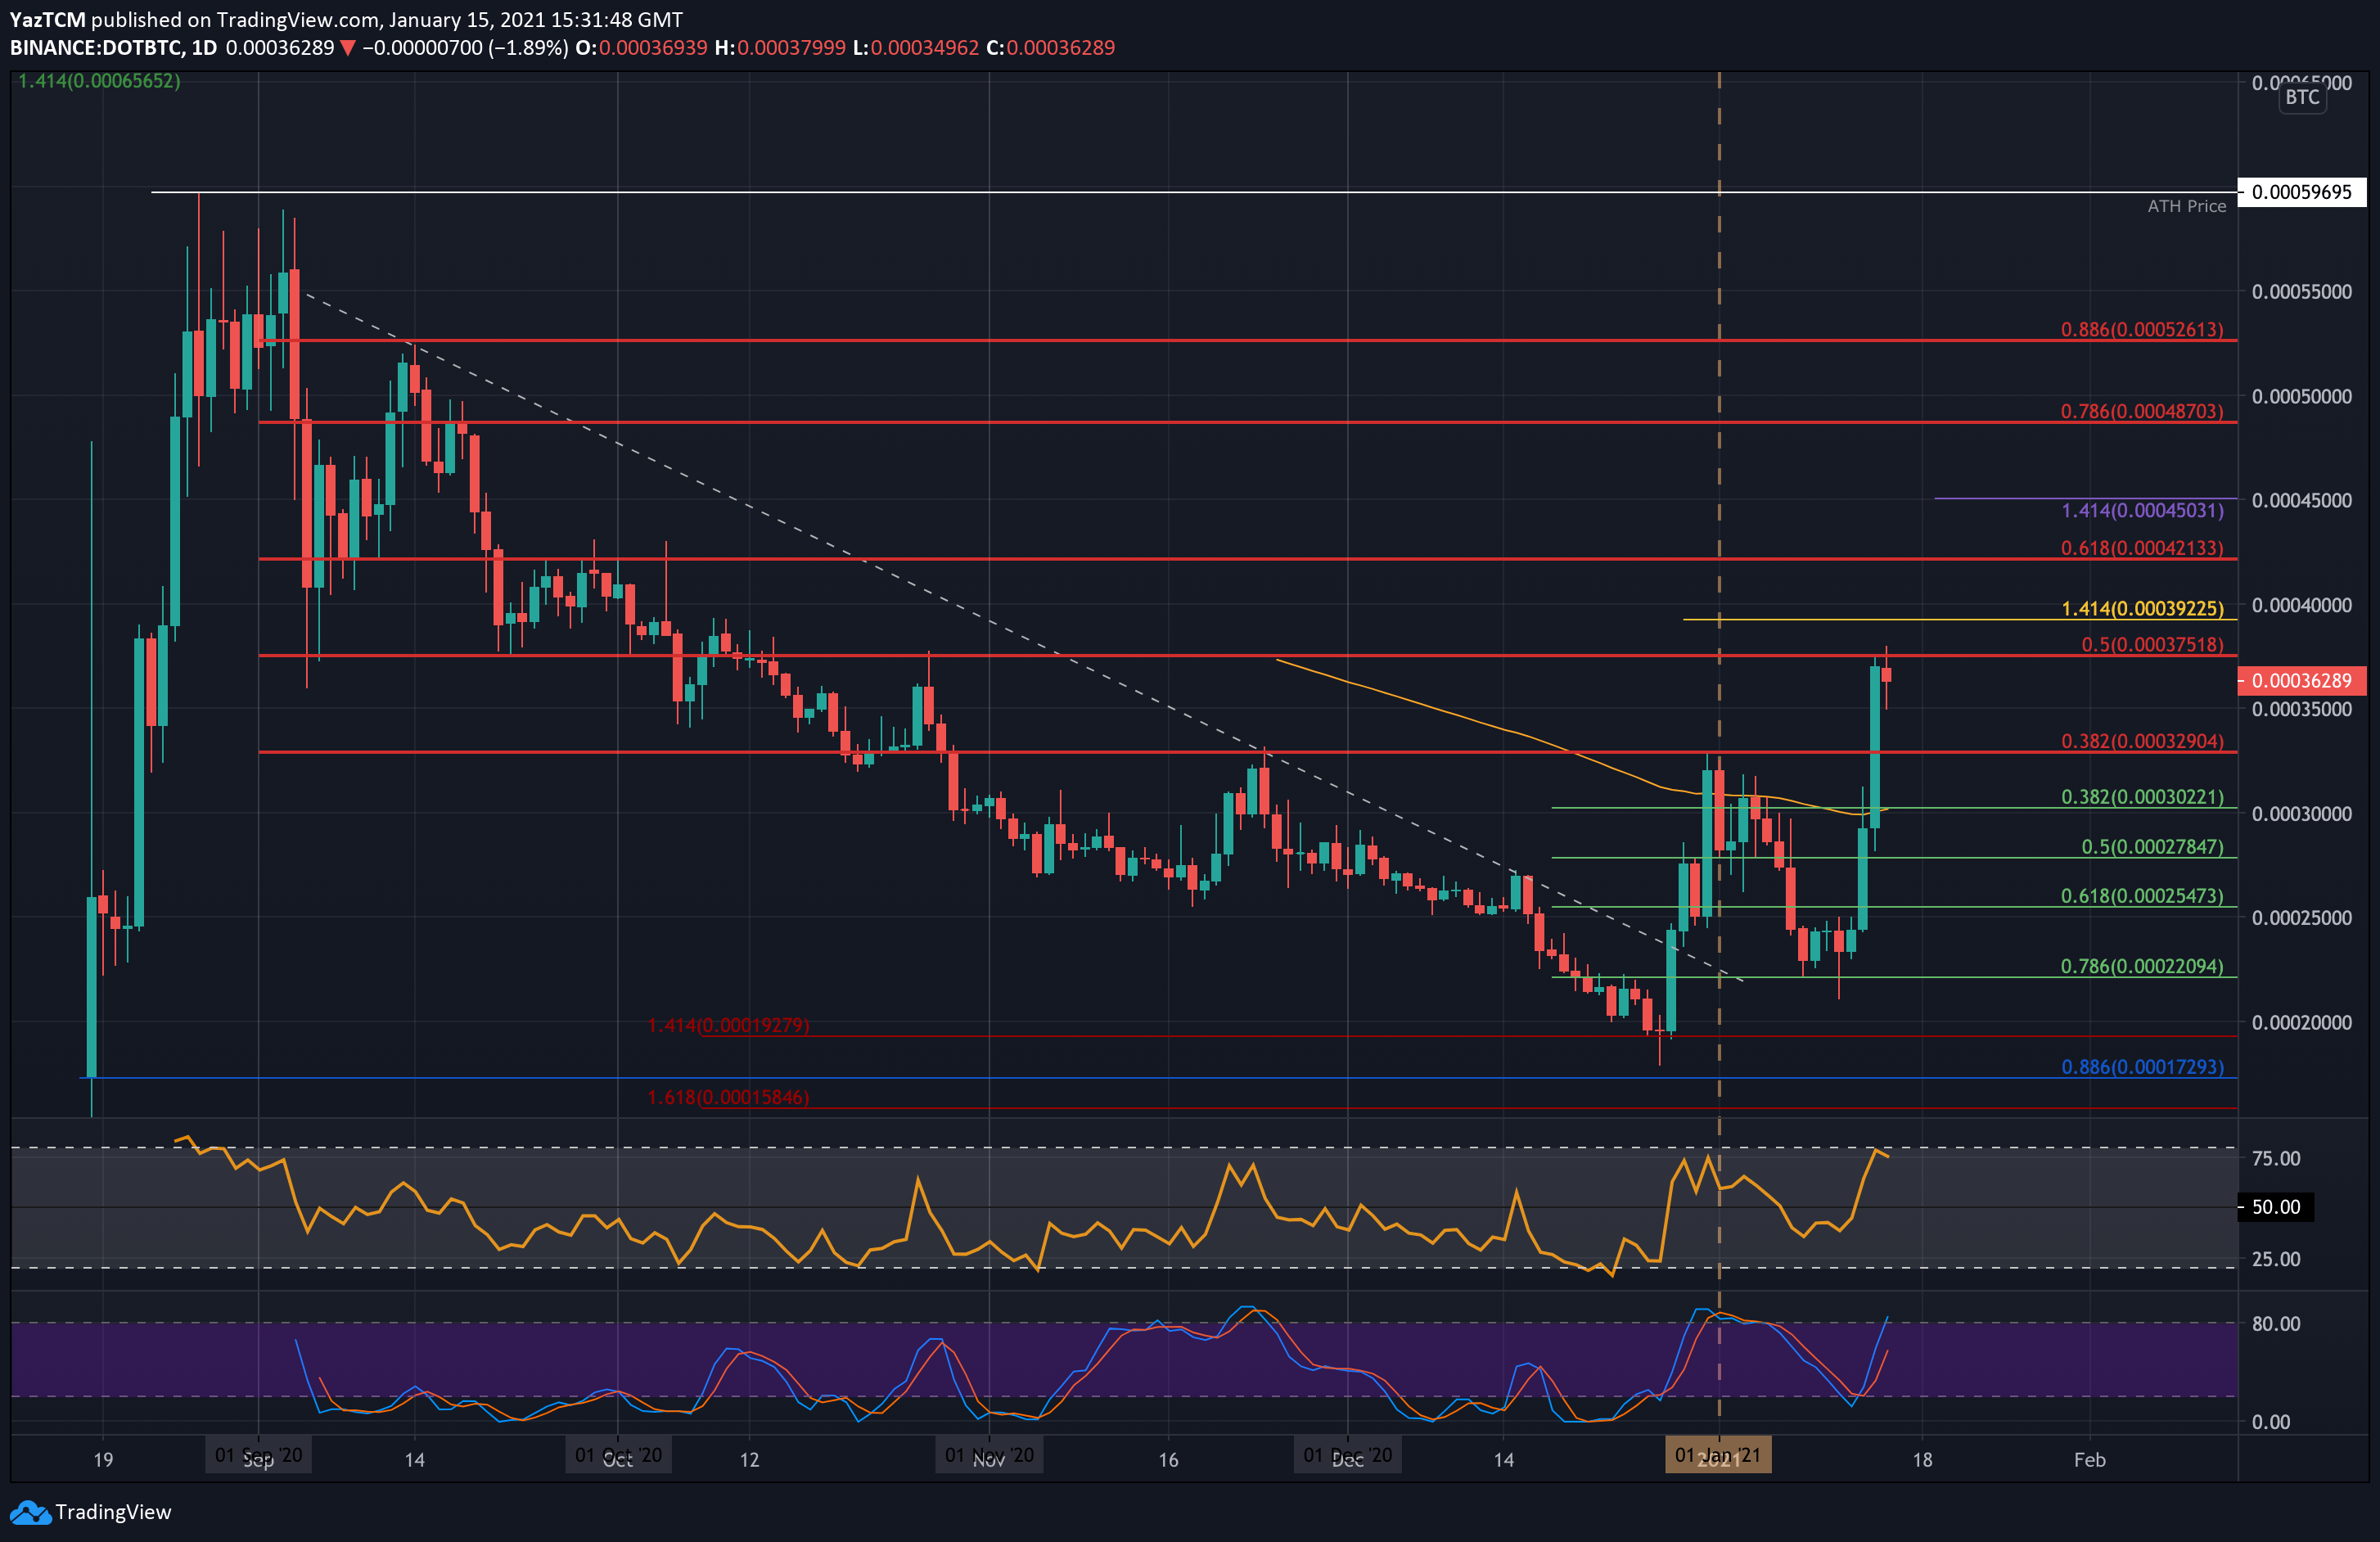
DOT also created a fresh 2-month high against Bitcoin this week after it rebounded from support at 22,094 SAT to break resistance at 32,900 SAT (bearish .382 Fib) and reach as high as 37,520 SAT (bearish .5 Fib).
It has since dropped slightly to trade around 36,000 SAT.
Moving forward, the first level of support lies at 35,000 SAT. This is followed by 32,900 SAT, 30,220 SAT (.382 Fib), and 28,850 SAT (.5 Fib).
On the other side, if the bulls can break 37,520 SAT (bearish .5 Fib), resistance lies at 39,225 SAT (1.414 Fib Extension – yellow), 42,130 SAT (bearish .618 Fib Retracement), 45,000 SAT (short term 1.414 Fib Extension), and 48,700 SAT (bearish .786 Fib Retracement).
Cardano
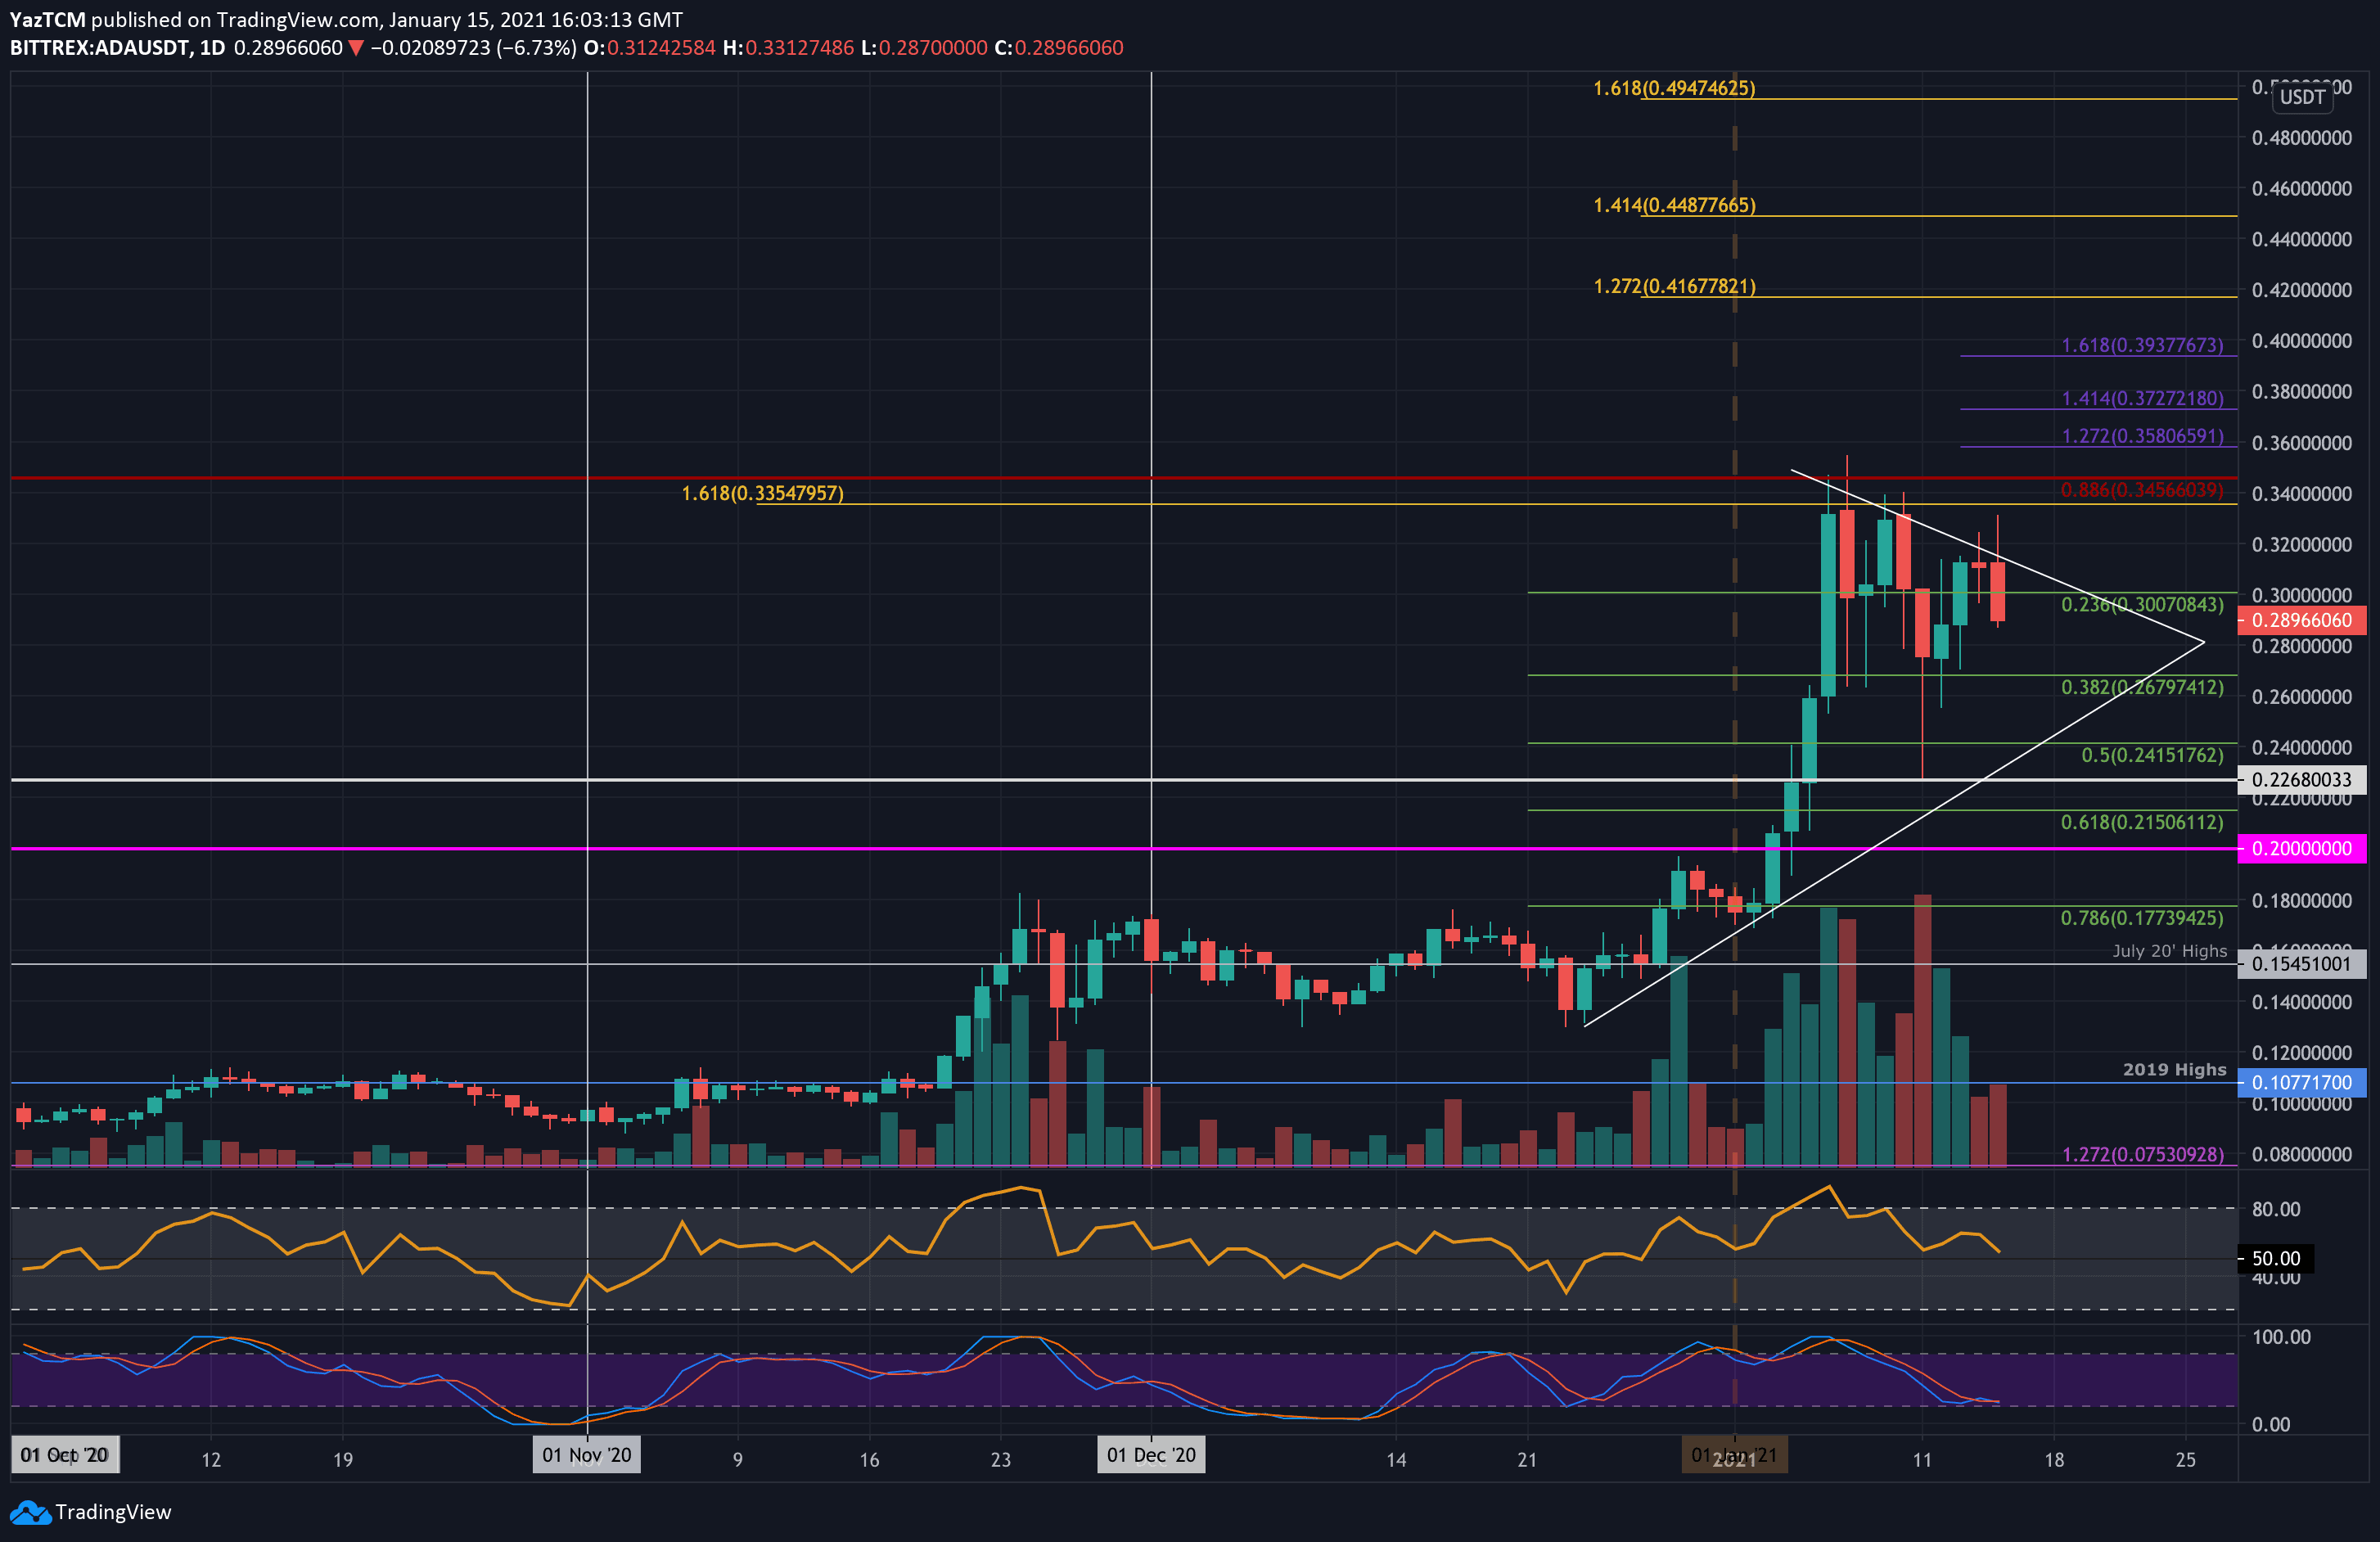
Cardano saw a small 2.7% price hike this week as it currently trades at $0.289. The cryptocurrency was trading at resistance around $0.335 at the start of the week but started to head lower when BTC dropped.
It managed to find support at $0.267 (.382 Fib) and rebounded from there on Wednesday. After bouncing, ADA climbed higher but could not break resistance at the upper boundary of a symmetrical triangle pattern. It has since rolled over from this border and started to drop lower to trade at $0.289.
Moving forward, if the sellers continue to head lower, the first level of support lies at $0.28. This is followed by support at $0.267 (.382 Fib), $0.241 (.5 Fib), and the triangle’s lower border. Added support is found at $0.22 and $0.215 (.618 Fib).
On the other side, the first level of resistance lies at $0.3. This is followed by the upper border, $0.32 and $0.335. Additional resistance lies at $0.345 (bearish .886 Fib), 40.358 (short term 1.272 Fib Extension), $0.372 (short term 1.414 Fib Extension), and $0.393 (short term 1.618 Fib Extension).
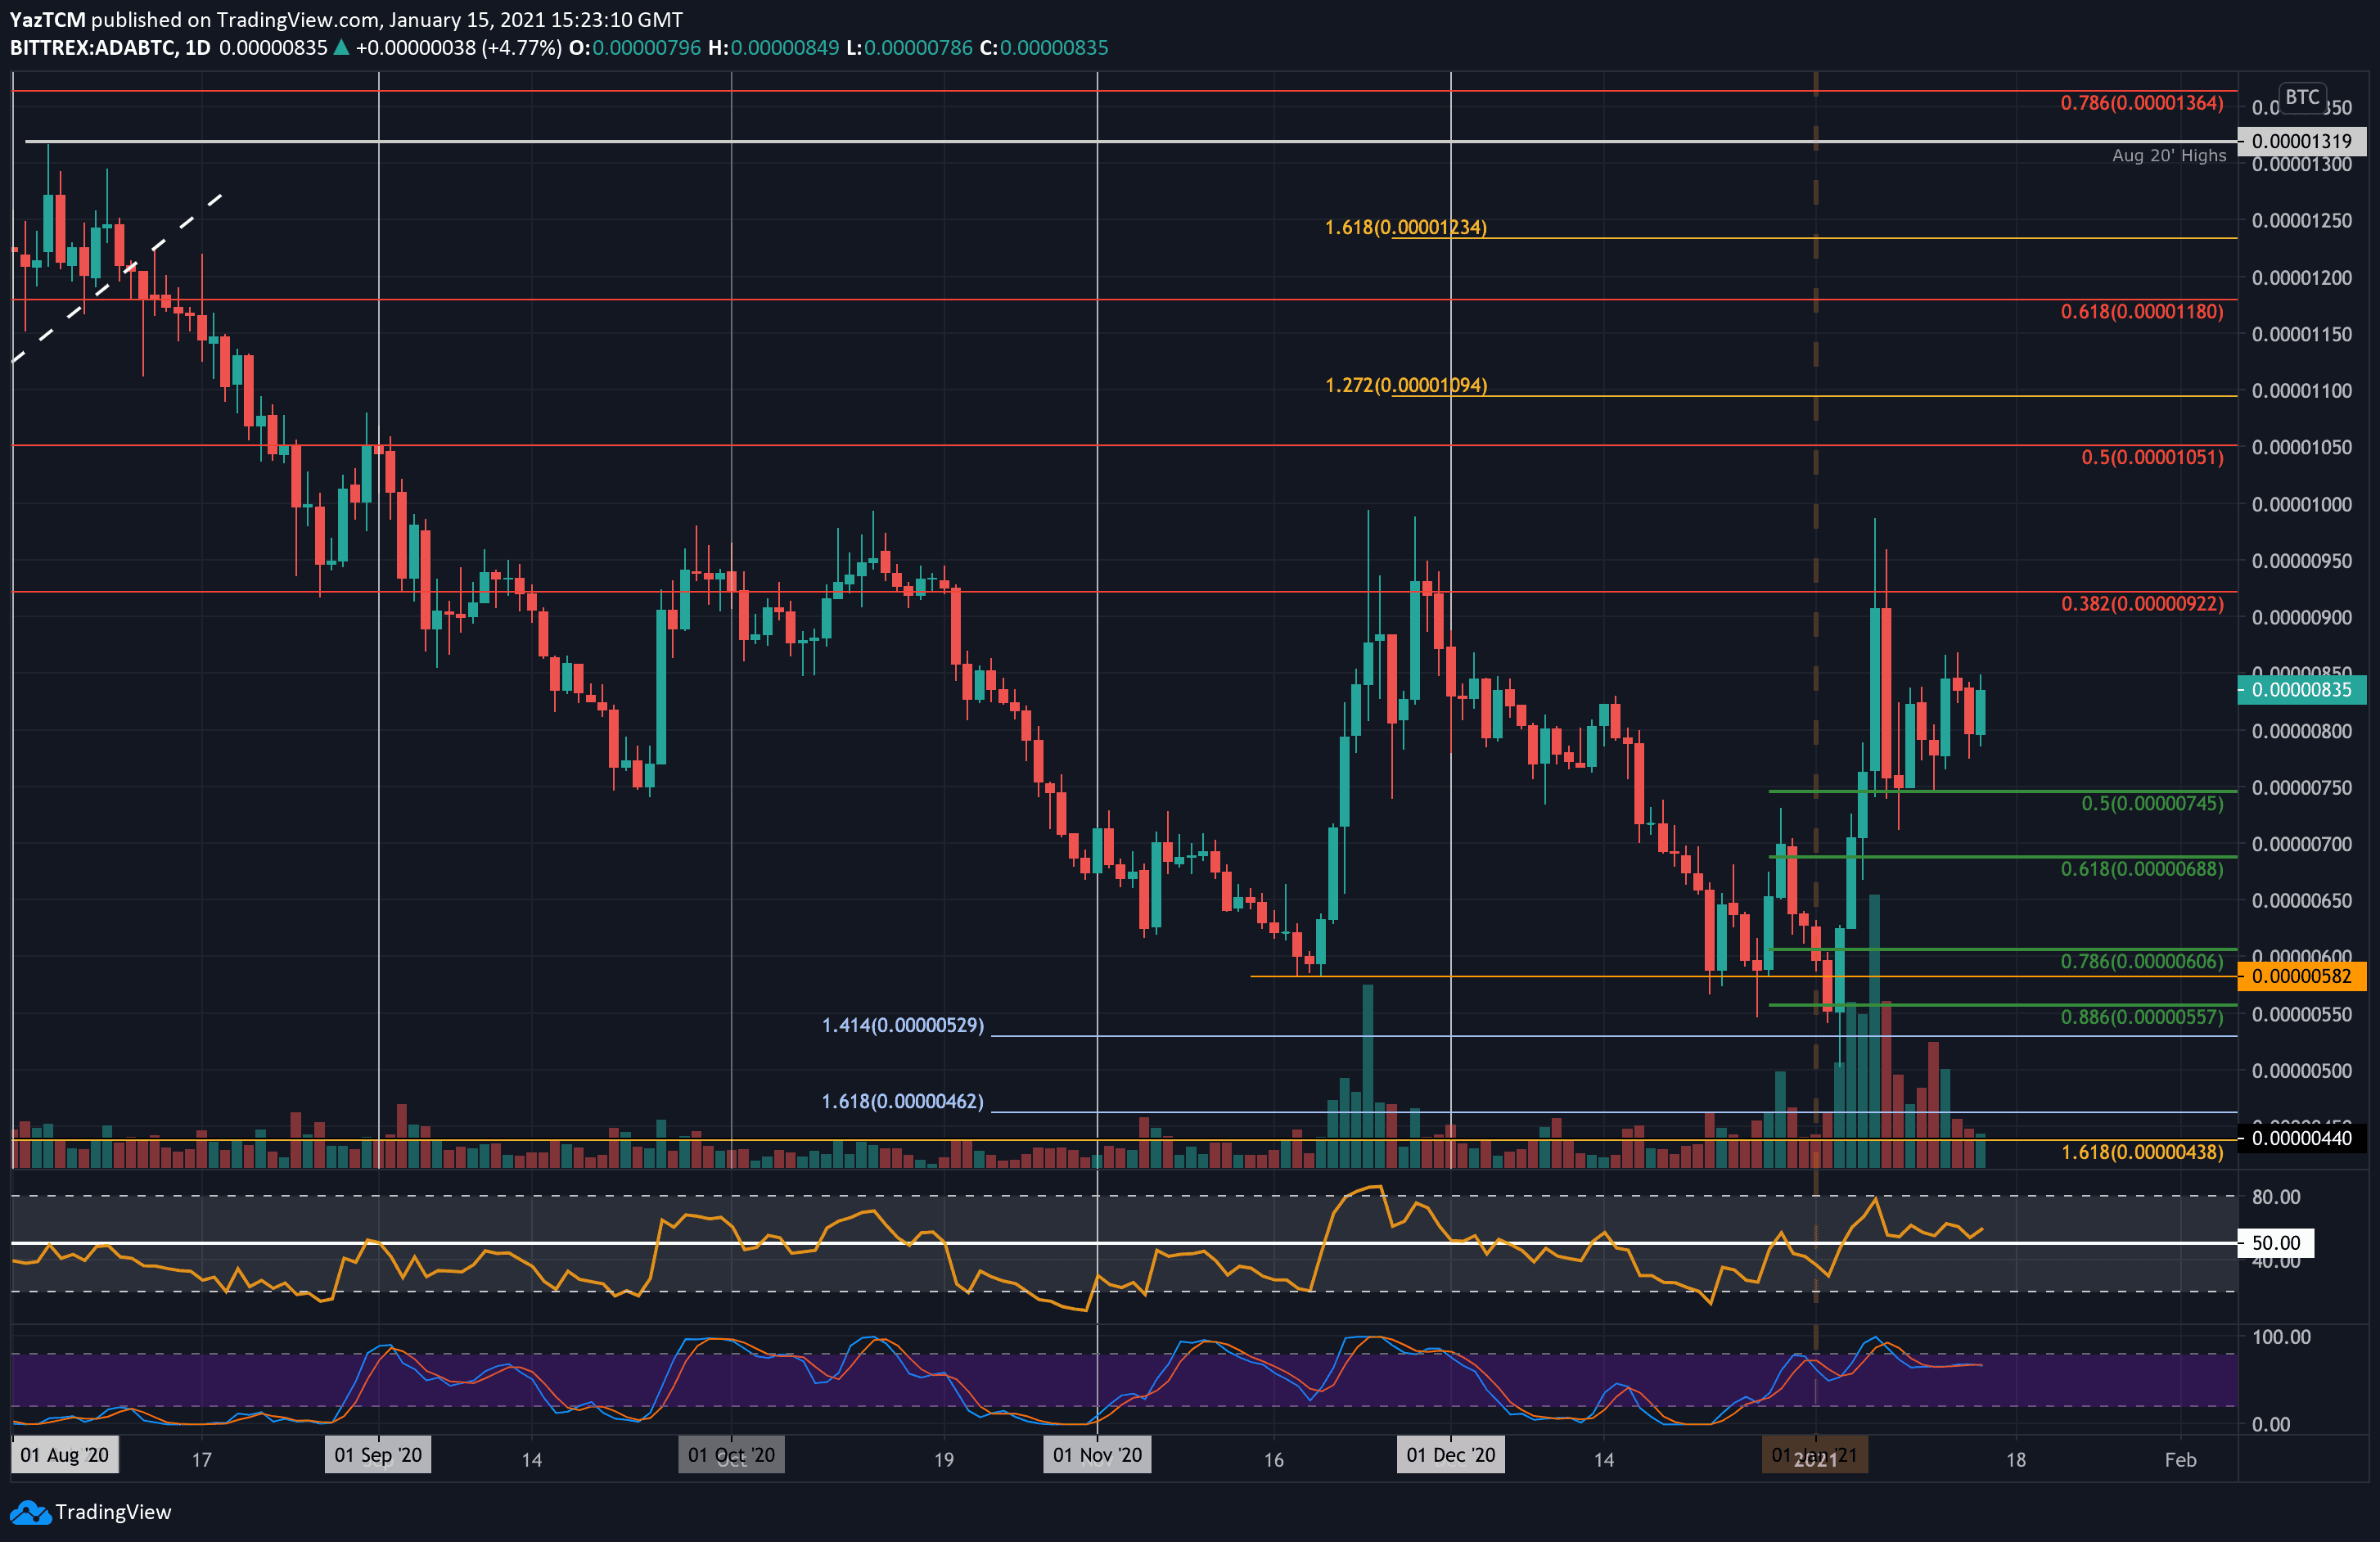
Against Bitcoin, Cardano has pushed higher from the support at 745 SAT (.5 Fib Retracement). It is now trading at 835 SAT after failing to break the 850 SAT resistance yesterday.
Looking ahead, the first level of resistance lies at 850 SAT. This is followed by 900 SAT, 922 SAT (bearish .382 Fib), 950 SAT, and 1000 SAT.
On the other side, support lies at 800 SAT. This is followed by 745 SAT (.5 Fib), 700 SAT, and 688 SAT (.618 Fib).