Bitcoin Bitcoin saw a slight 2.3% price hike this week as it trades near ,500. The cryptocurrency saw a very interesting week in which it spiked lower and produced a daily candle beneath K. It quickly rebounded from there and broke back above 30K to reach the 20-day MA at around ,700. In doing so, BTC is now above a long-term descending wedge that it has been trading inside since mid-May. The coin was trading inside a descending triangle pattern at the start of the week and went on to break beneath the floor at around ,200 on Monday. On Tuesday, it dipped further, reaching as low as ,300 and producing the daily candle close beneath K. From there, BTC quickly rebounded on Wednesday to reach the upper angle of the long-term falling wedge that it was trading
Topics:
Yaz Sheikh considers the following as important: ADABTC, ADAUSD, Bitcoin (BTC) Price, BTC Analysis, BTCEUR, BTCGBP, btcusd, btcusdt, Cardano (ADA) Price, ETH Analysis, ETHBTC, Ethereum (ETH) Price, ethusd, MATICBTC, MATICUSD, Polygon (MATIC) Price, Price Analysis, Ripple (XRP) Price, XRP Analysis, xrpbtc, xrpusd
This could be interesting, too:
Wayne Jones writes Chinese Auto Dealer Dives Into Bitcoin Mining With 6M Investment
CryptoVizArt writes Ethereum Price Analysis: Following a 15% Weekly Crash, What’s Next for ETH?
CryptoVizArt writes Bitcoin Price Analysis: Is BTC In Danger of Falling to ,000 Soon?
Jordan Lyanchev writes Ripple, Dogecoin Whales Bought the Dip as XRP, DOGE Prices Soar
Bitcoin
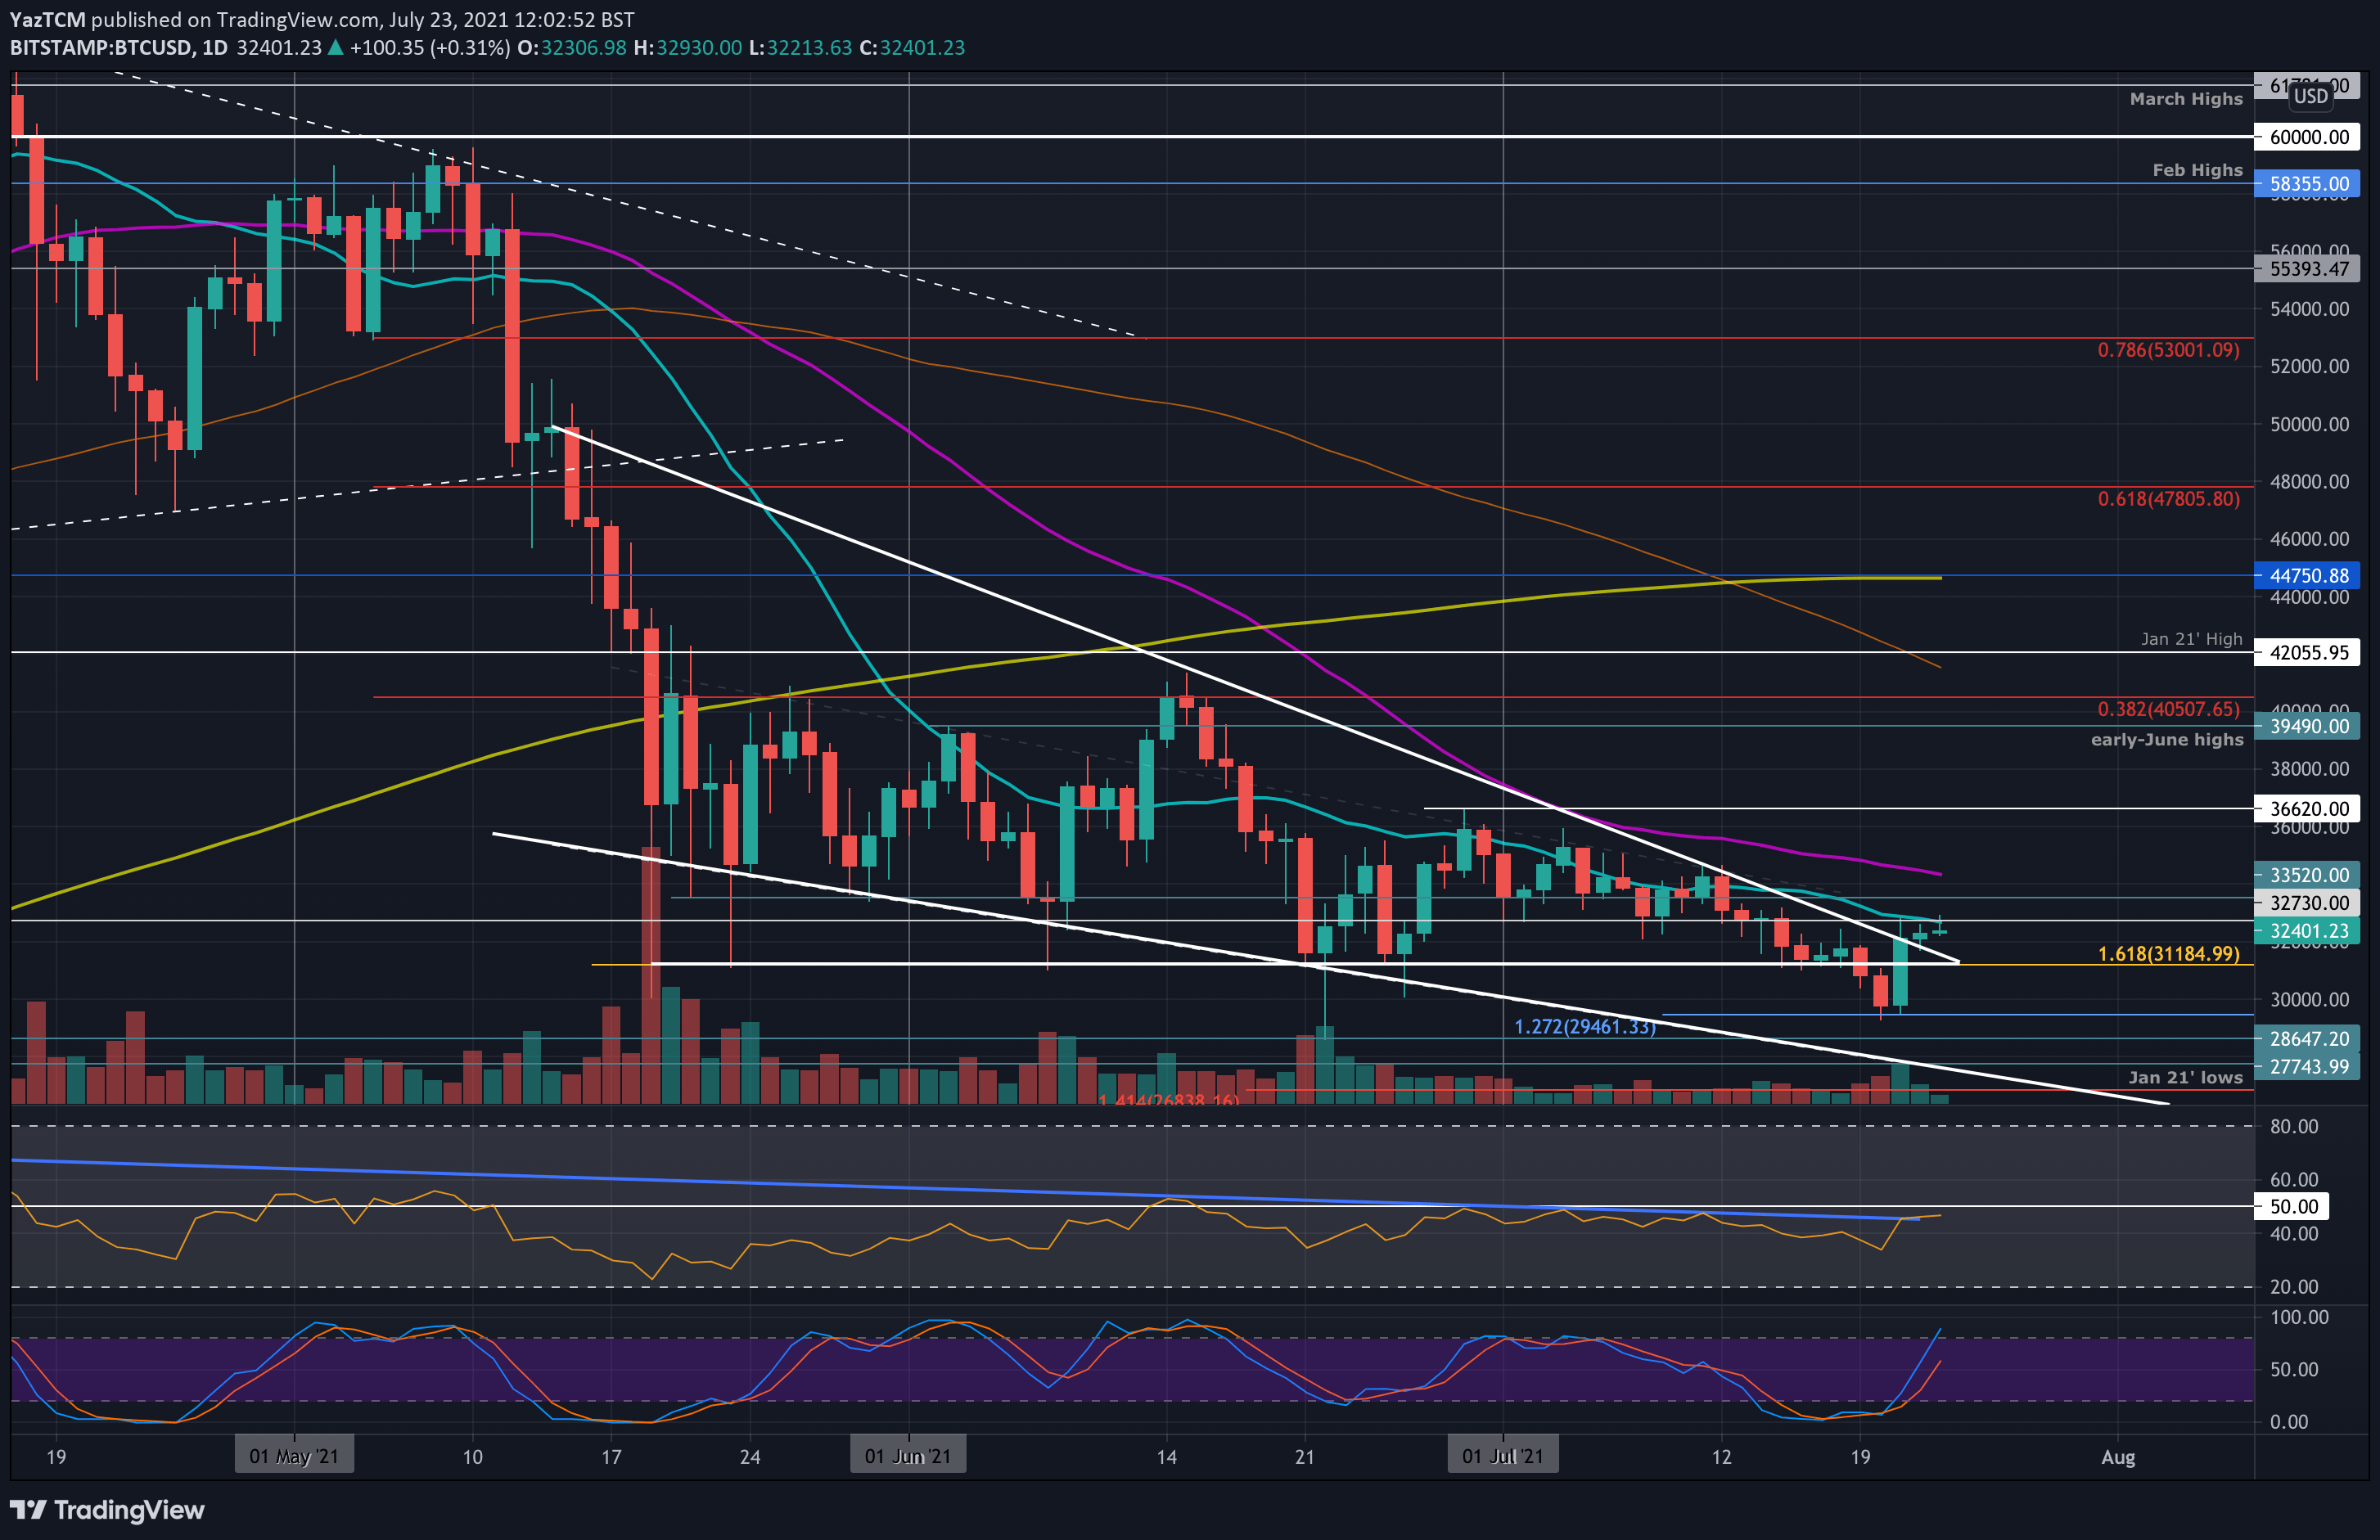
Bitcoin saw a slight 2.3% price hike this week as it trades near $32,500. The cryptocurrency saw a very interesting week in which it spiked lower and produced a daily candle beneath $30K. It quickly rebounded from there and broke back above 30K to reach the 20-day MA at around $32,700. In doing so, BTC is now above a long-term descending wedge that it has been trading inside since mid-May.
The coin was trading inside a descending triangle pattern at the start of the week and went on to break beneath the floor at around $31,200 on Monday. On Tuesday, it dipped further, reaching as low as $29,300 and producing the daily candle close beneath $30K.
From there, BTC quickly rebounded on Wednesday to reach the upper angle of the long-term falling wedge that it was trading within. It broke above this wedge yesterday as it continues to test the resistance at the 20-day MA.
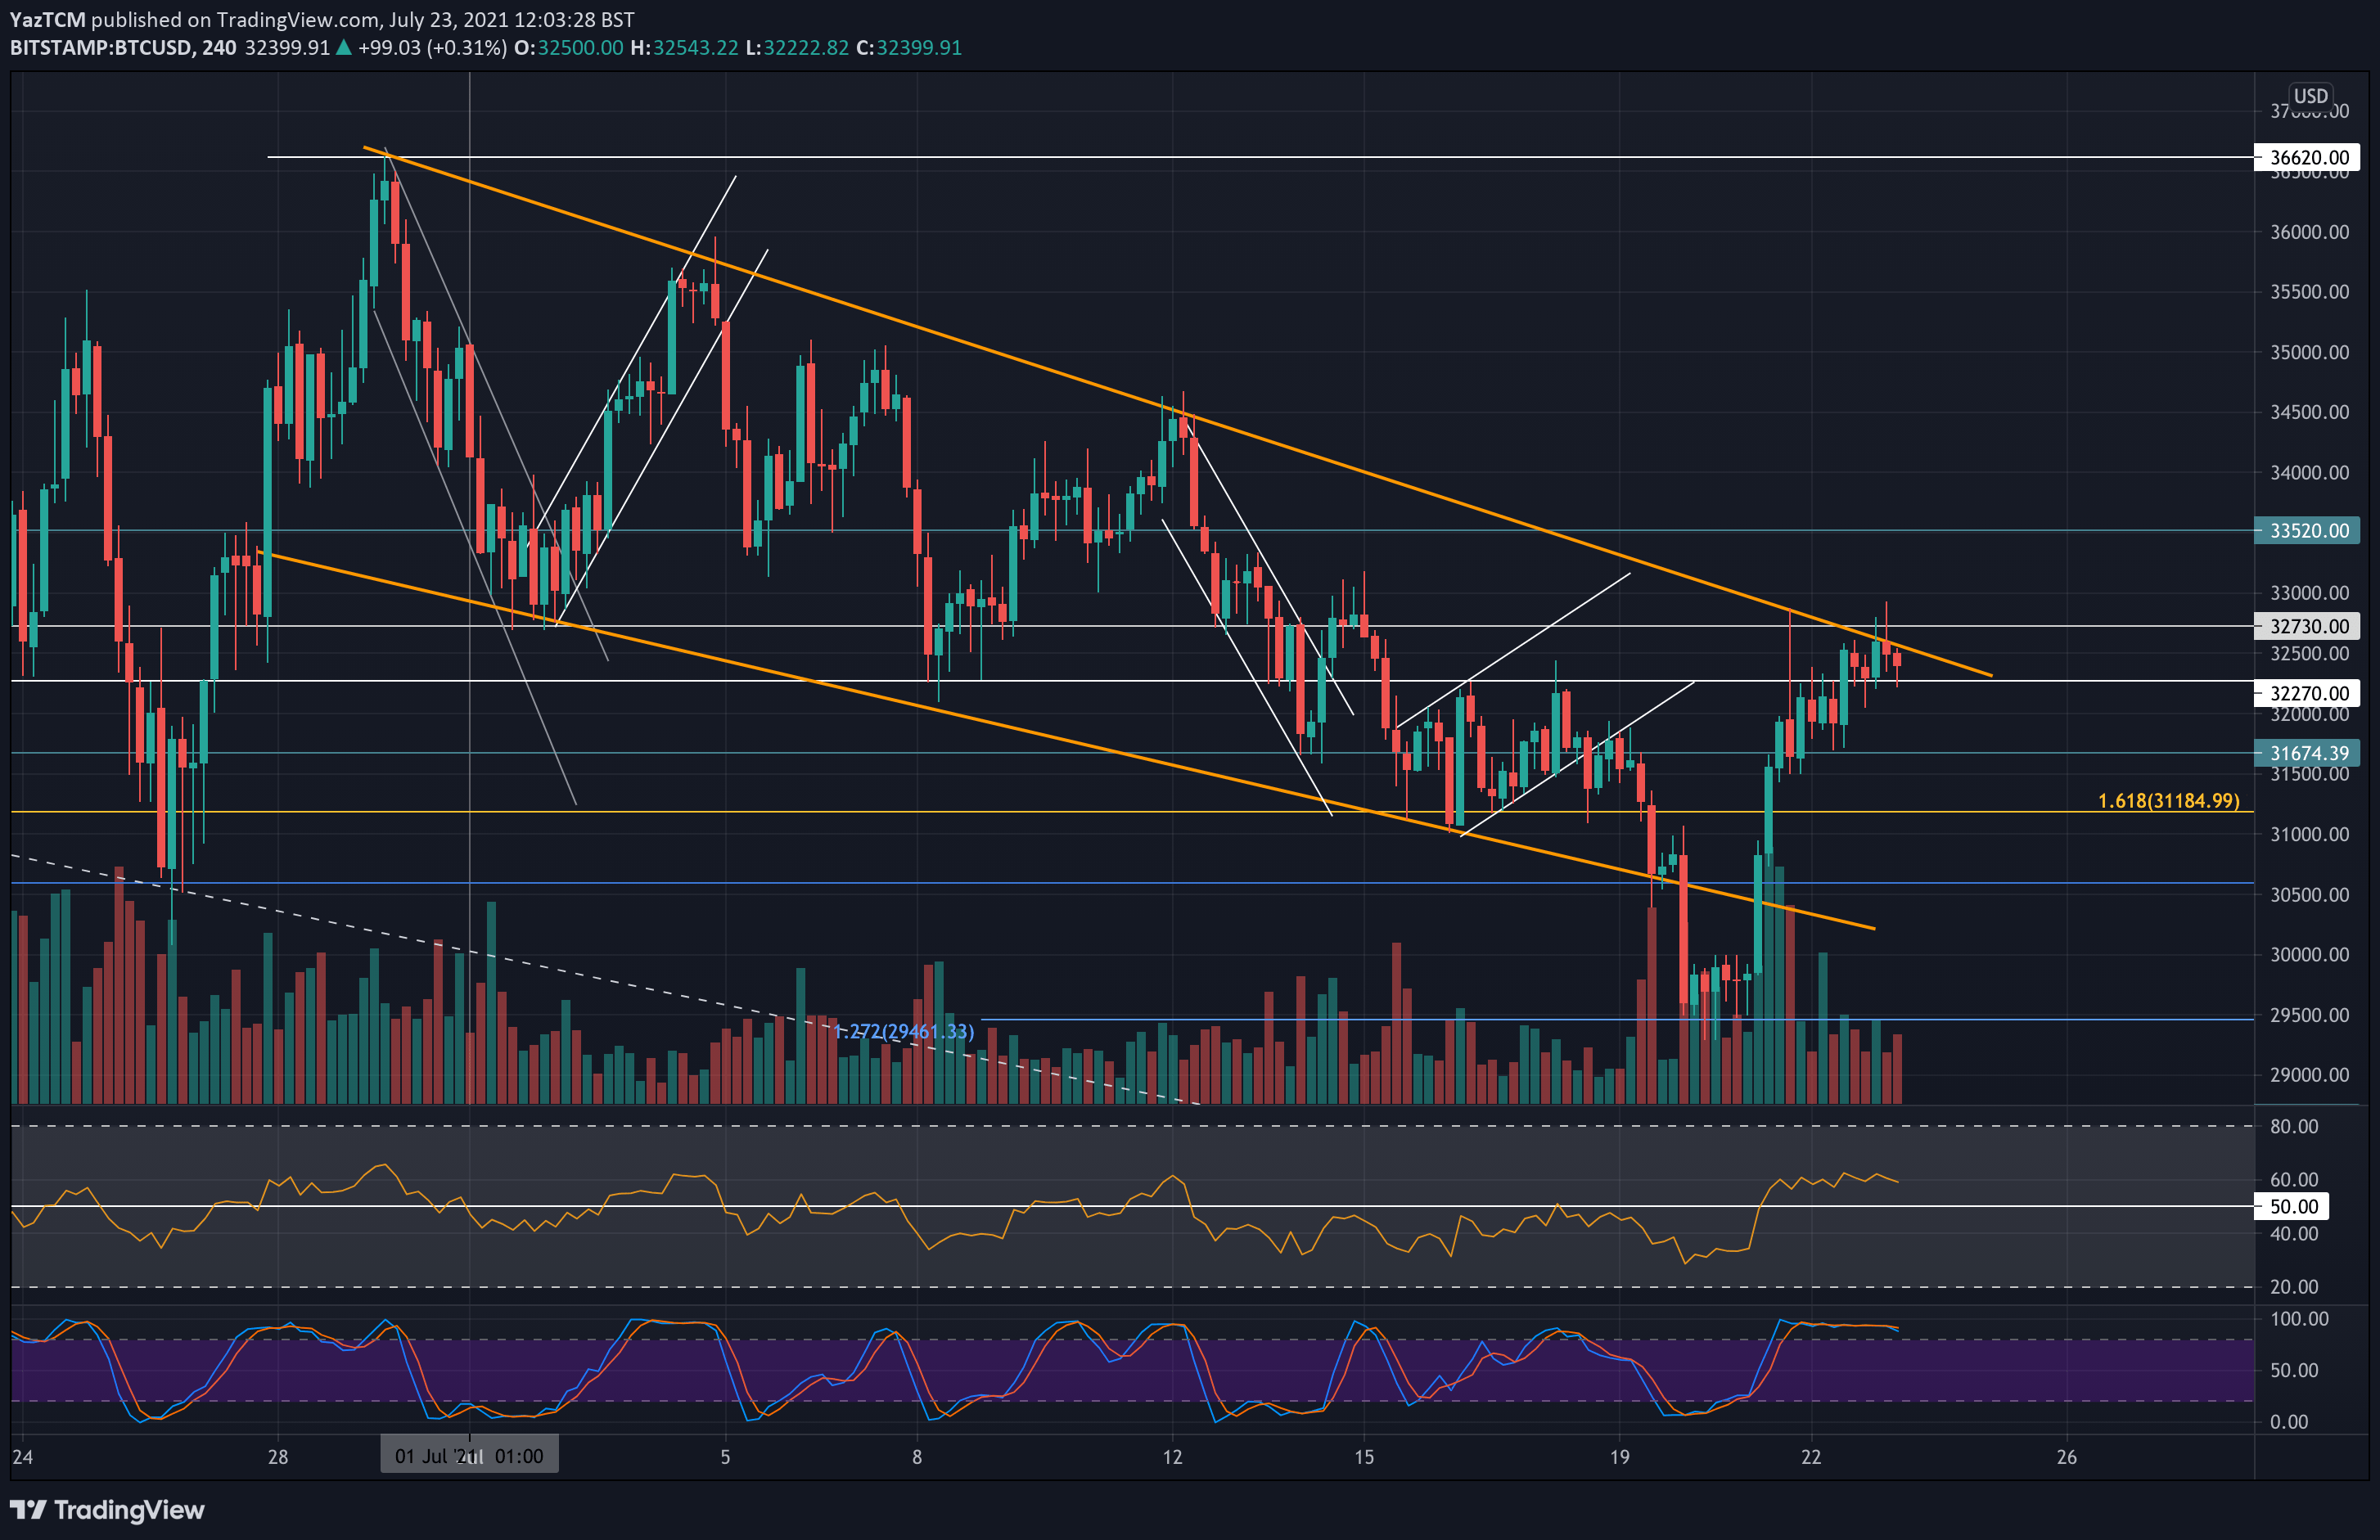
On the short-term chart, the drop beneath $30K caused BTC to break beneath the descending price channel it was trading inside since the start of July. However, the quick recovery allowed BTC to climb back into the channel and now test the upper angle.
Looking ahead, once the buyers break the 20-day MA at $32,700, the first resistance lies at $33,500. This is followed by the 50-day MA at $34,360, $36,000 (July high), and $36,620. Added resistance lies at $38,000 and $40,000.
On the other side, the first support lies at $32,000. This is followed by $31,200, $30,000 (lower angle of short-term price channel), and $29,500. Added support leis at $28,650 and $27,750.
Ethereum
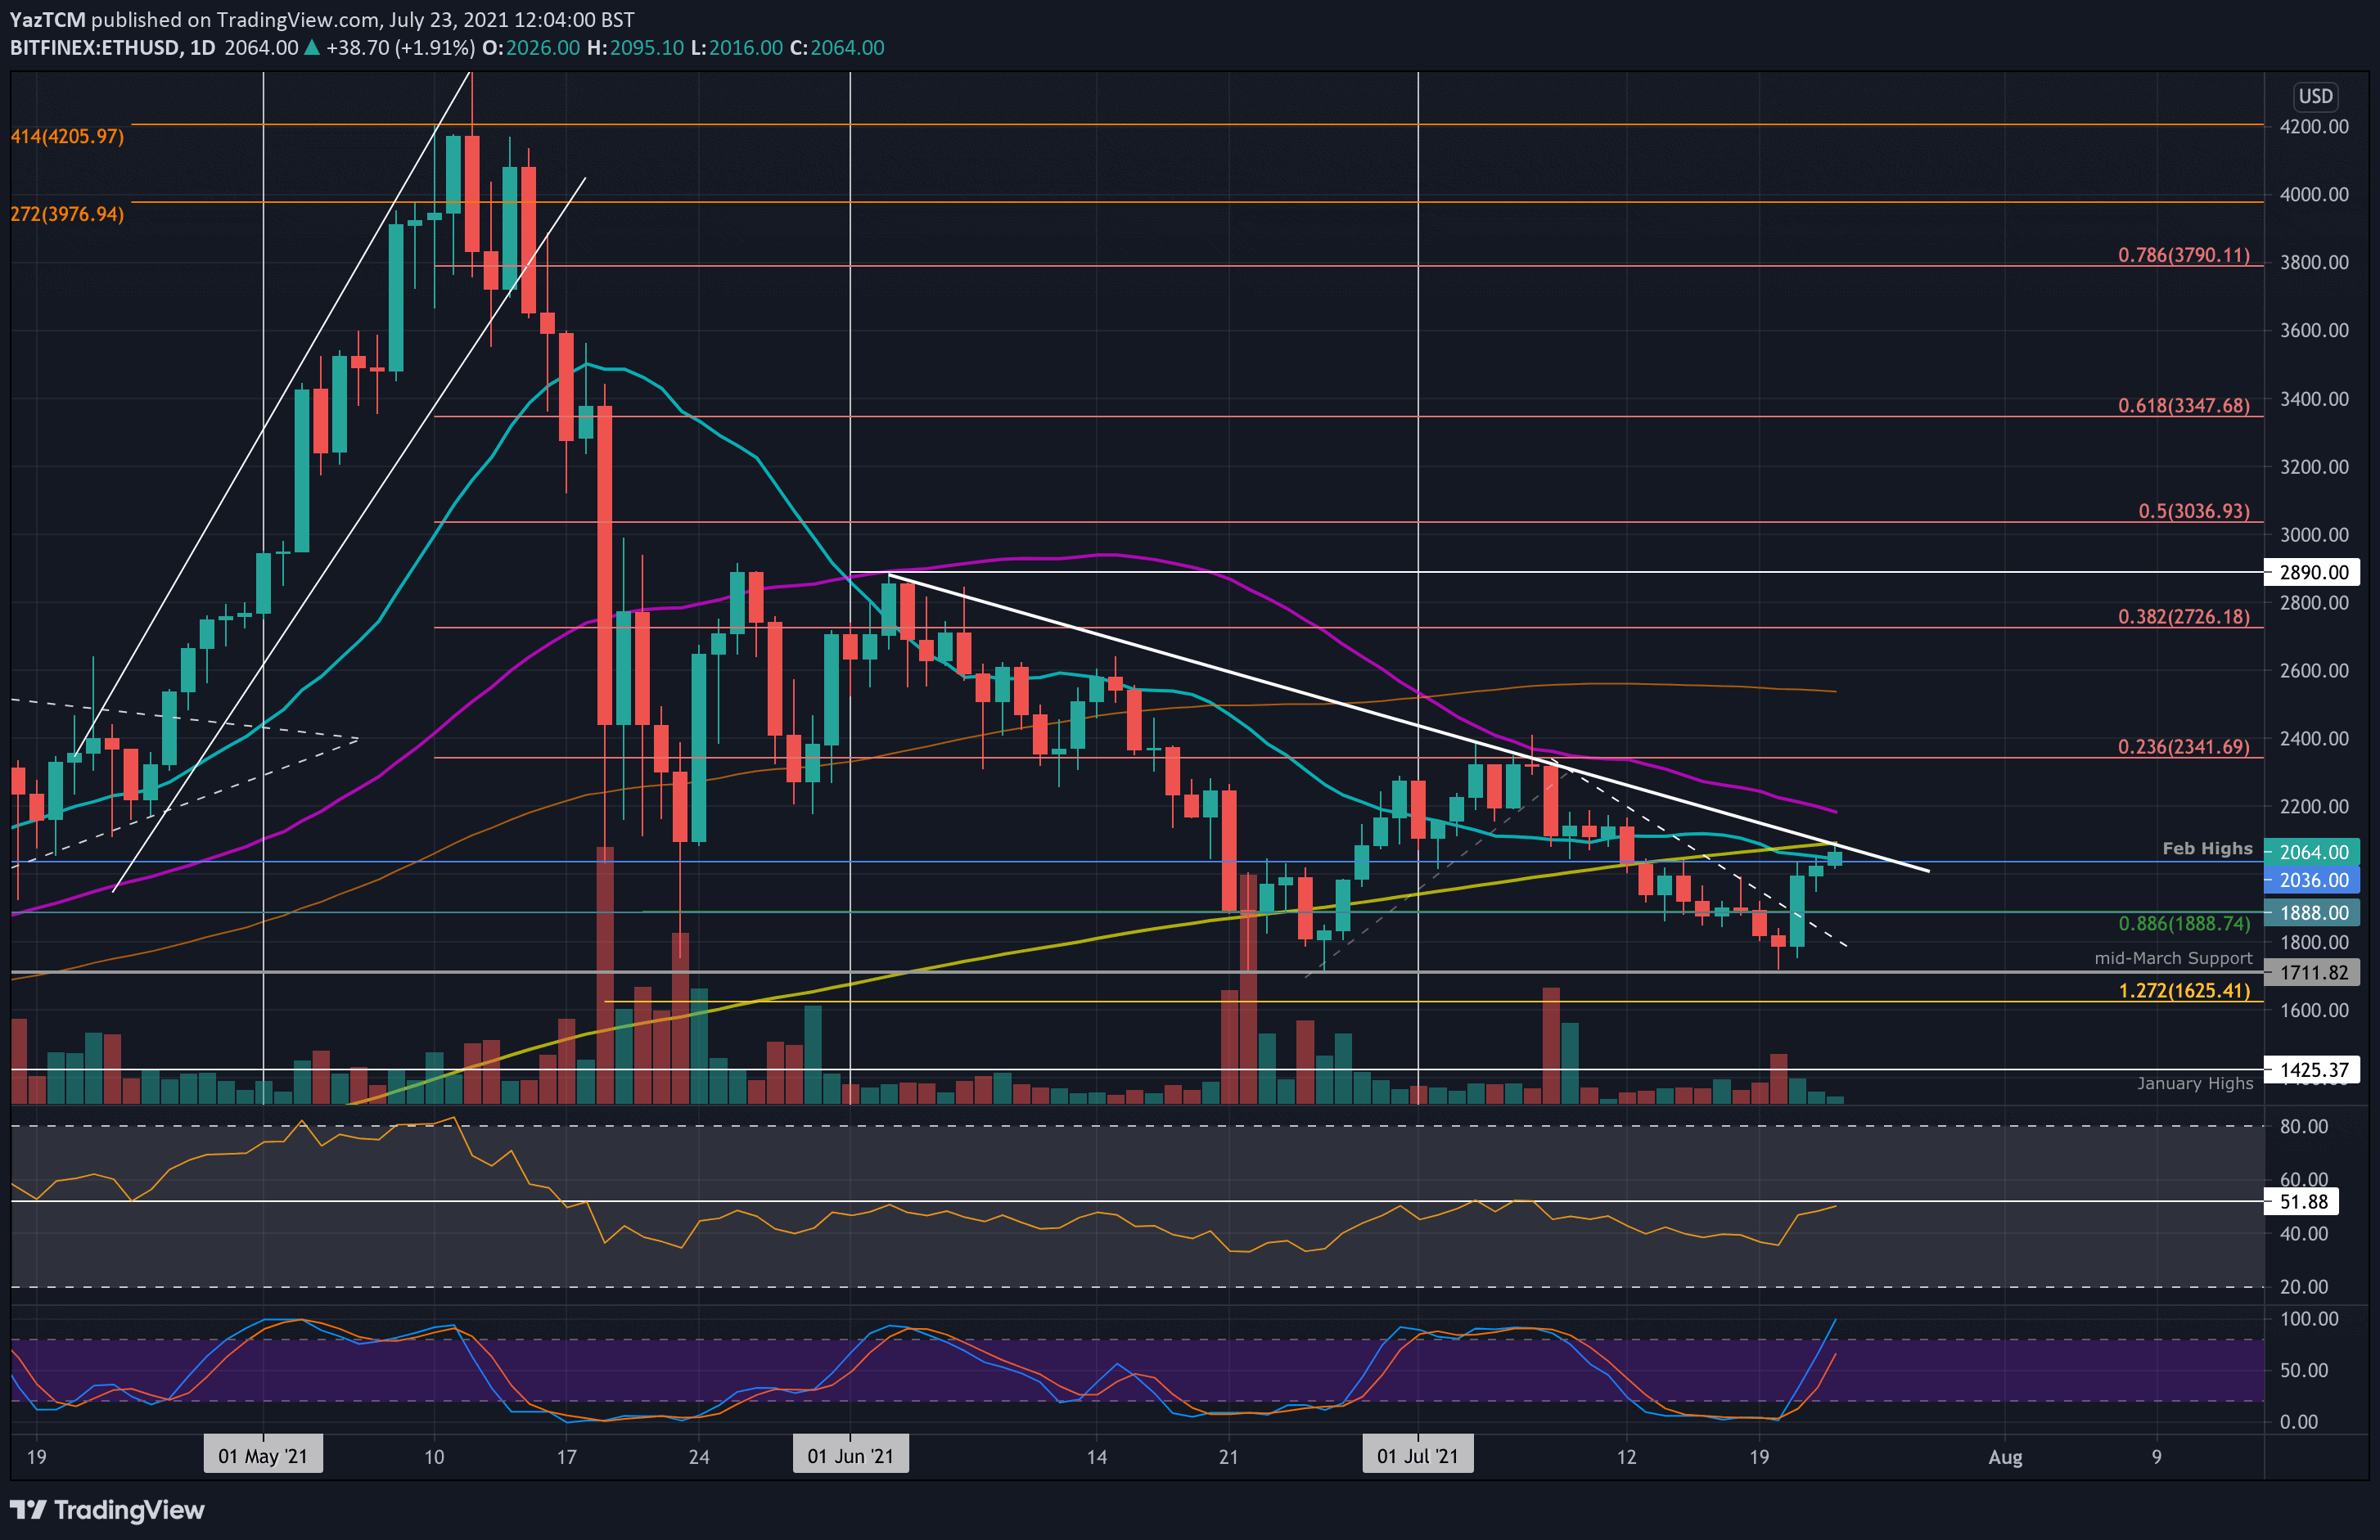
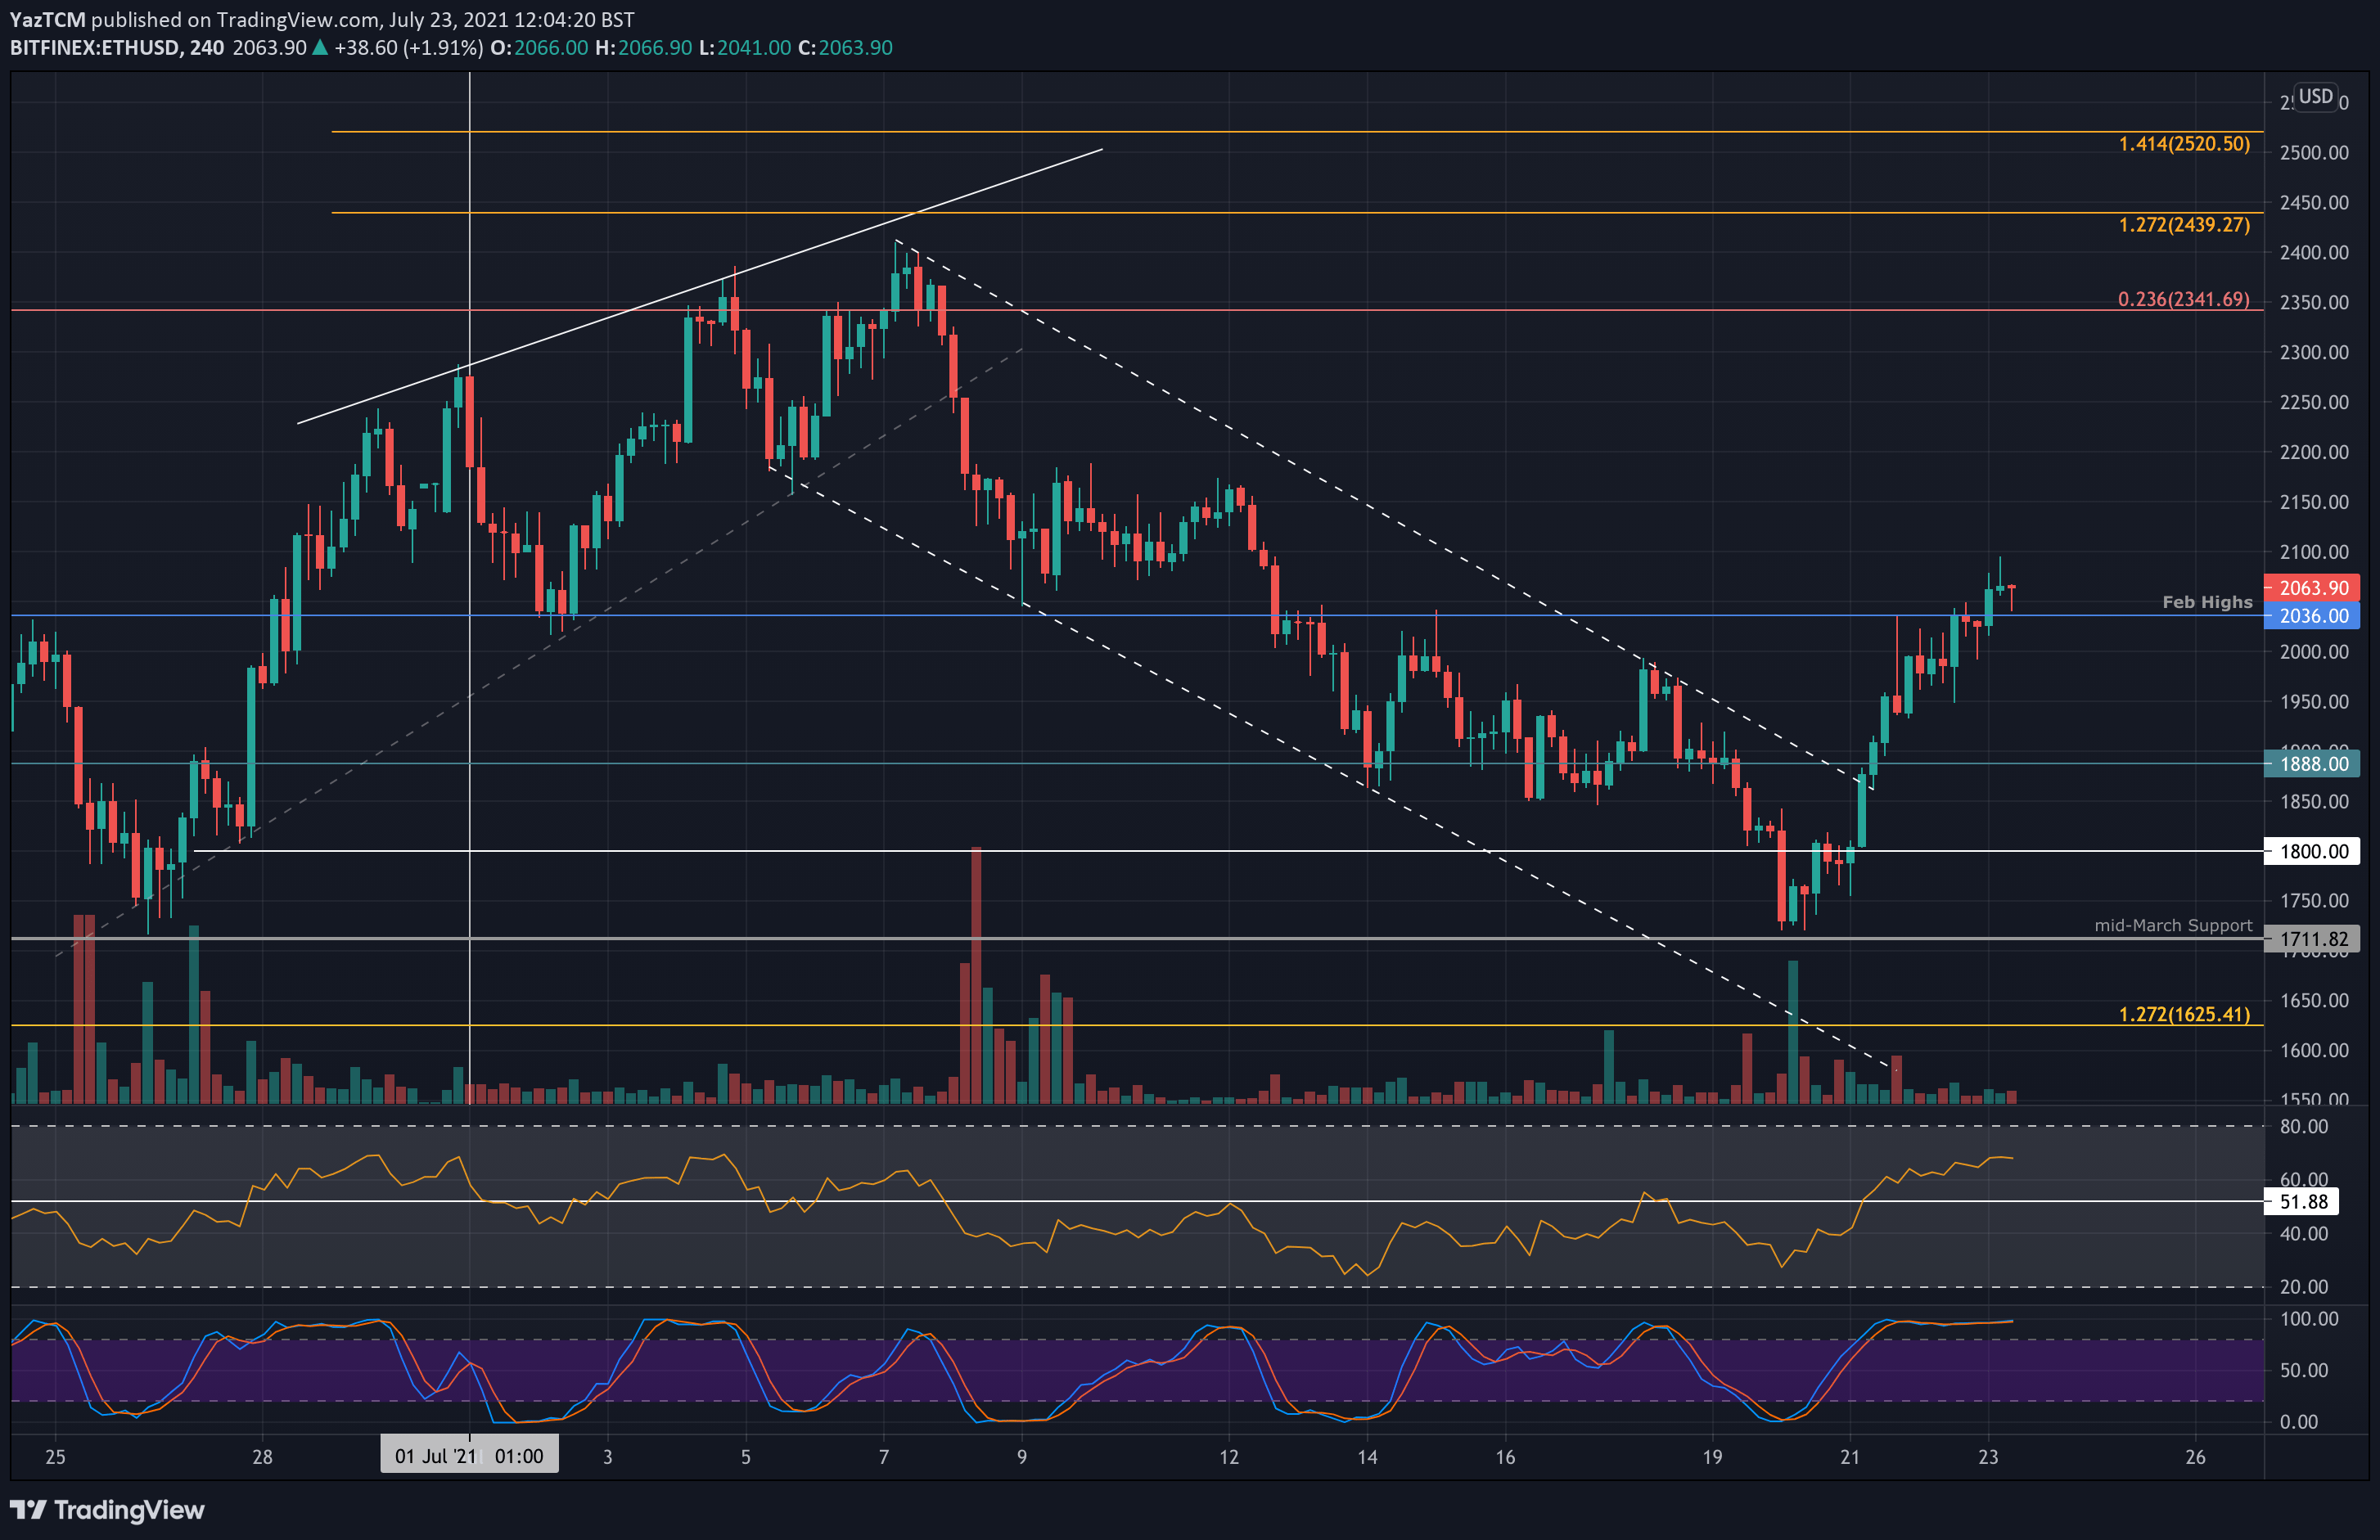
Ethereum saw a stronger 8.1% price hike this week as it breaks back above $2000. It was trading beneath $2000 at the start of the week and reached the June lows at $1710 on Tuesday.
ETH quickly rebounded from $1710 to break a short-term descending trend line on Wednesday. It is now above the 20-day MA and is testing resistance at the 200-day MA and the June descending trend line at $2100.
The short-term chart shows ETH breaking above the July descending price channel that it was trading inside, signaling a short-term potential bull push higher.
Looking ahead, if the buyers can break the combined resistance at $2100, added resistance lies at $2200 (50-day MA), $2340 (bearish .236 Fib & July resistance), $2400, and $2540 (100-day MA).
On the other side, the first strong support lies at $2000. This is followed by $1888, $1800, $1710 (June support), and $1625 (downside 1.272 Fib Extension).
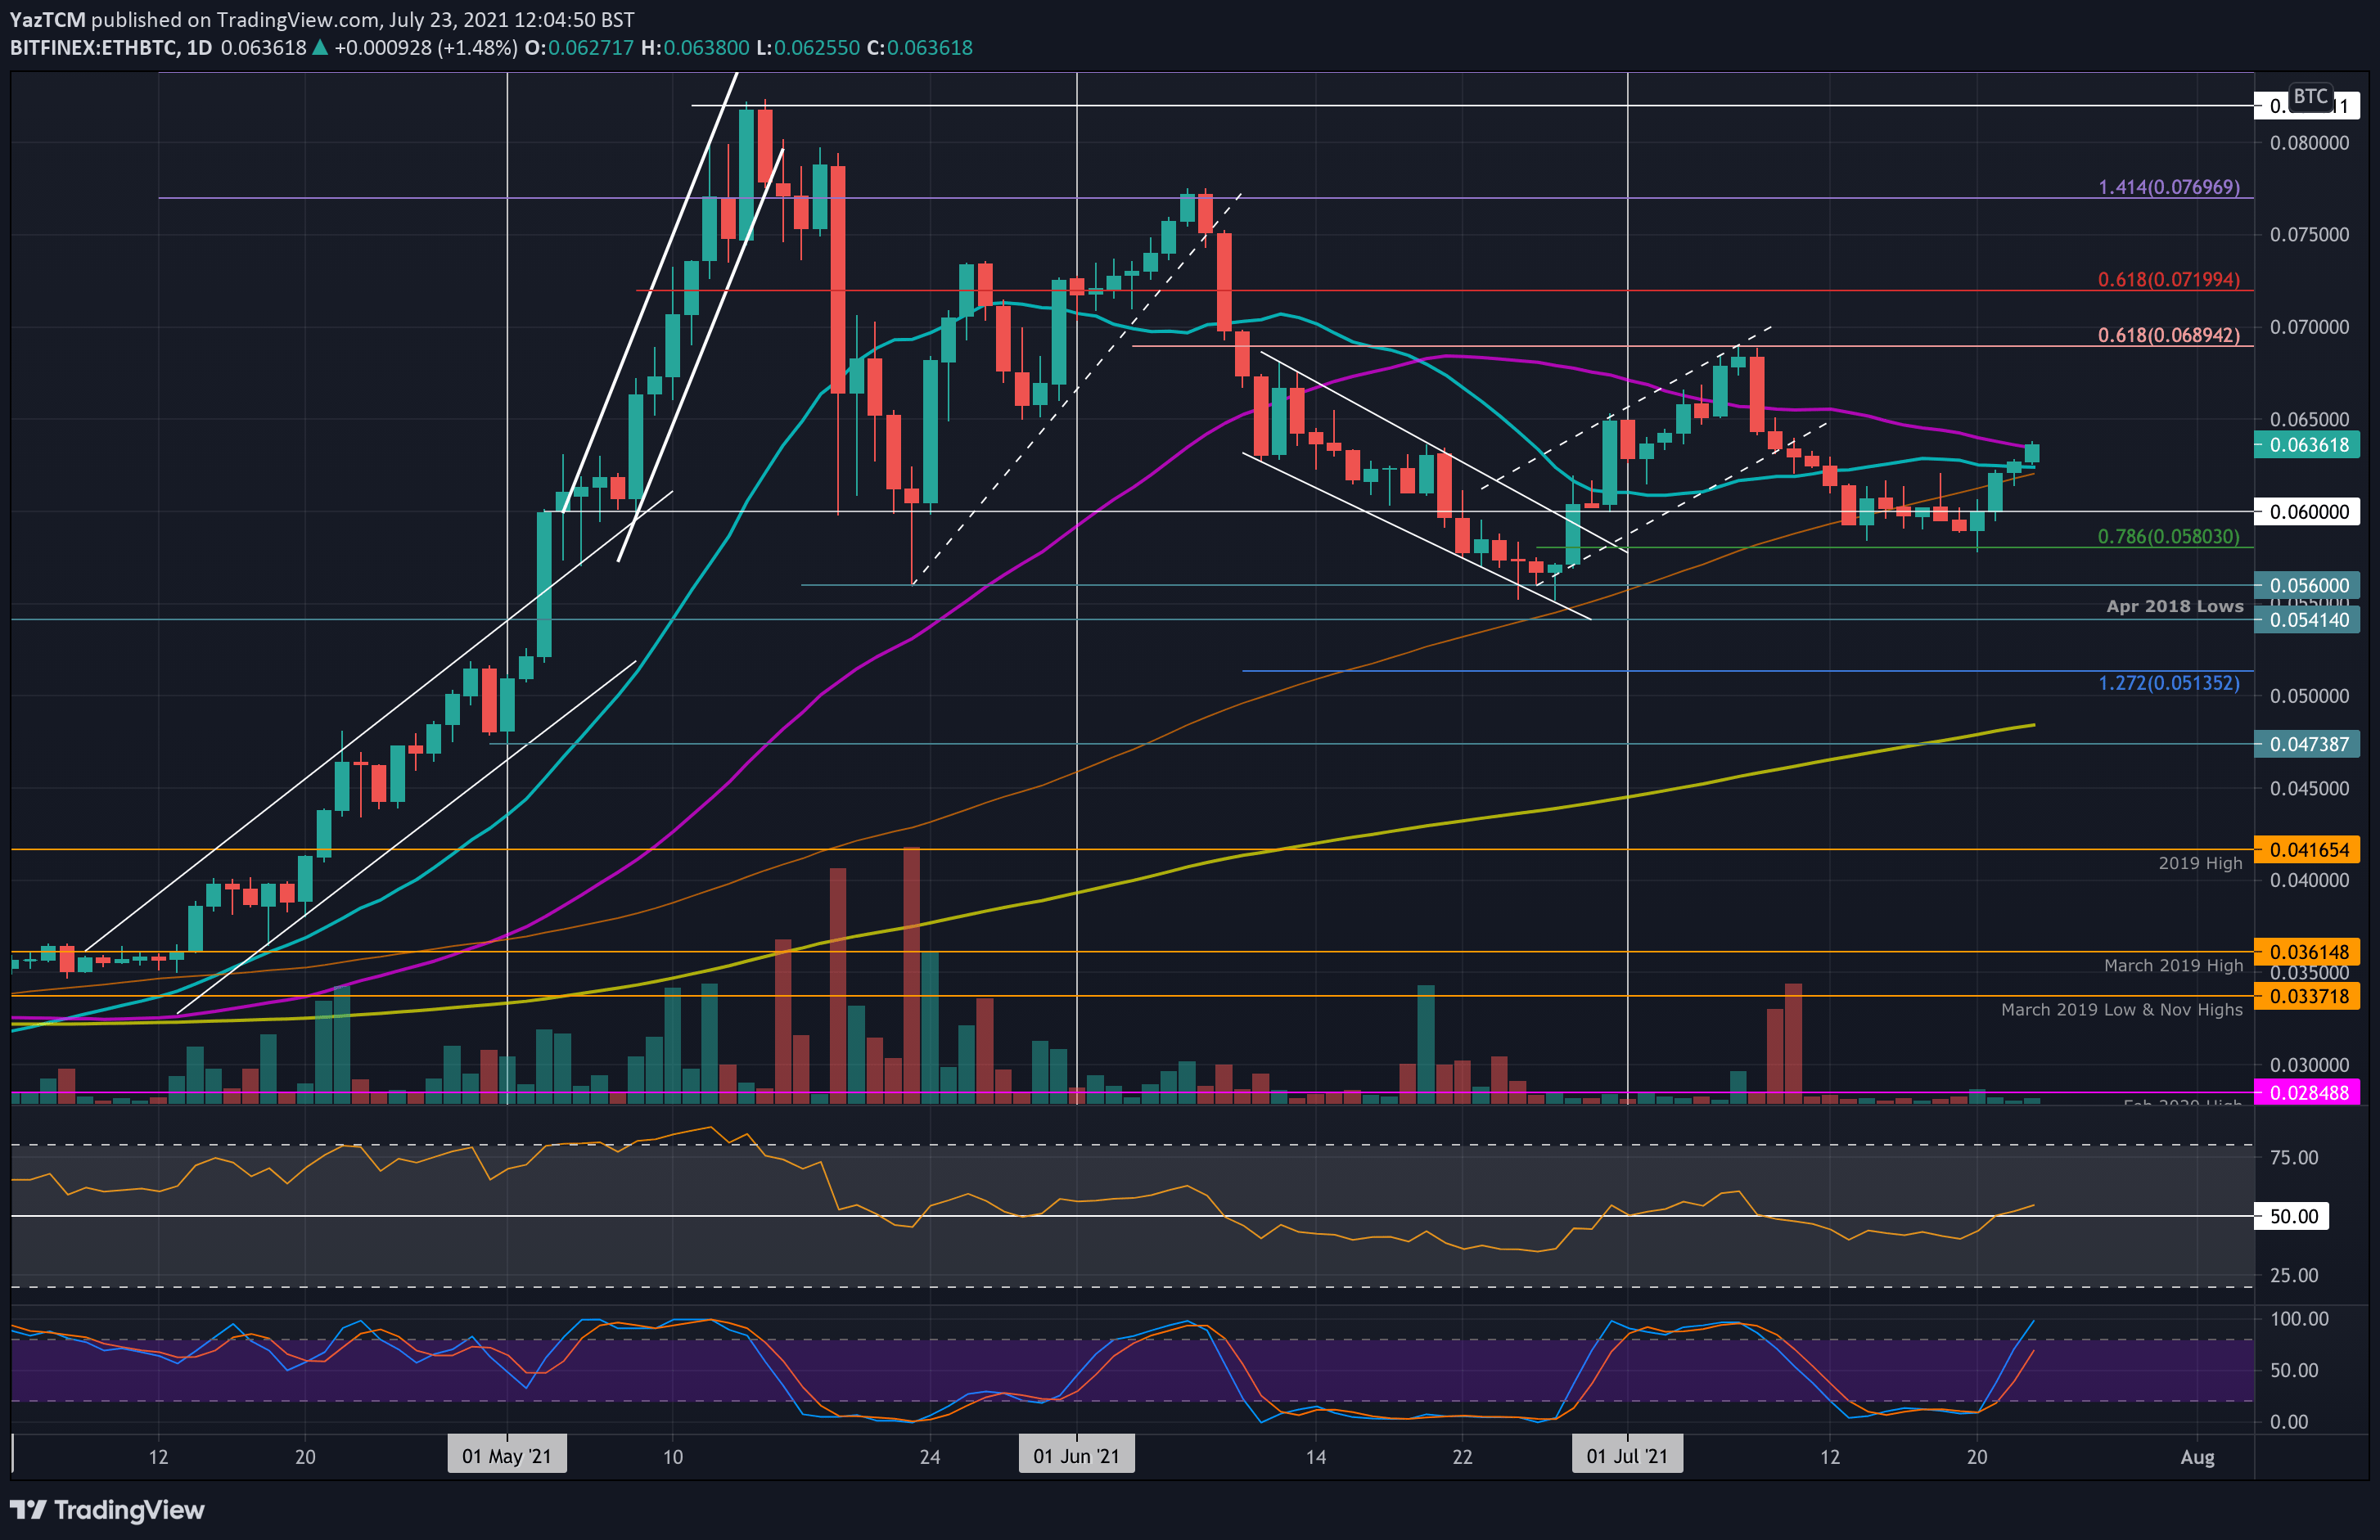
ETH managed to maintain support at 0.058 BTC (.786 Fib) during the price drop this week. From there, it quickly rebounded and broke back above 0.06 BTC on Wednesday. Yesterday, ETH continued to break the 20-day MA at 0.0625 BTC and is now testing the 50-day MA at 0.0635 BTC.
Looking ahead, the first resistance lies at 0.065 BTC. This is followed by 0.069 BTC (bearish .618 Fib), 0.07 BTC, and 0.072 BTC (long term bearish .618 Fib). Added resistance lies at 0.075 BTC and 0.077 BTC.
On the other side, the first support lies at the 20-day MA at 0.0625 BTC. This is followed by 0.06 BTC, 0.058 BTC (.786 Fib), and 0.056 BTC.
Ripple
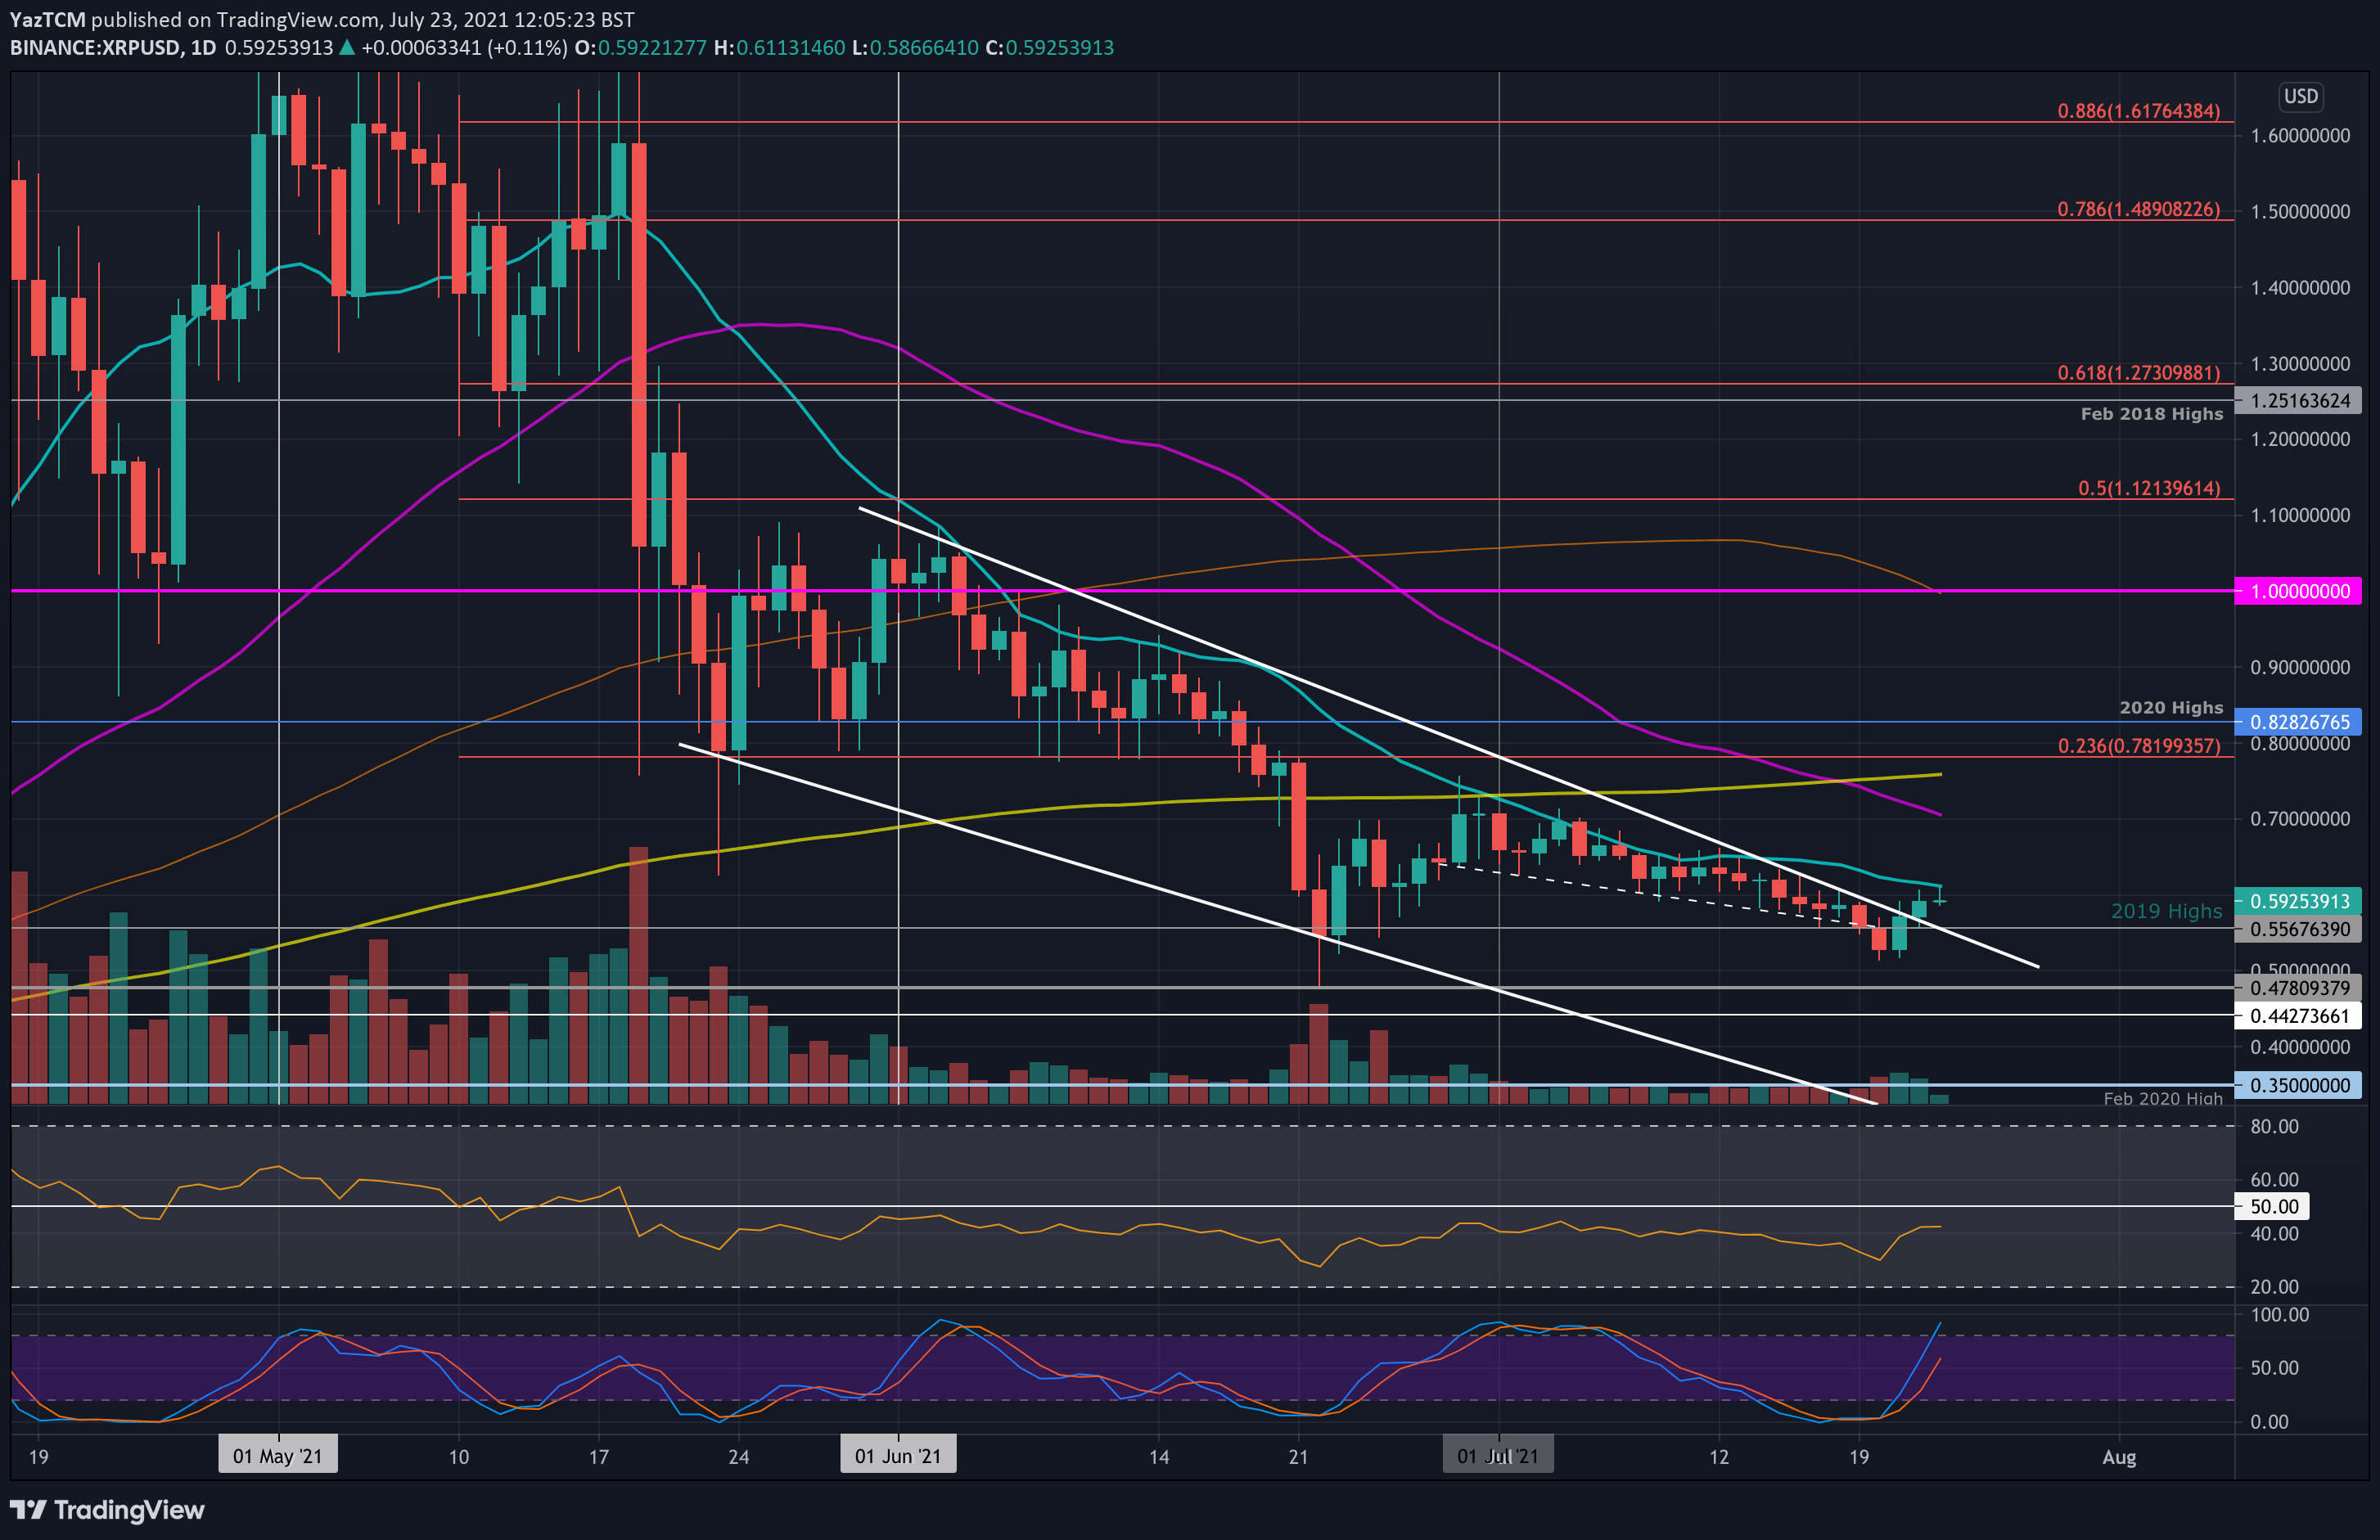
XRP is at $0.6, trading at the same price it was during the start of the week. The coin was inside the June descending price channel as the week started. It went on to drop beneath the 2019 highs at $0.556 on Tuesday to reach as low as $0.515.
From there, it quickly rebounded and pushed back above the 2019 high on Wednesday. Finally, yesterday, XRP managed to break above the June descending price channel and tested the 20-day MA today at around $0.612 (20-day MA).
Looking ahead, if the bulls break the 20-day MA, the first resistance lies at $0.7 (July highs & 50-day MA). This is followed by the resistance between $0.75 (200-day MA) and $0.78 (bearish .236 Fib). Finally, added resistance is found at $0.82 (2020 highs) and $0.9.
On the other side, the first support lies at the 2019 highs at $0.556. This is followed by $0.515 (weekly low), $0.5, $0.478, and $0.442.
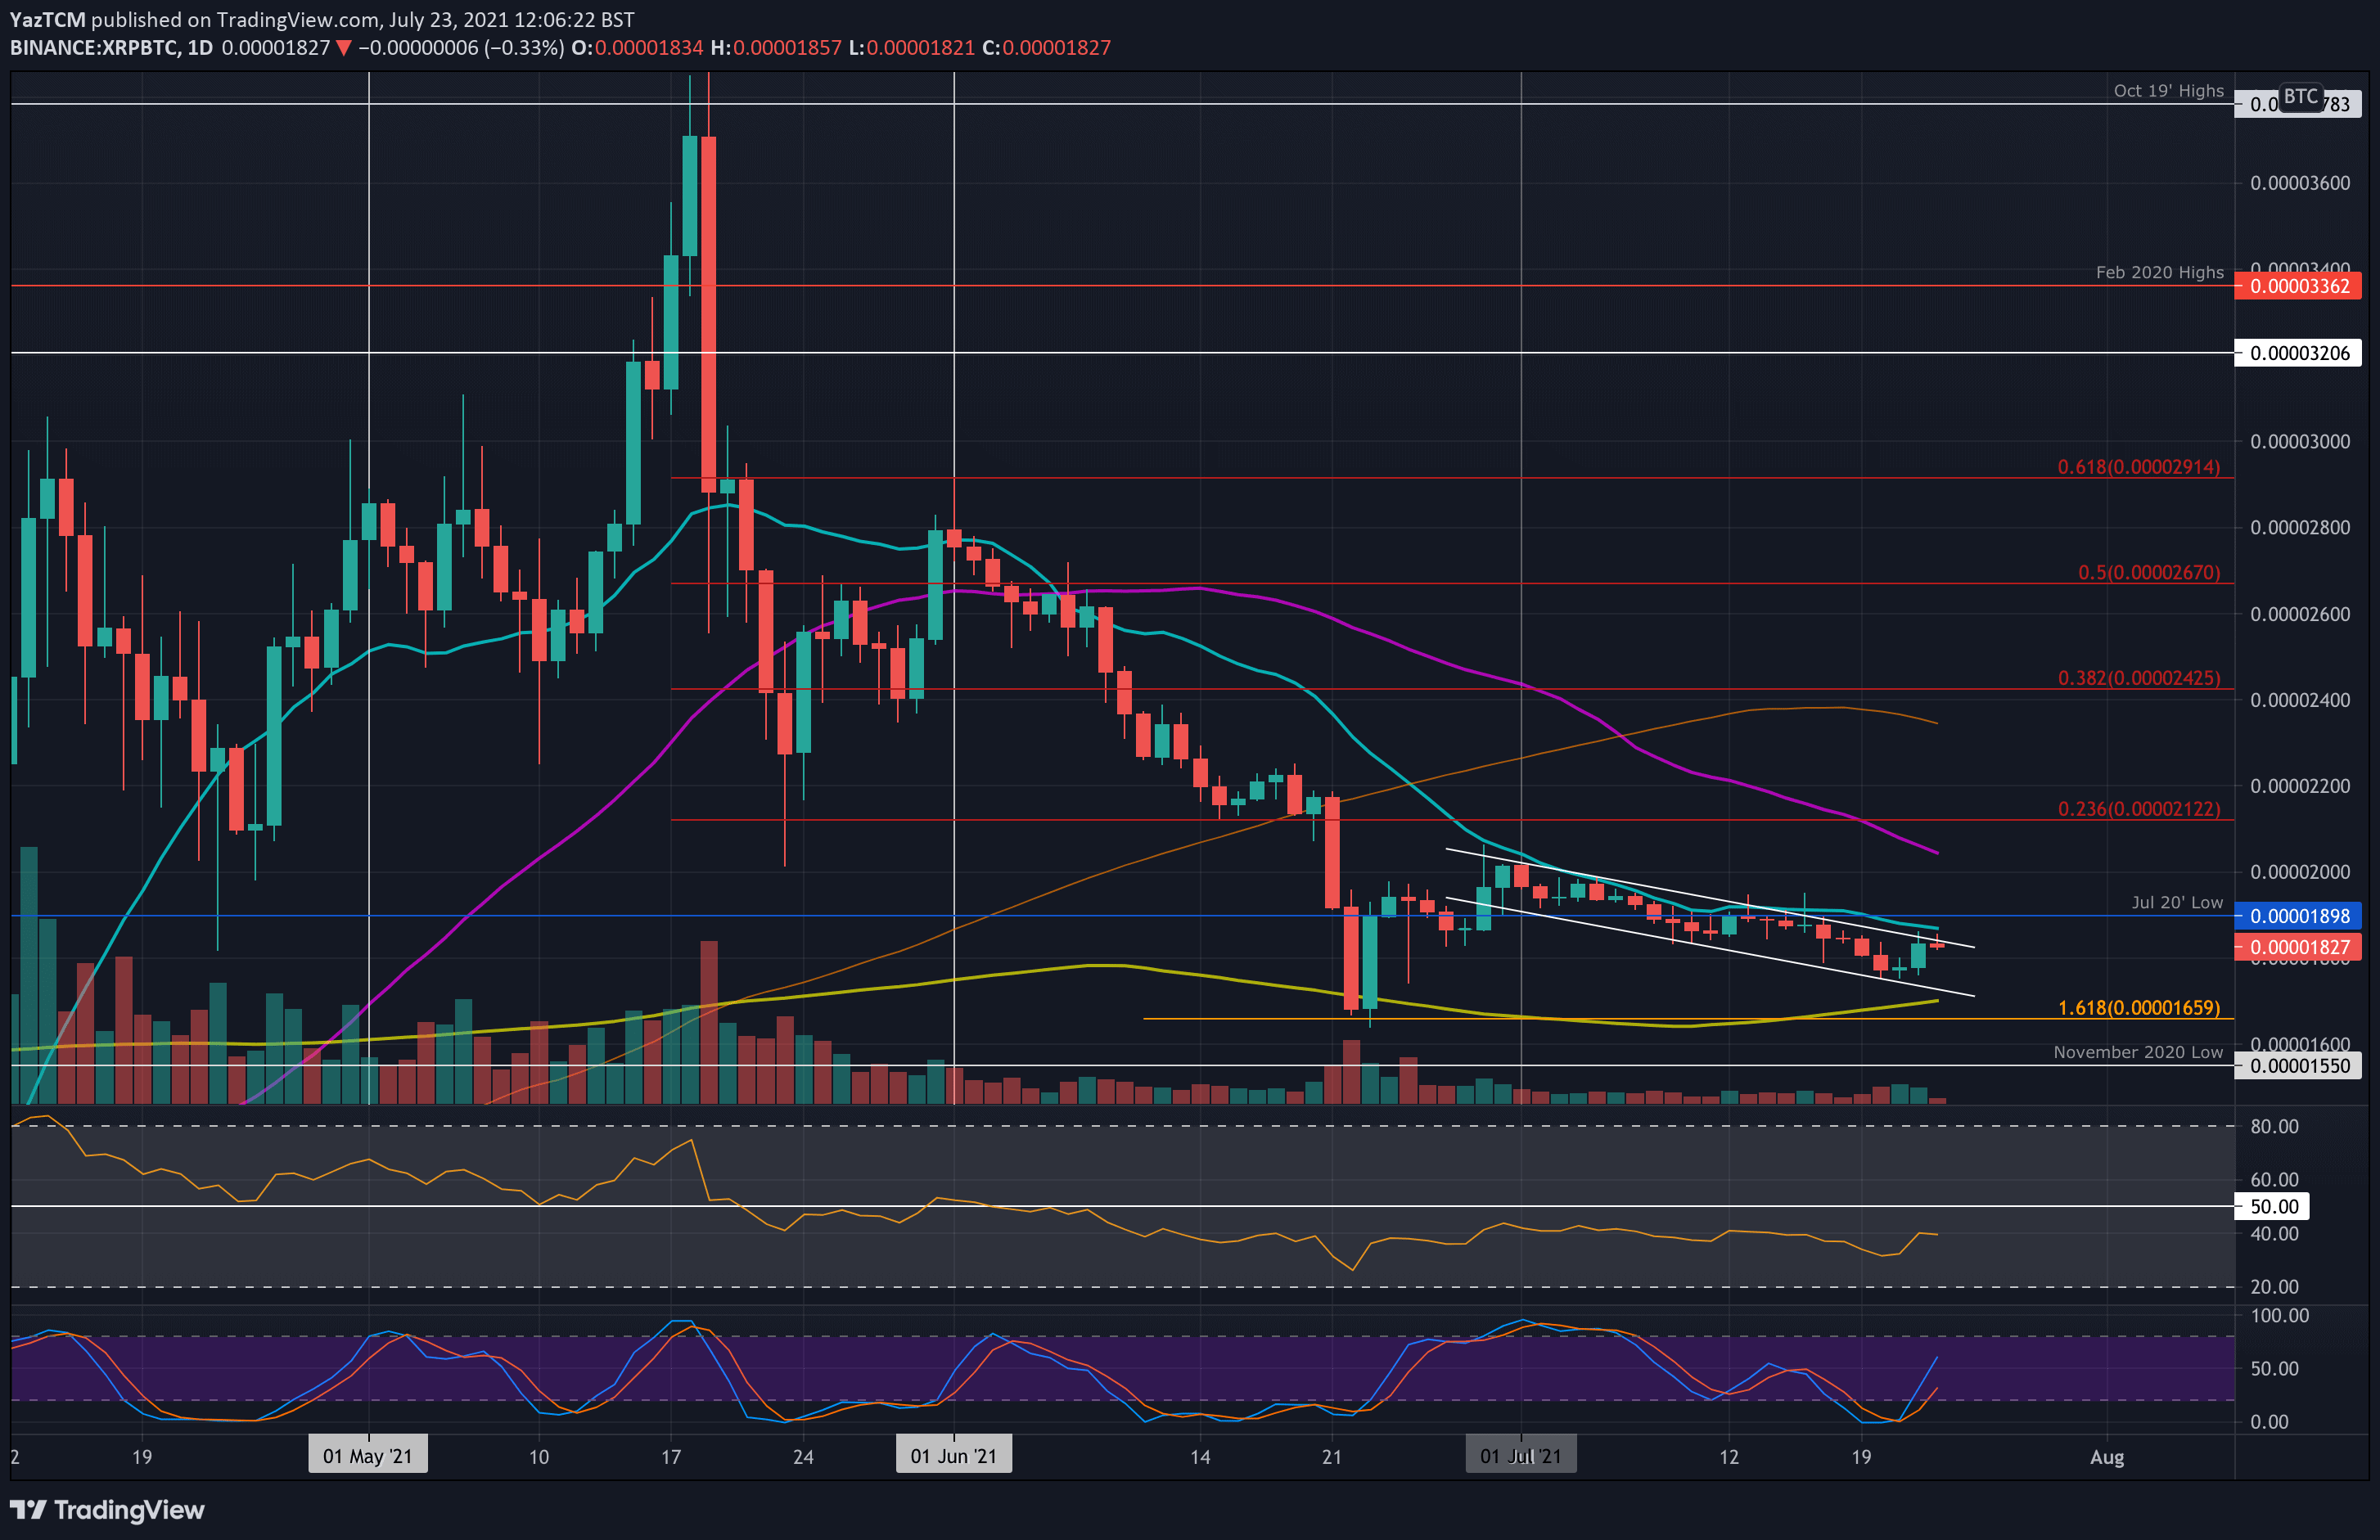
XRP has been trading inside a descending price channel since the start of June against BTC. The coin dropped beneath 1800 SAT this week but found support at the lower boundary of 1750 SAT. It since rebounded from there and is testing the upper boundary of the price channel today.
Looking ahead, if the bulls can break above the price channel, the first resistance lies at 1900 SAT (July 2020 low & 20-day MA). This is followed by 2000 SAT, 2050 SAT (50-day MA), and 2100 SAT (bearish .236 Fib).
On the other side, the first support lies at 1800 SAT. This is followed by 1750 SAT (lower angle of the price channel), 1700 SAT (200-day MA), and 1660 SAT (downside 1.618 Fib Extension).
Cardano
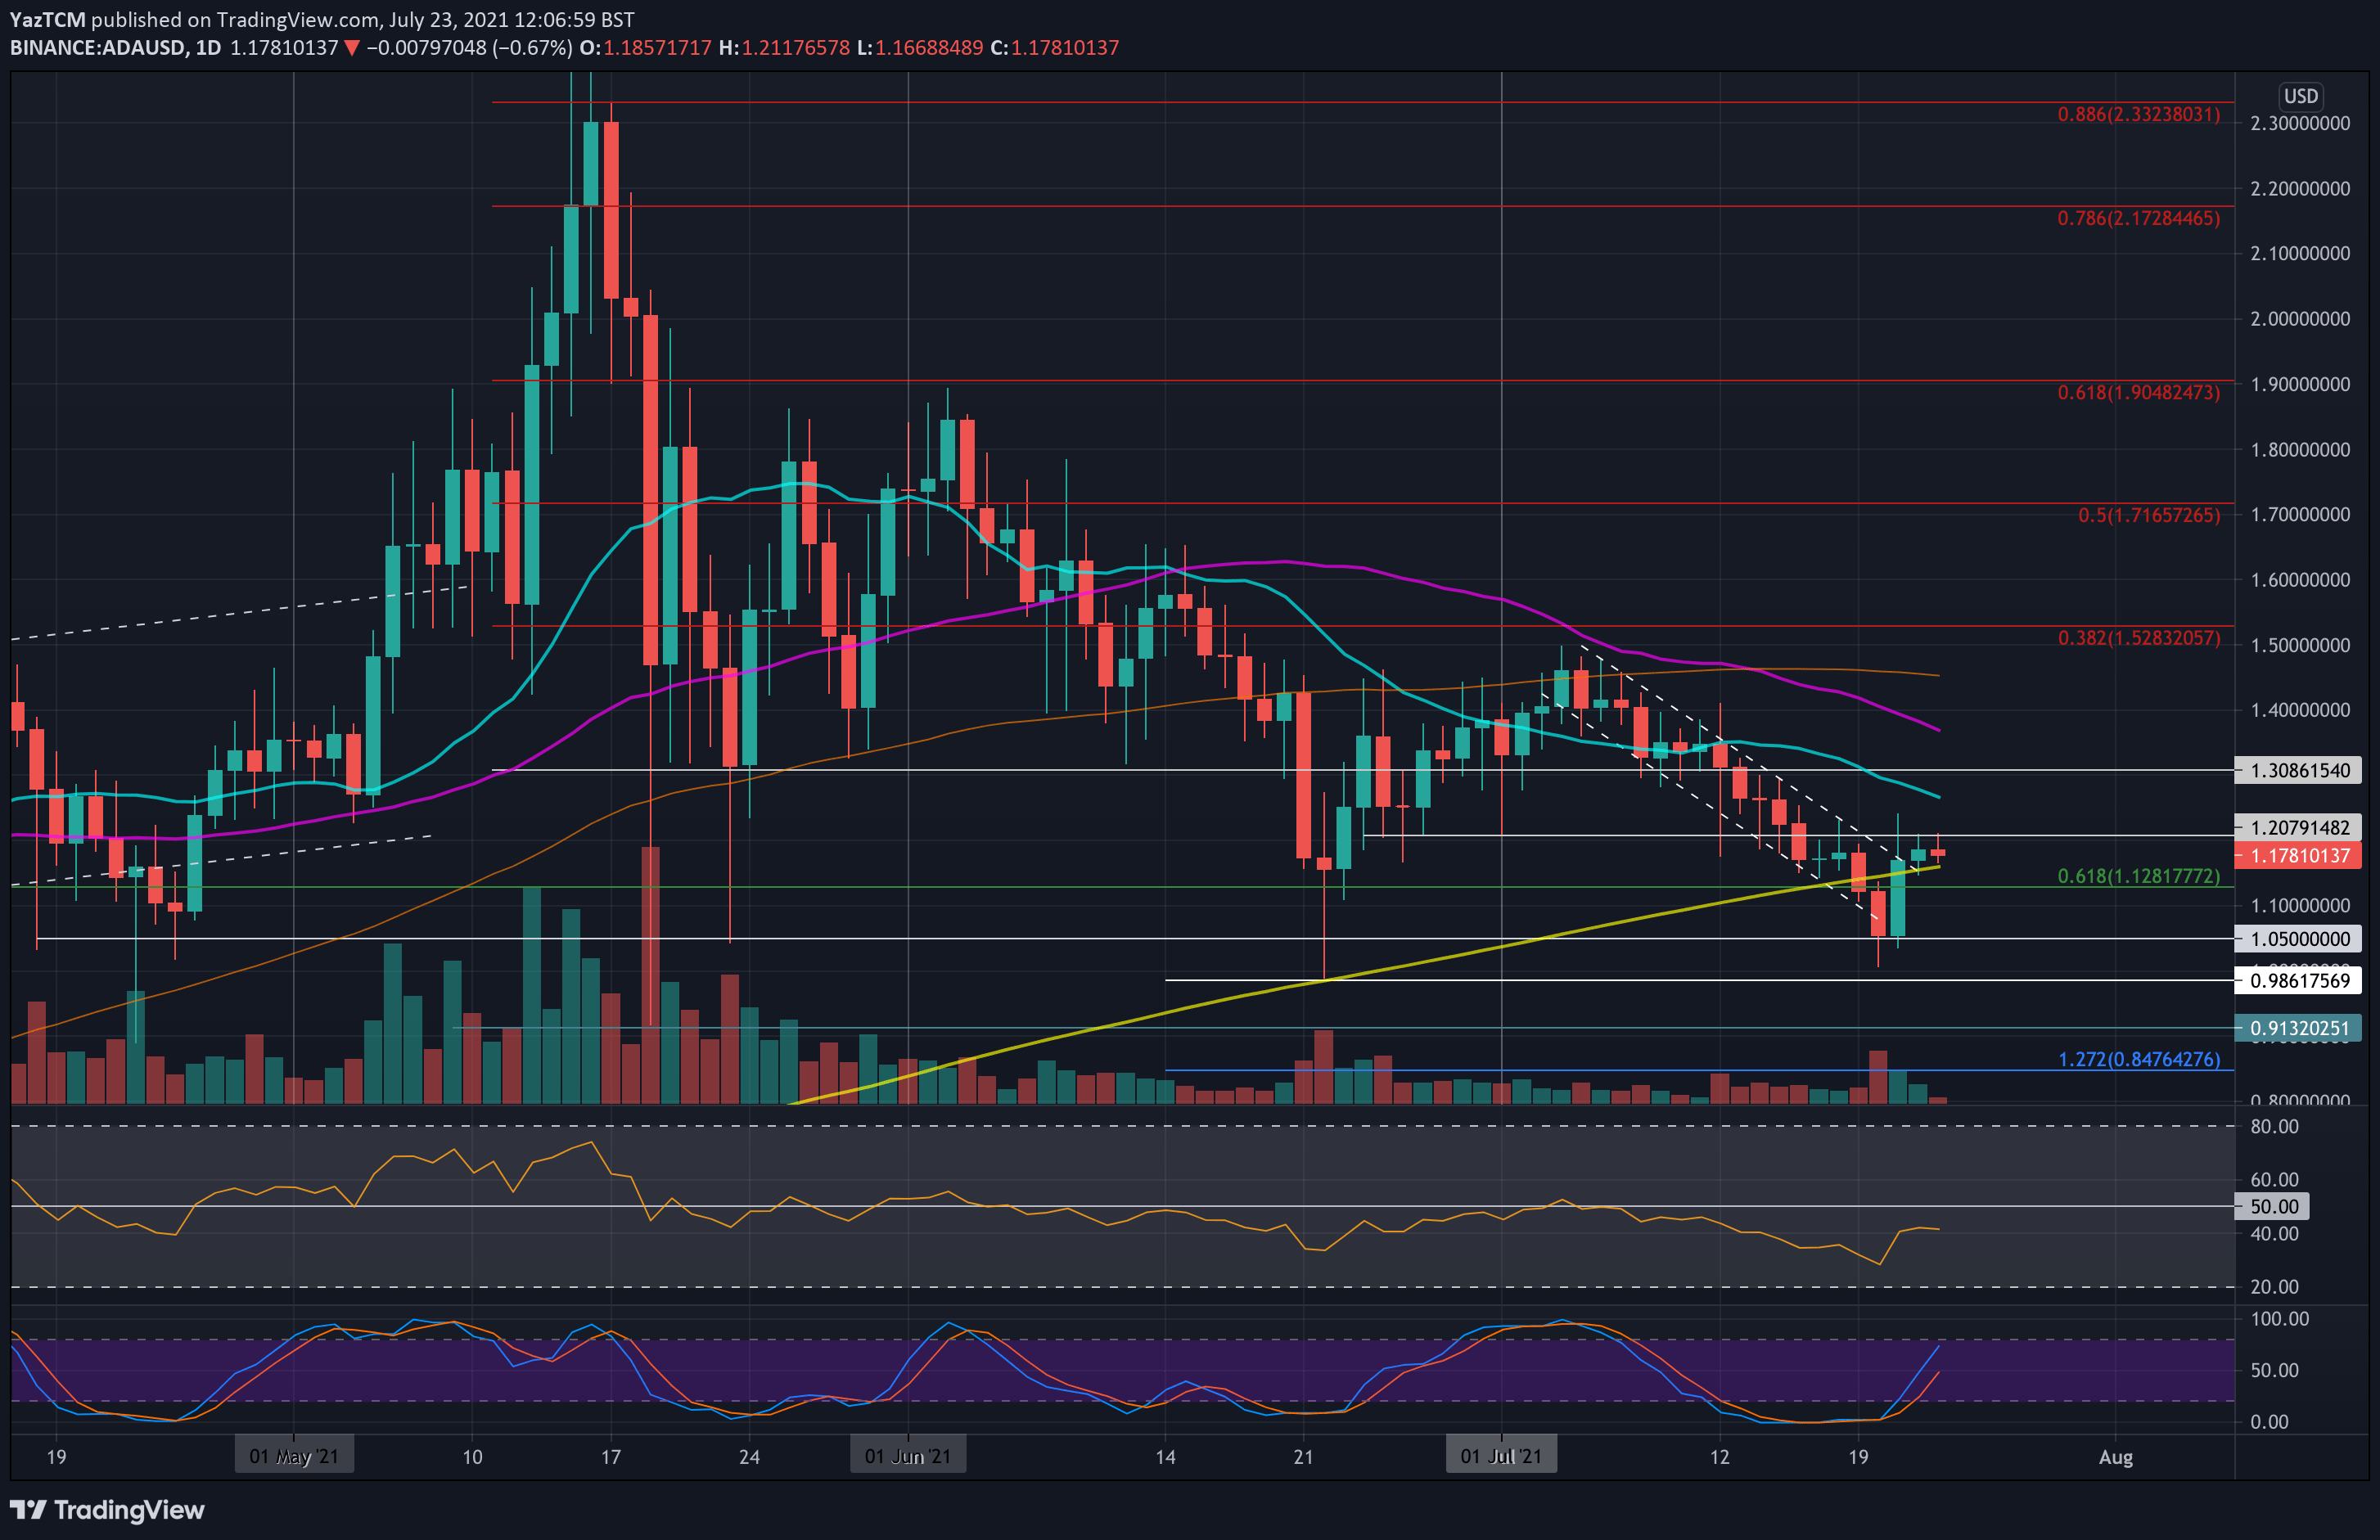
ADA saw a small 4% price fall this week as it battles with resistance at $1.20. The coin started the week above $1.20 as it was trading inside a descending price channel. On Tuesday, the coin fell beneath the price channel, reaching as low as $1.00. Luckily, it closed the daily candle at $1.05 and rebounded higher from there on Wednesday.
Yesterday, ADA managed to break above the price channel as it sat above the 200-day MA at around $1.15. However, it is now struggling with the $1.20 resistance level.
Looking ahead, if the buyers break $1.20, the first resistance lies at $1.26 (20-day MA). This is followed by $1.30, $1.37 (50-day MA), $1.45 (100-day MA), and $1.50 (bearish .382 Fib & July highs).
On the other side, the first lies at $1.15 (200-day MA). This is followed by $1.10, $1.05, and $1.00. Finally, beneath $1, added support is found at $0.98 (June low) and $0.91.
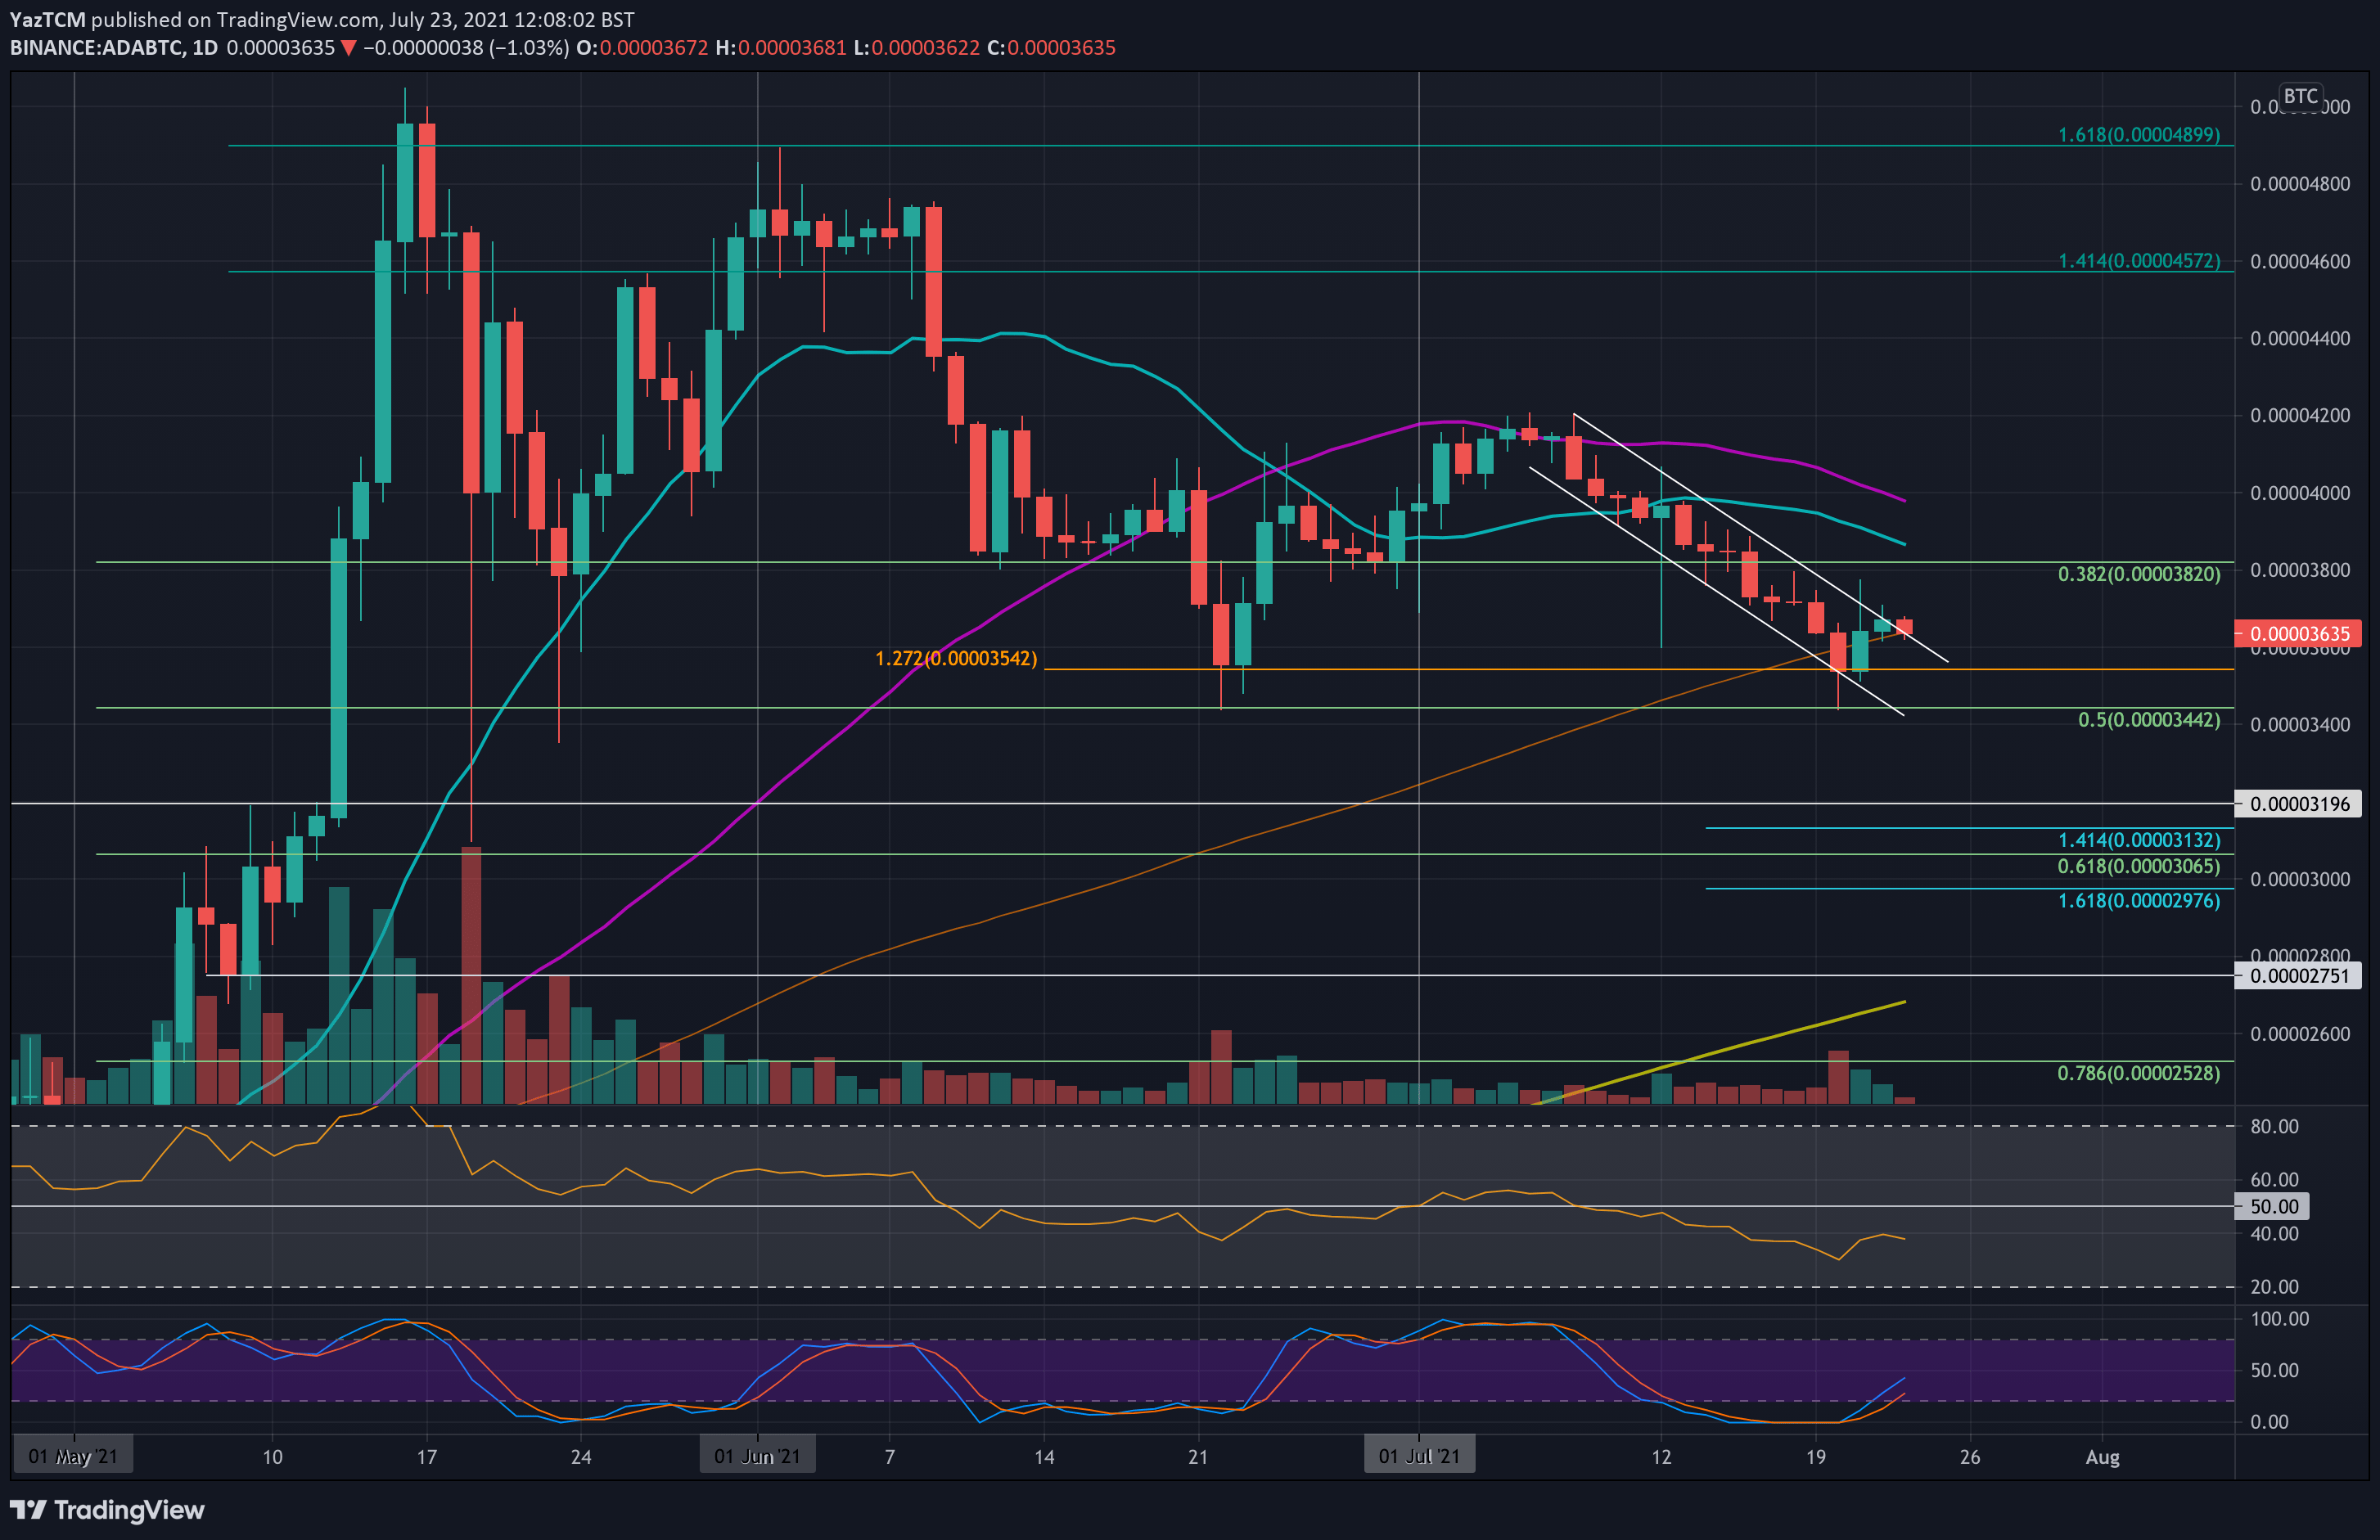
Against BTC, ADA is also trading inside a descending price channel. The coin spiked beneath the channel this week to reach the support at 3440 SAT (.5 Fib) but managed to close the daily candle above the lower angle at 3540 SAT.
It has since rebounded back above the 100-day MA and is attempting to push above the descending price channel today.
Looking ahead, the first resistance toward the upside lies at 3820 SAT (late June support). This is followed by 3870 SAT (20-day MA), 4000 SAT (50-day MA), and 4200 SAT (July highs).
On the other side, the first support lies at 3630 SAT (100-day MA). This is followed by 3540 SAT, 3440 SAT (.5 Fib), and 3200 SAT.
Polygon
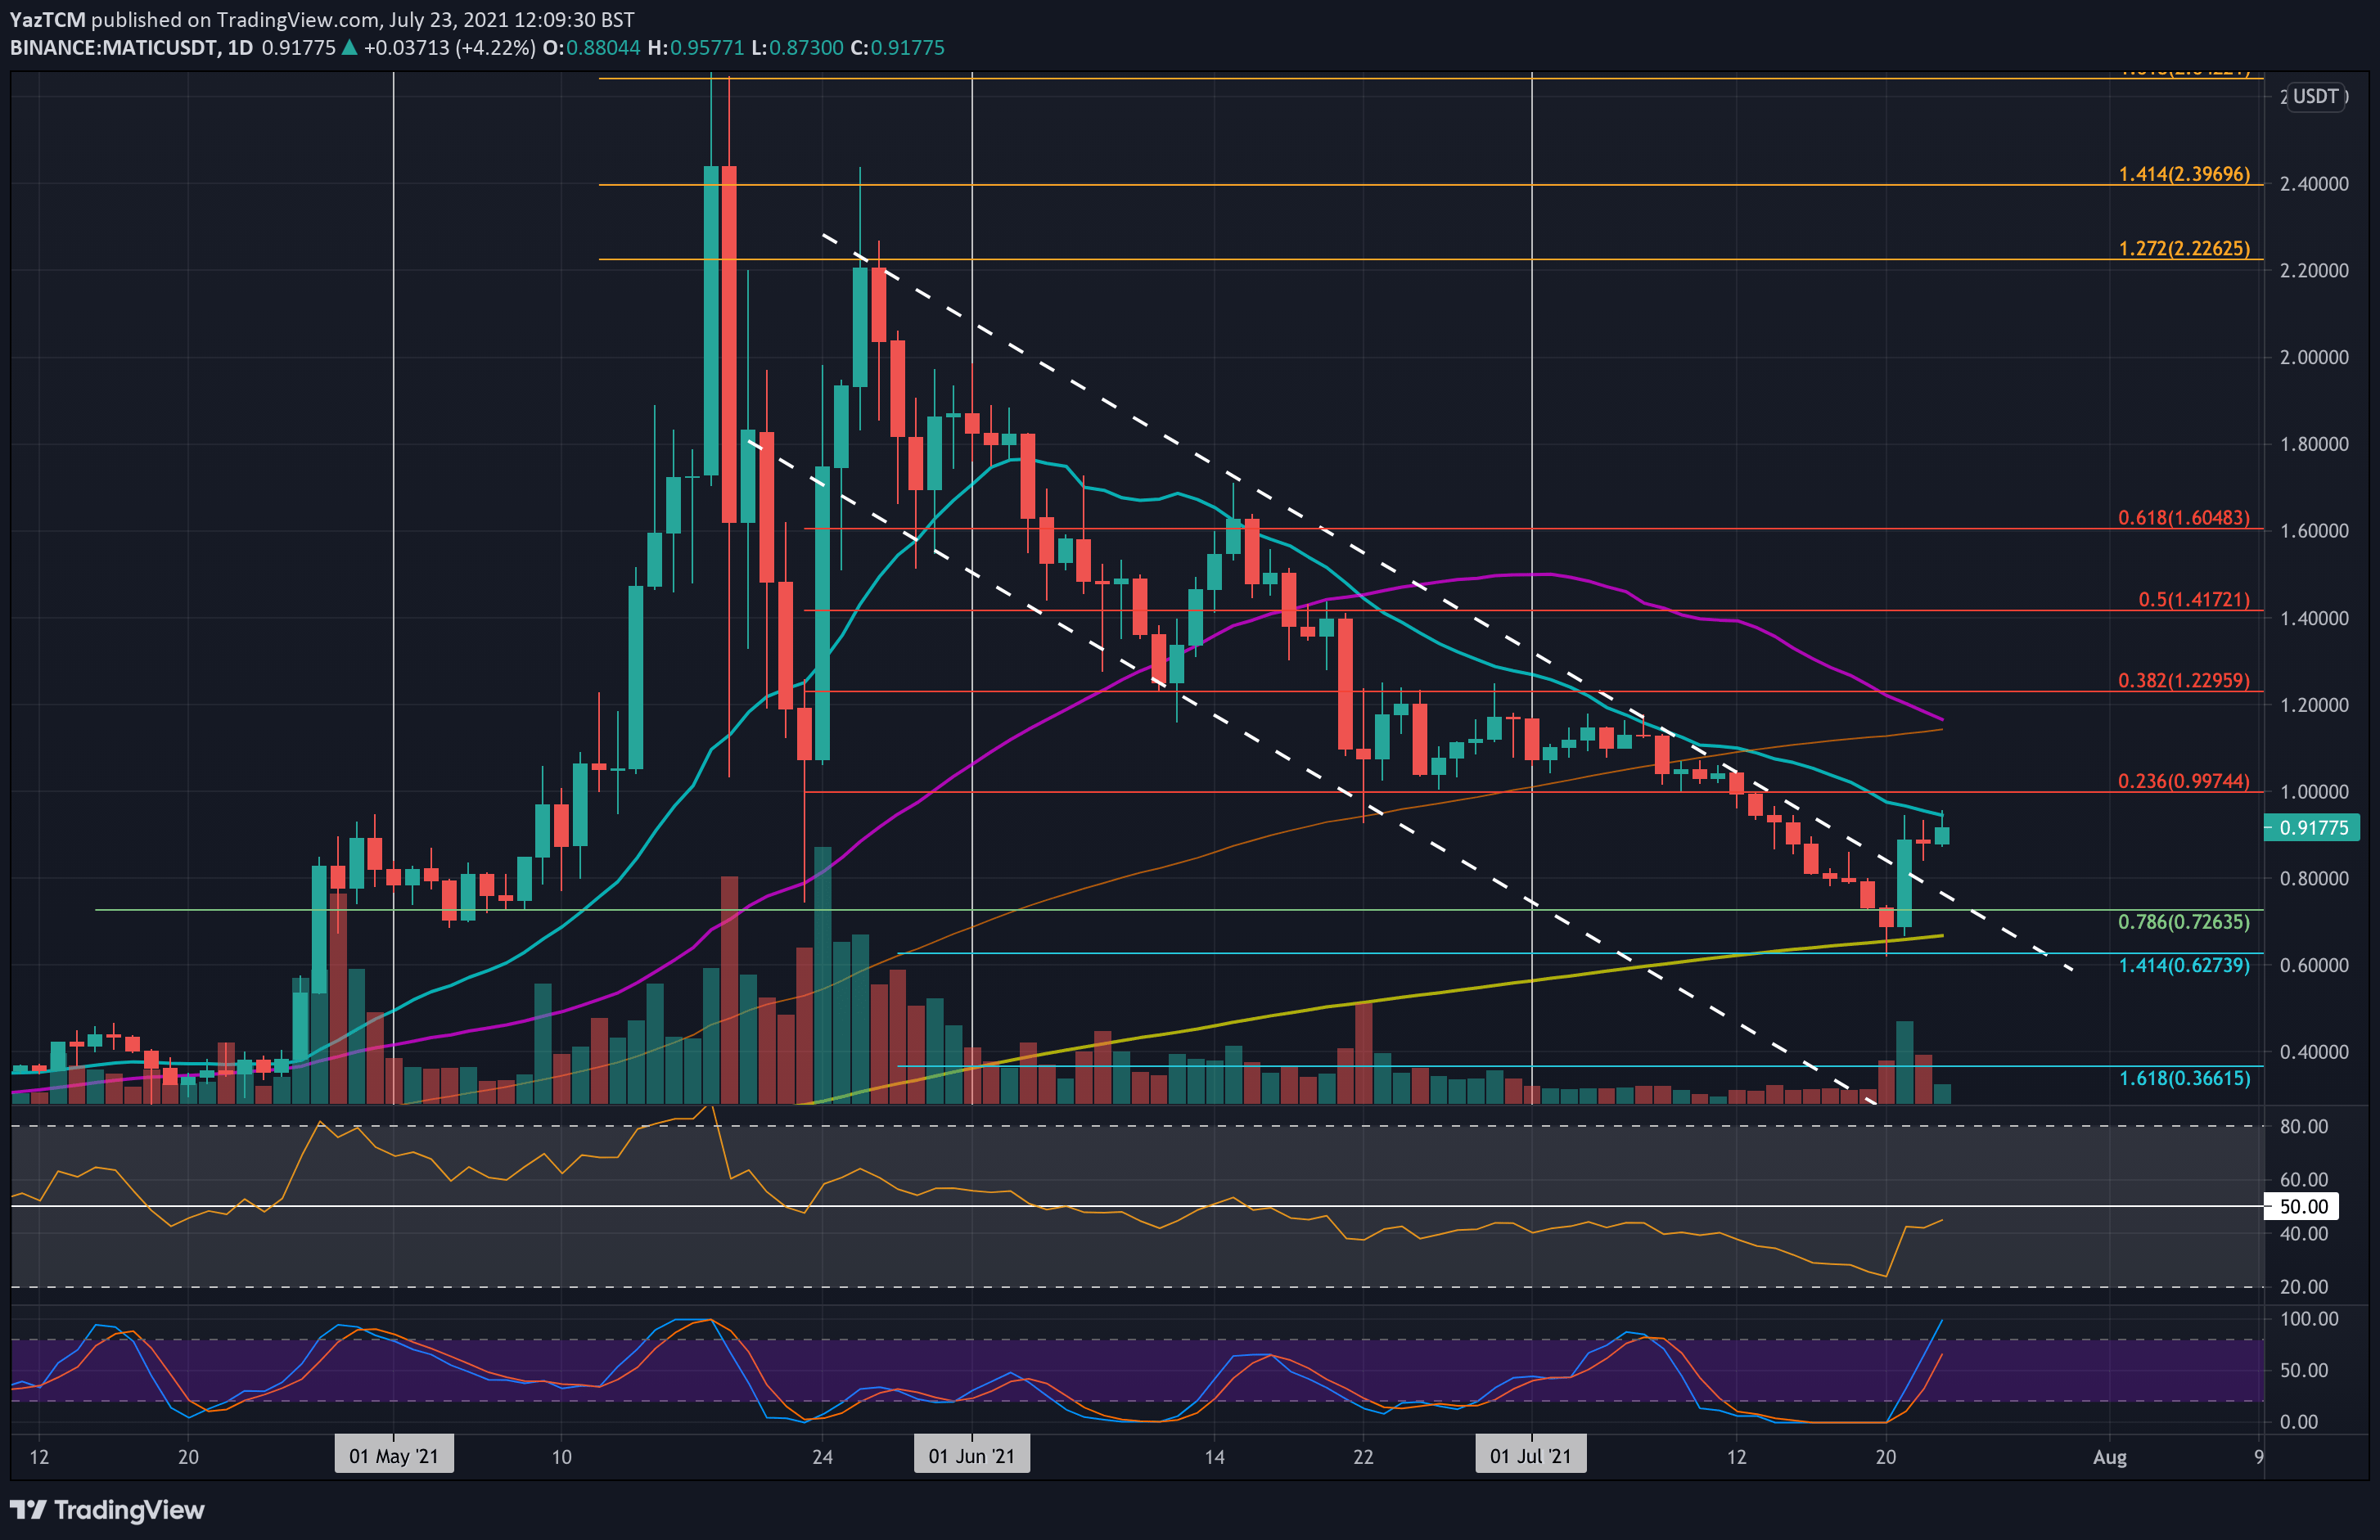
MATIC is up by a strong 5% this week as the coin trades above $0.91. MATIC was trading inside a long-term descending price channel at the start of the week and dropped as low as $0.6 on Tuesday, finding the 200-day MA support.
On Wednesday, MATIC quickly rebounded and managed to break the above the descending price channel, signaling a potential bullish move higher. However, it is now battling resistance at around $0.92, provided by the 20-day MA.
Looking ahead, if the bulls break the 20-day MA, the first resistance lies at $1.00 (bearish .236 Fib). This is followed by $1.15 (100-day MA & 50-day MA), $1.22 (bearish .382 Fib), and $1.42 (bearish .5 Fib).
On the other side, the first support lies at $0.8. This is followed by $0.726 (.86 Fib), $0.67 (200-day MA), and $0.6.
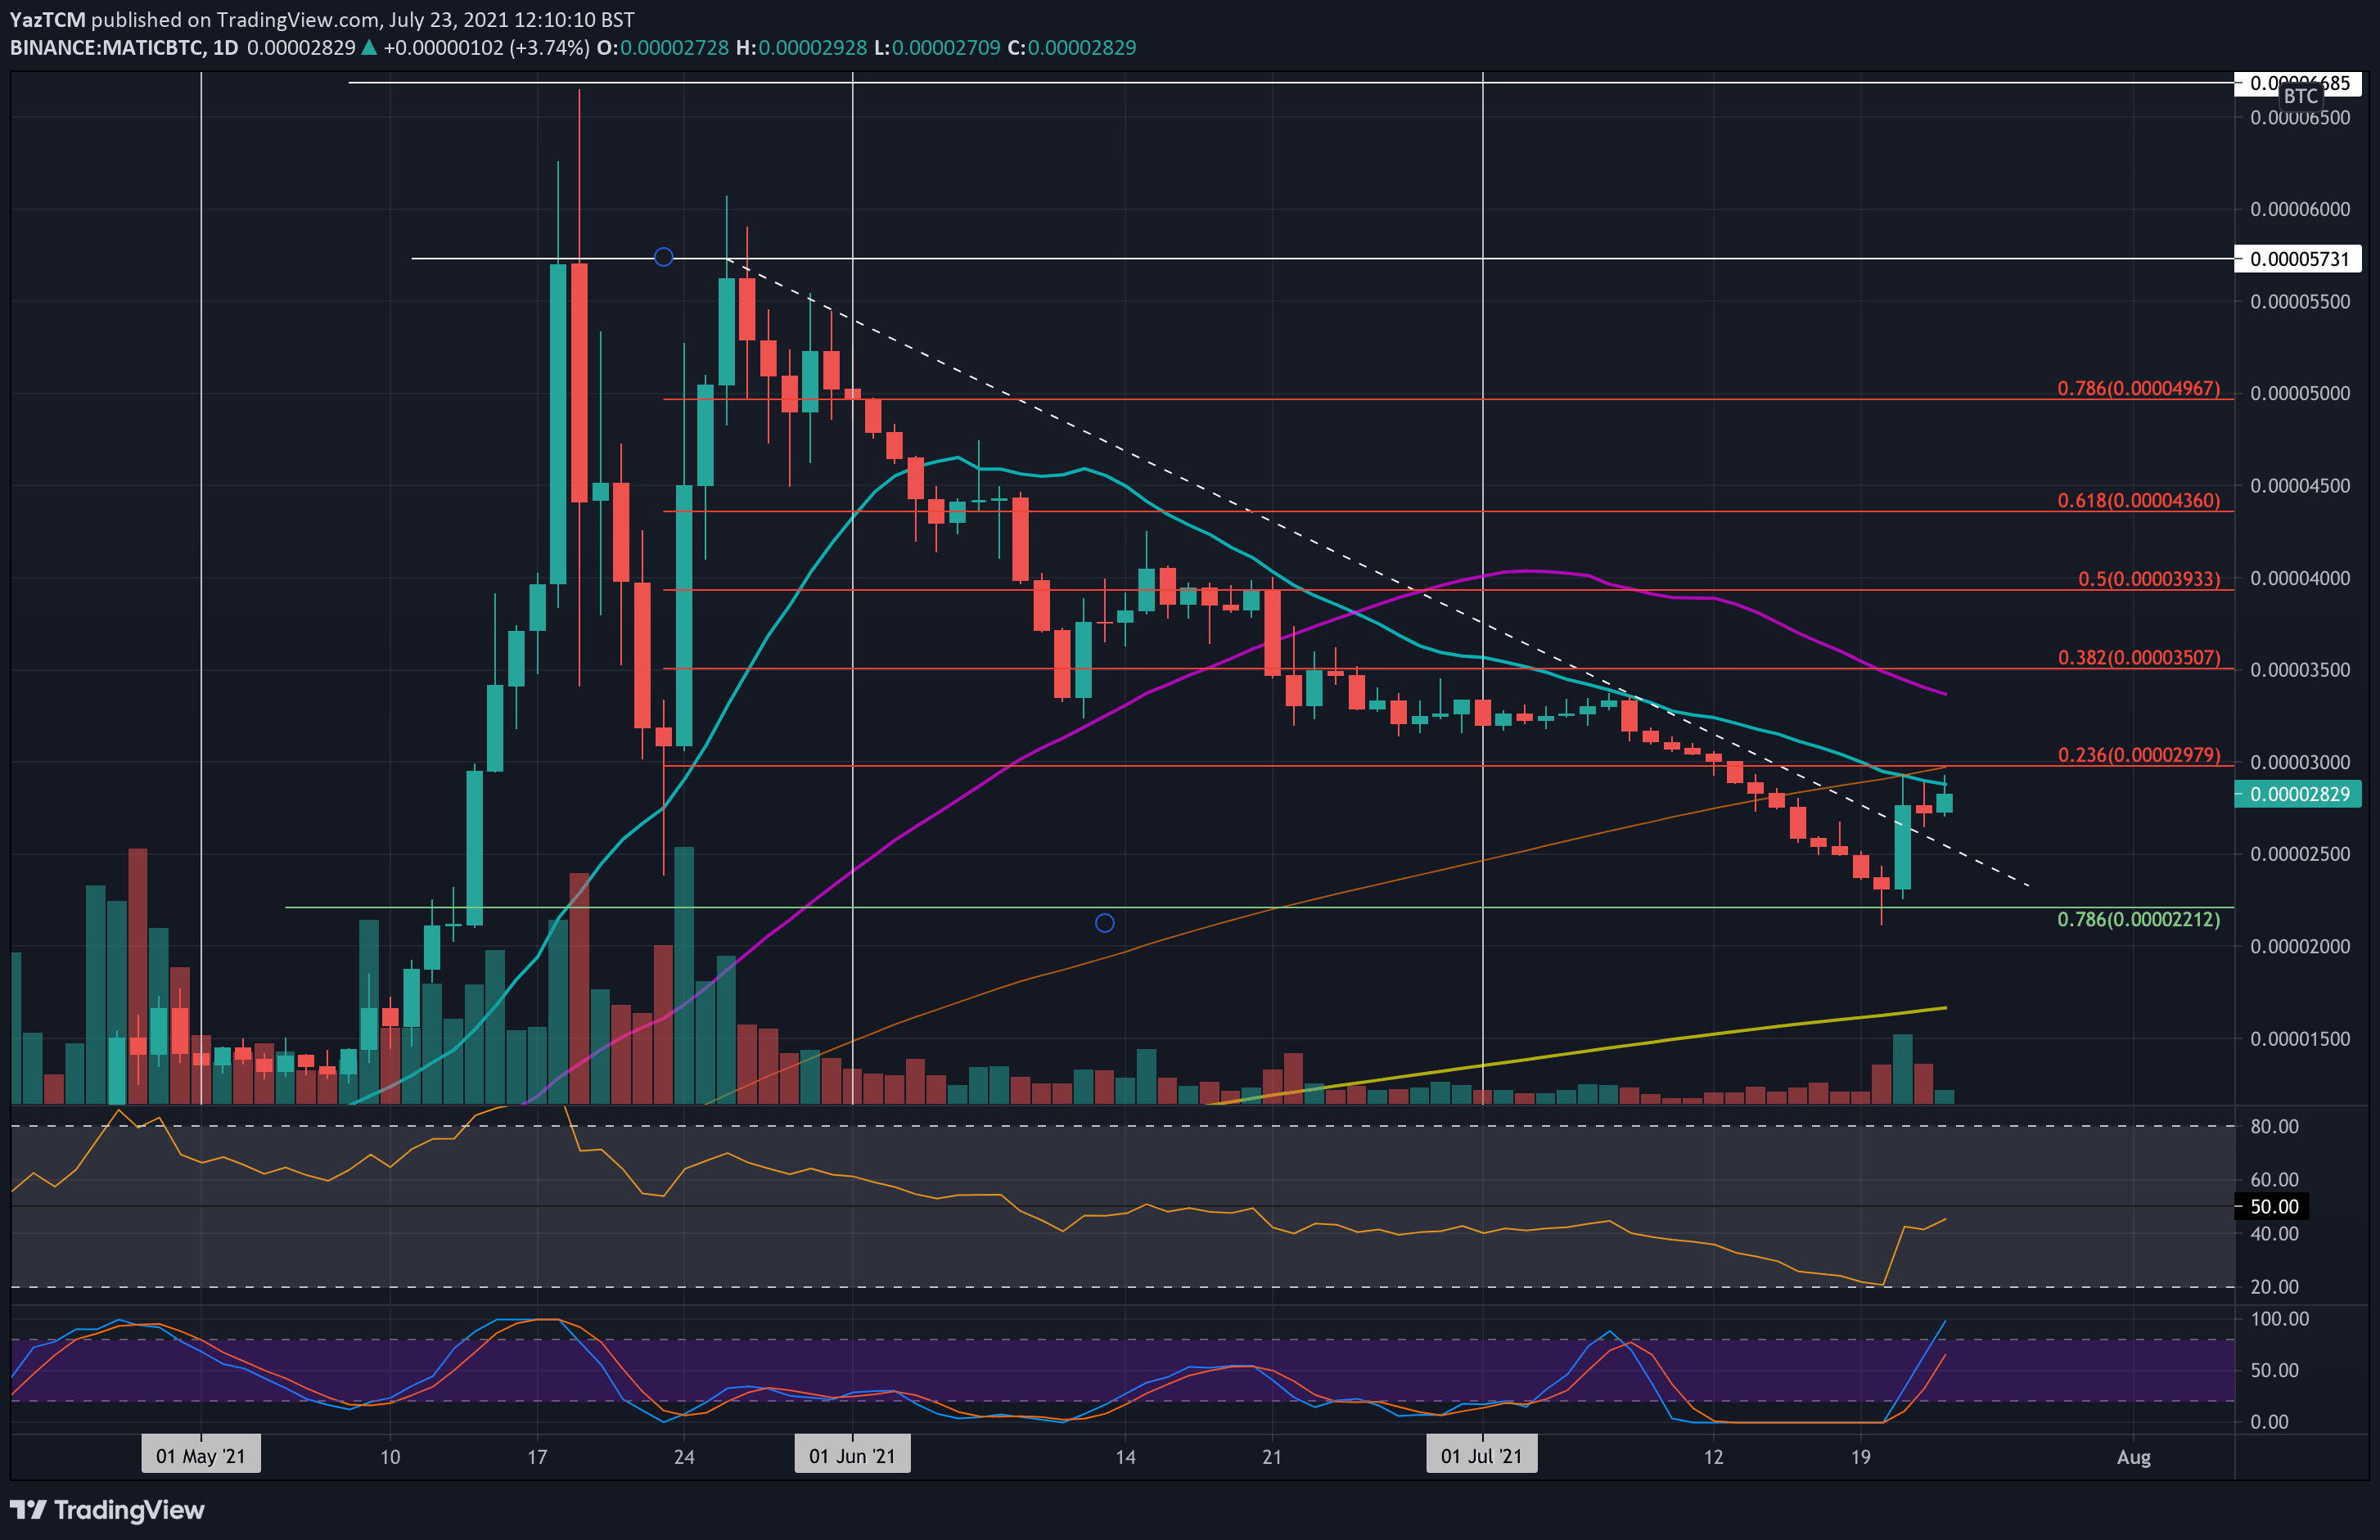
MATIC also broke above the June descending trend line against BTC this week. It dropped into the 2210 SAT support (.786 Fib) during the week but quickly bounced from there to break the descending trend line on Wednesday.
Again, MATIC is now battling with the 20-day MA at around 2850 SAT.
Looking ahead, if the bulls break the 20-day MA, the first resistance lies at 3000 SAT (100-day MA & bearish .236 Fib). This is followed by 3370 SAT (50-day MA), 3500 SAT (bearish .382 FiB), and 4000 SAT (bearish .5 Fib).
On the other side, the first support lies at 2500 SAT. This is followed by 2210 SAT (.786 Fib), 2000 SAT, and 1670 SAT (200-day MA).