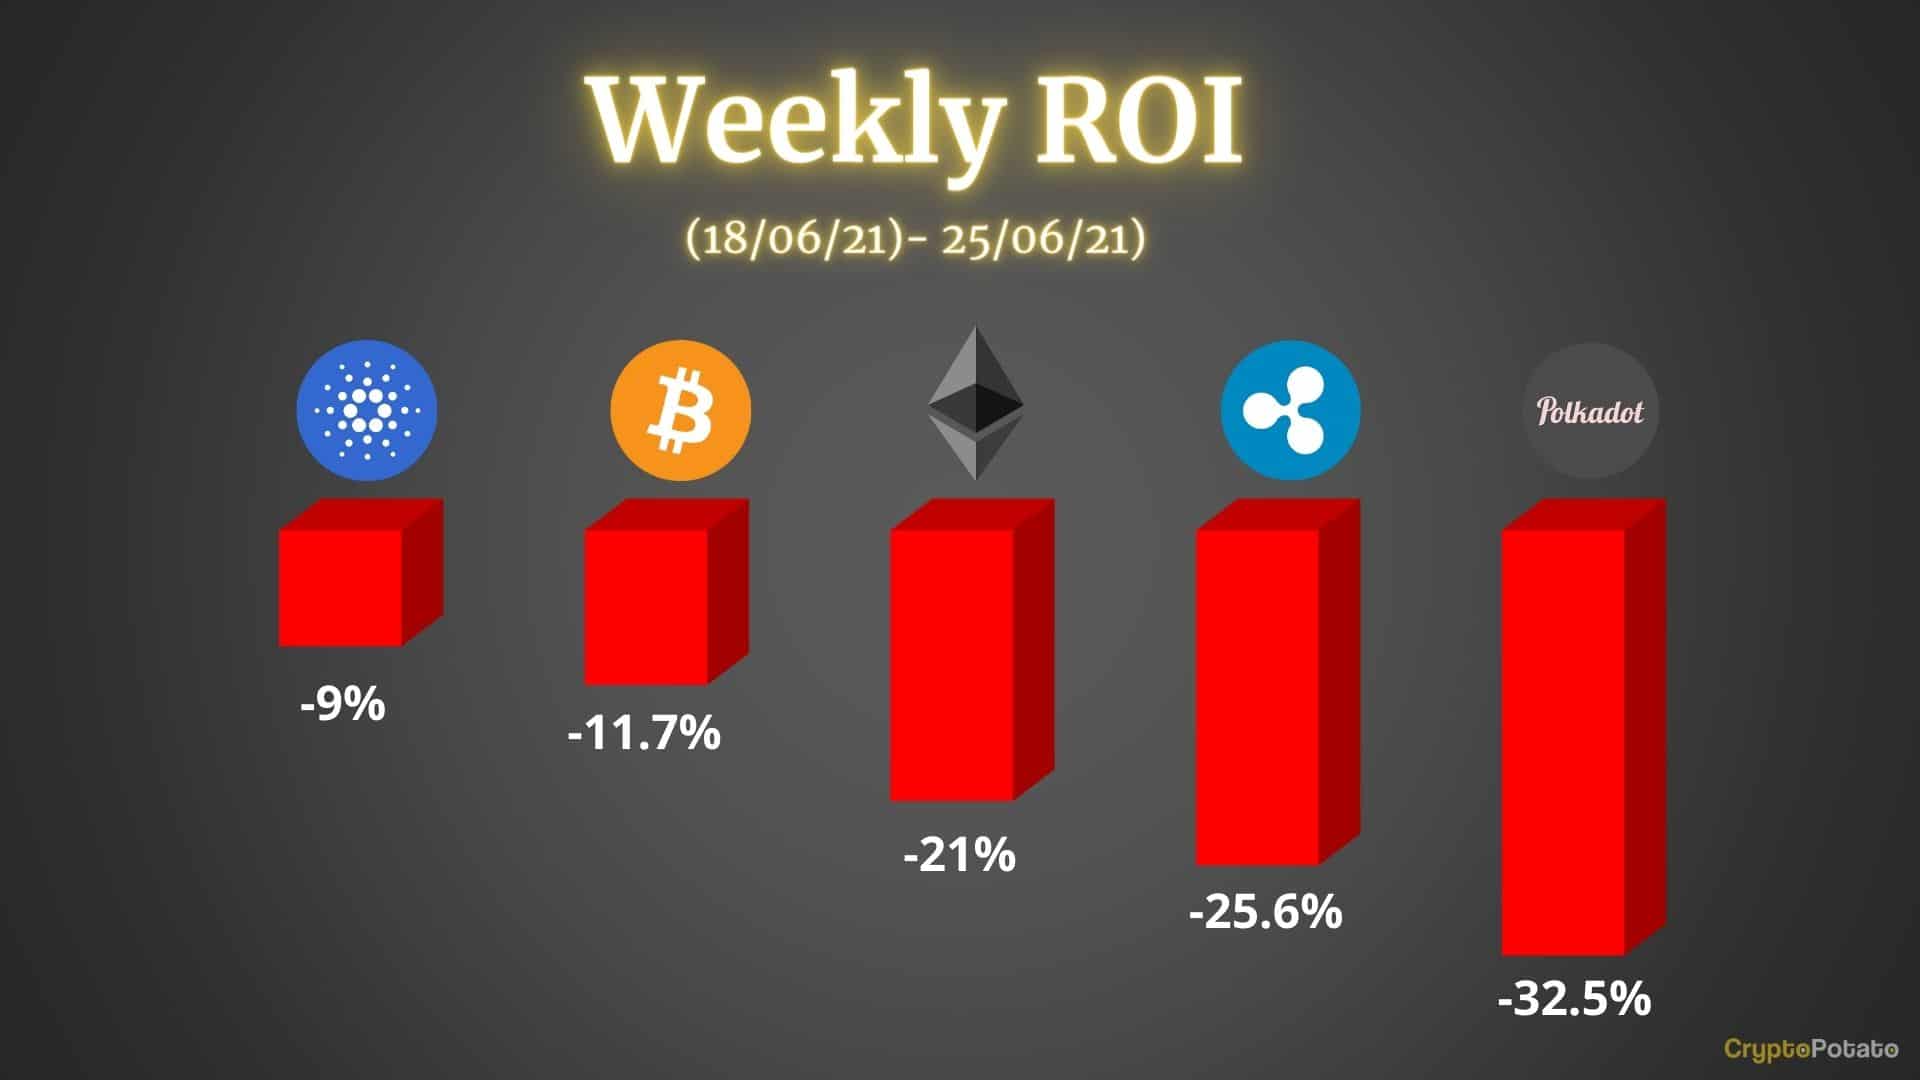
This week was a complete rollercoaster in the cryptocurrency market. Unfortunately, things failed to turn out for the better and the majority is trading in the red. Bitcoin Bitcoin is down a steep 11.7% this week as it currently trades beneath ,000. The cryptocurrency started the week by dropping into support at ,185 (downside 1.618 Fib Extension) on Monday. On Tuesday, it took a brief dive beneath K for the first time since January 2021. It dropped as low as ,800 before the buyers regrouped and quickly pushed BTC back higher. In total, BTC did not spend more than 3 hours beneath the k level. Since rebounding above K, BTC created the first three consecutive bullish candles since the mid-May price capitulation. It did reach as high as ,500 today.
Topics:
Yaz Sheikh considers the following as important: ADABTC, ADAUSD, Bitcoin (BTC) Price, BTCEUR, BTCGBP, btcusd, btcusdt, Cardano (ADA) Price, DOTUSD, DOTUSDT, ETH Analysis, ETHBTC, Ethereum (ETH) Price, ethusd, Polkadot (DOT) Price, Price Analysis, Ripple (XRP) Price, XRP Analysis, xrpbtc, xrpusd
This could be interesting, too:
Wayne Jones writes Chinese Auto Dealer Dives Into Bitcoin Mining With 6M Investment
CryptoVizArt writes Ethereum Price Analysis: Following a 15% Weekly Crash, What’s Next for ETH?
CryptoVizArt writes Bitcoin Price Analysis: Is BTC In Danger of Falling to ,000 Soon?
Jordan Lyanchev writes Ripple, Dogecoin Whales Bought the Dip as XRP, DOGE Prices Soar
This week was a complete rollercoaster in the cryptocurrency market. Unfortunately, things failed to turn out for the better and the majority is trading in the red.
Bitcoin
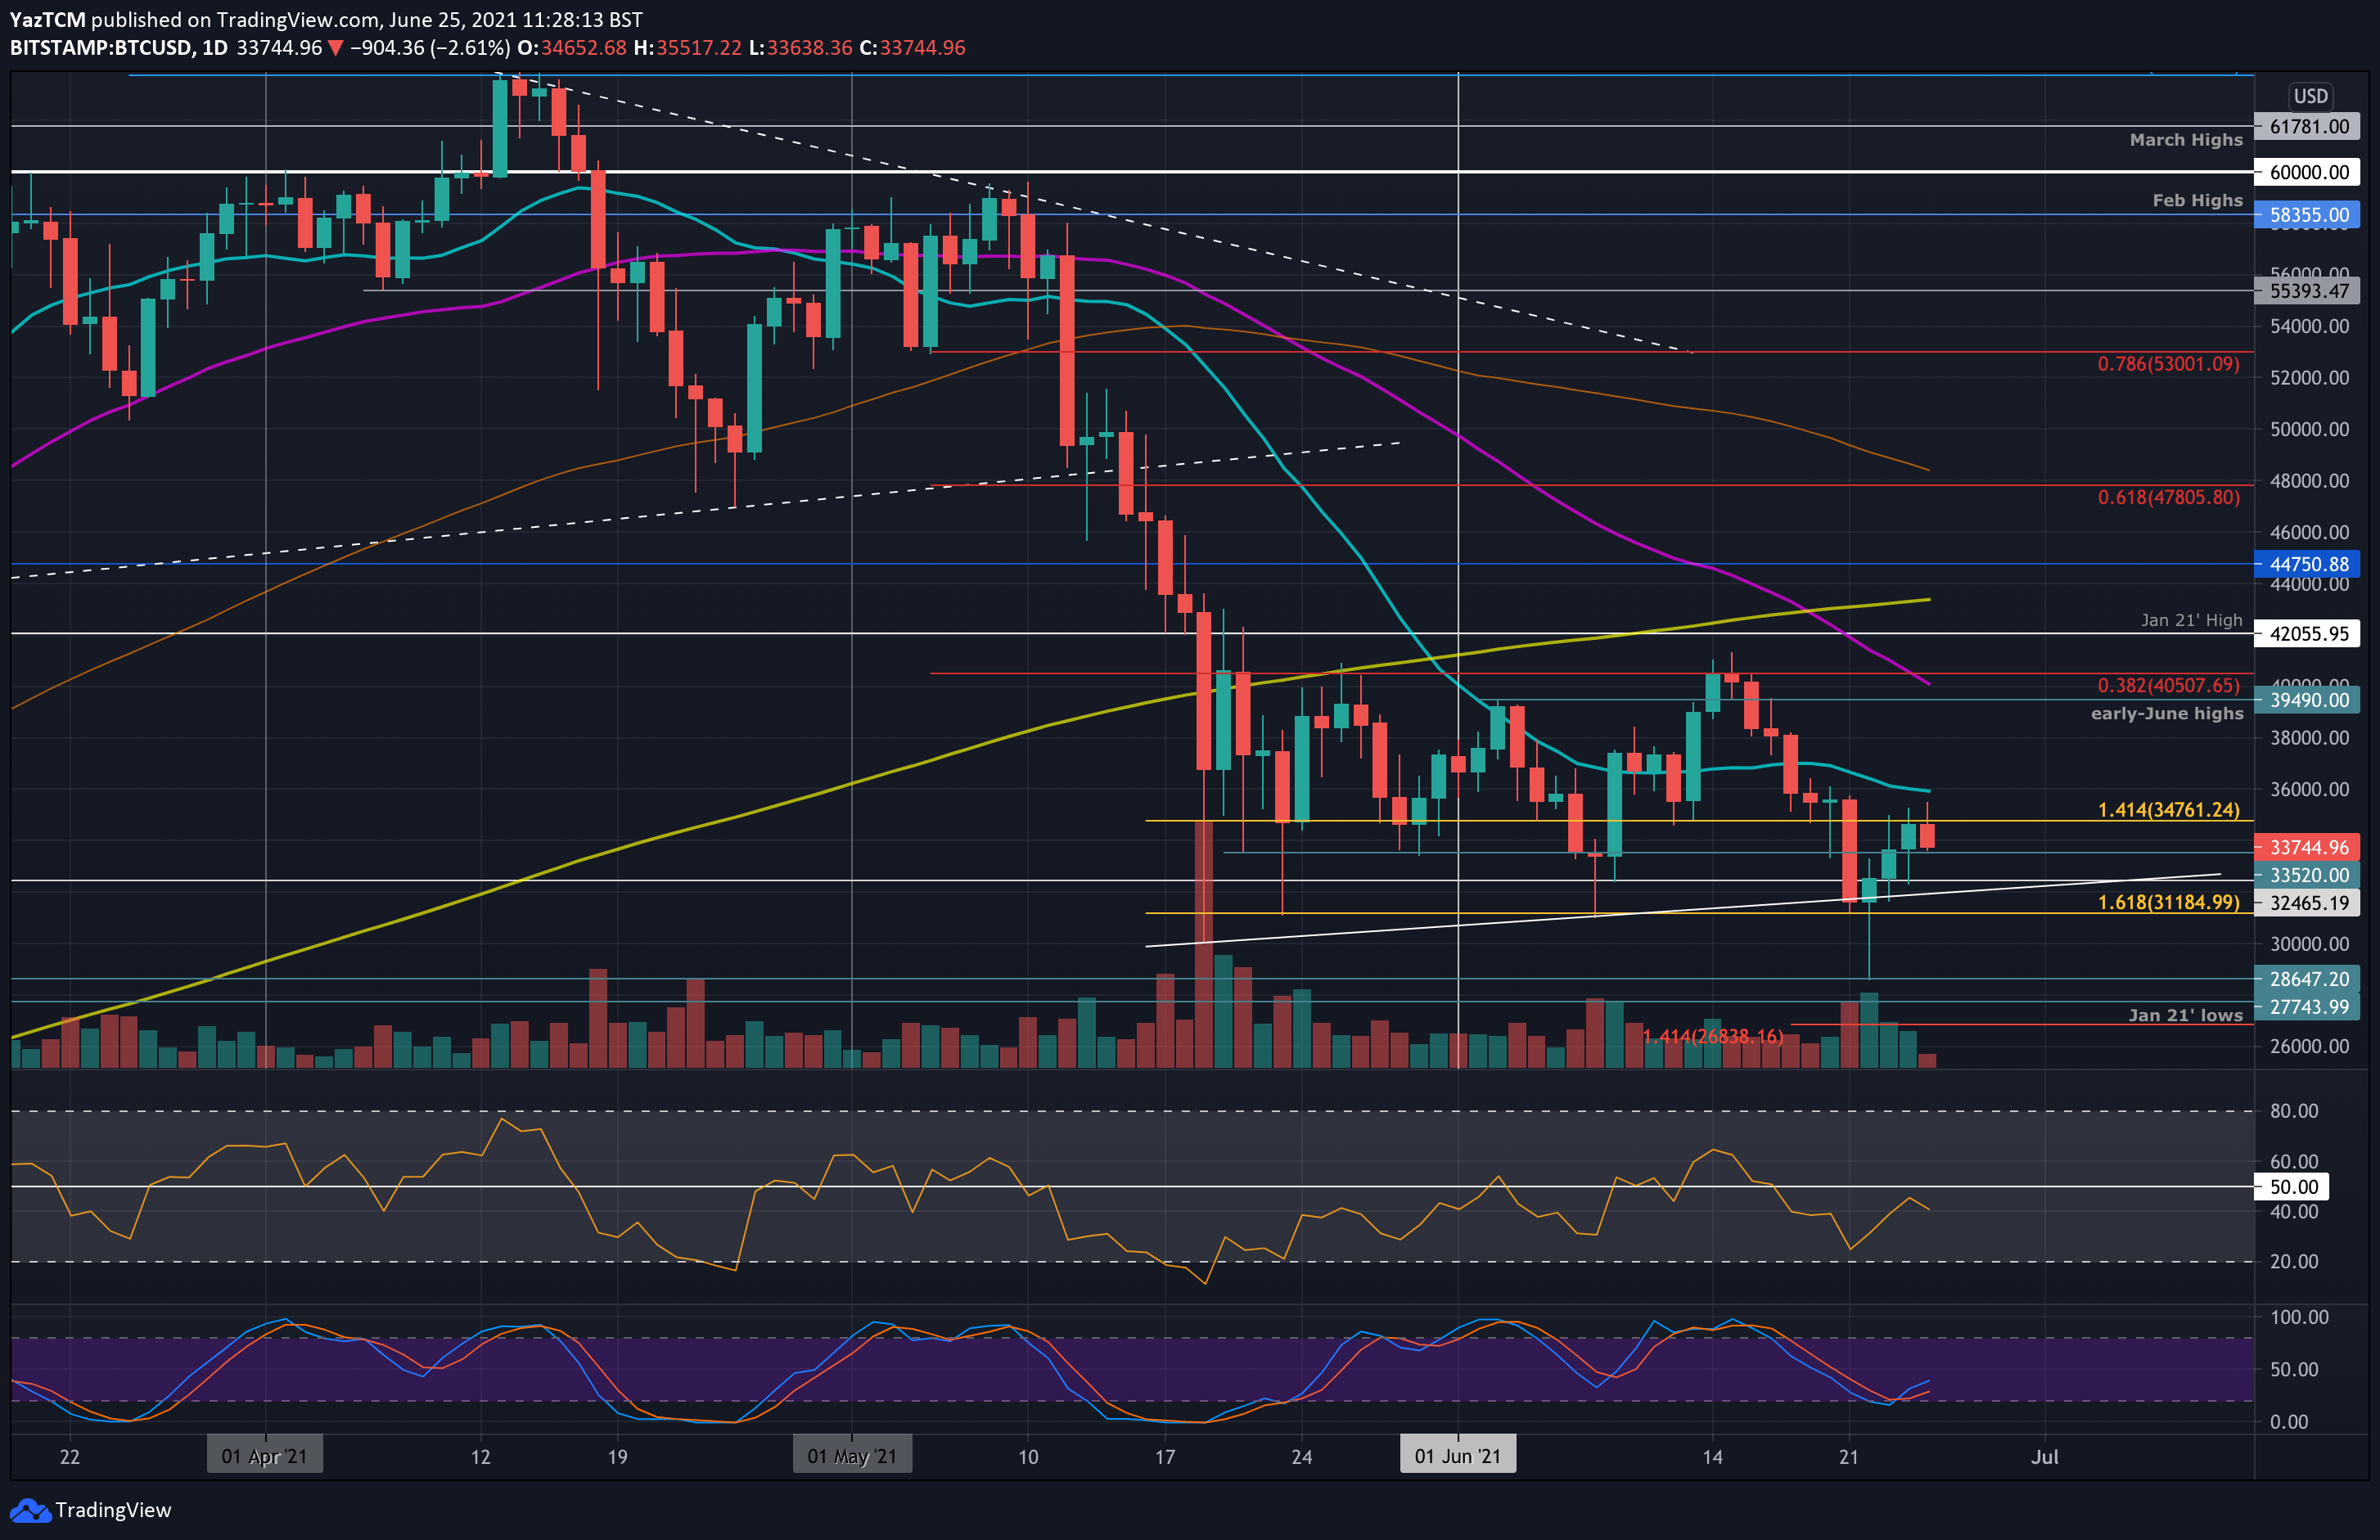
Bitcoin is down a steep 11.7% this week as it currently trades beneath $34,000. The cryptocurrency started the week by dropping into support at $31,185 (downside 1.618 Fib Extension) on Monday.
On Tuesday, it took a brief dive beneath $30K for the first time since January 2021. It dropped as low as $28,800 before the buyers regrouped and quickly pushed BTC back higher. In total, BTC did not spend more than 3 hours beneath the $30k level.
Since rebounding above $30K, BTC created the first three consecutive bullish candles since the mid-May price capitulation. It did reach as high as $35,500 today. However, it was unable to close above resistance at $34,760 (downside 1.414 Fib Extension) and has since dropped.
Looking ahead, the first support lies at $33,520. This is followed by $32,465, $31,185 (downside 1.618 Fib Extension), and $30,000. Added support lies at $28,800, $27,750 (January 2021 lows), and $36,840 (downside 1.414 Fib Extension).
On the other side, if the buyers can climb above resistance at $34,760, the first resistance lies at $36,000 (20-day MA). This is followed by $38,000, $39,490 (early-June highs), $40,000 (50-day MA), and $42,000 (January 2021 highs).
Ethereum
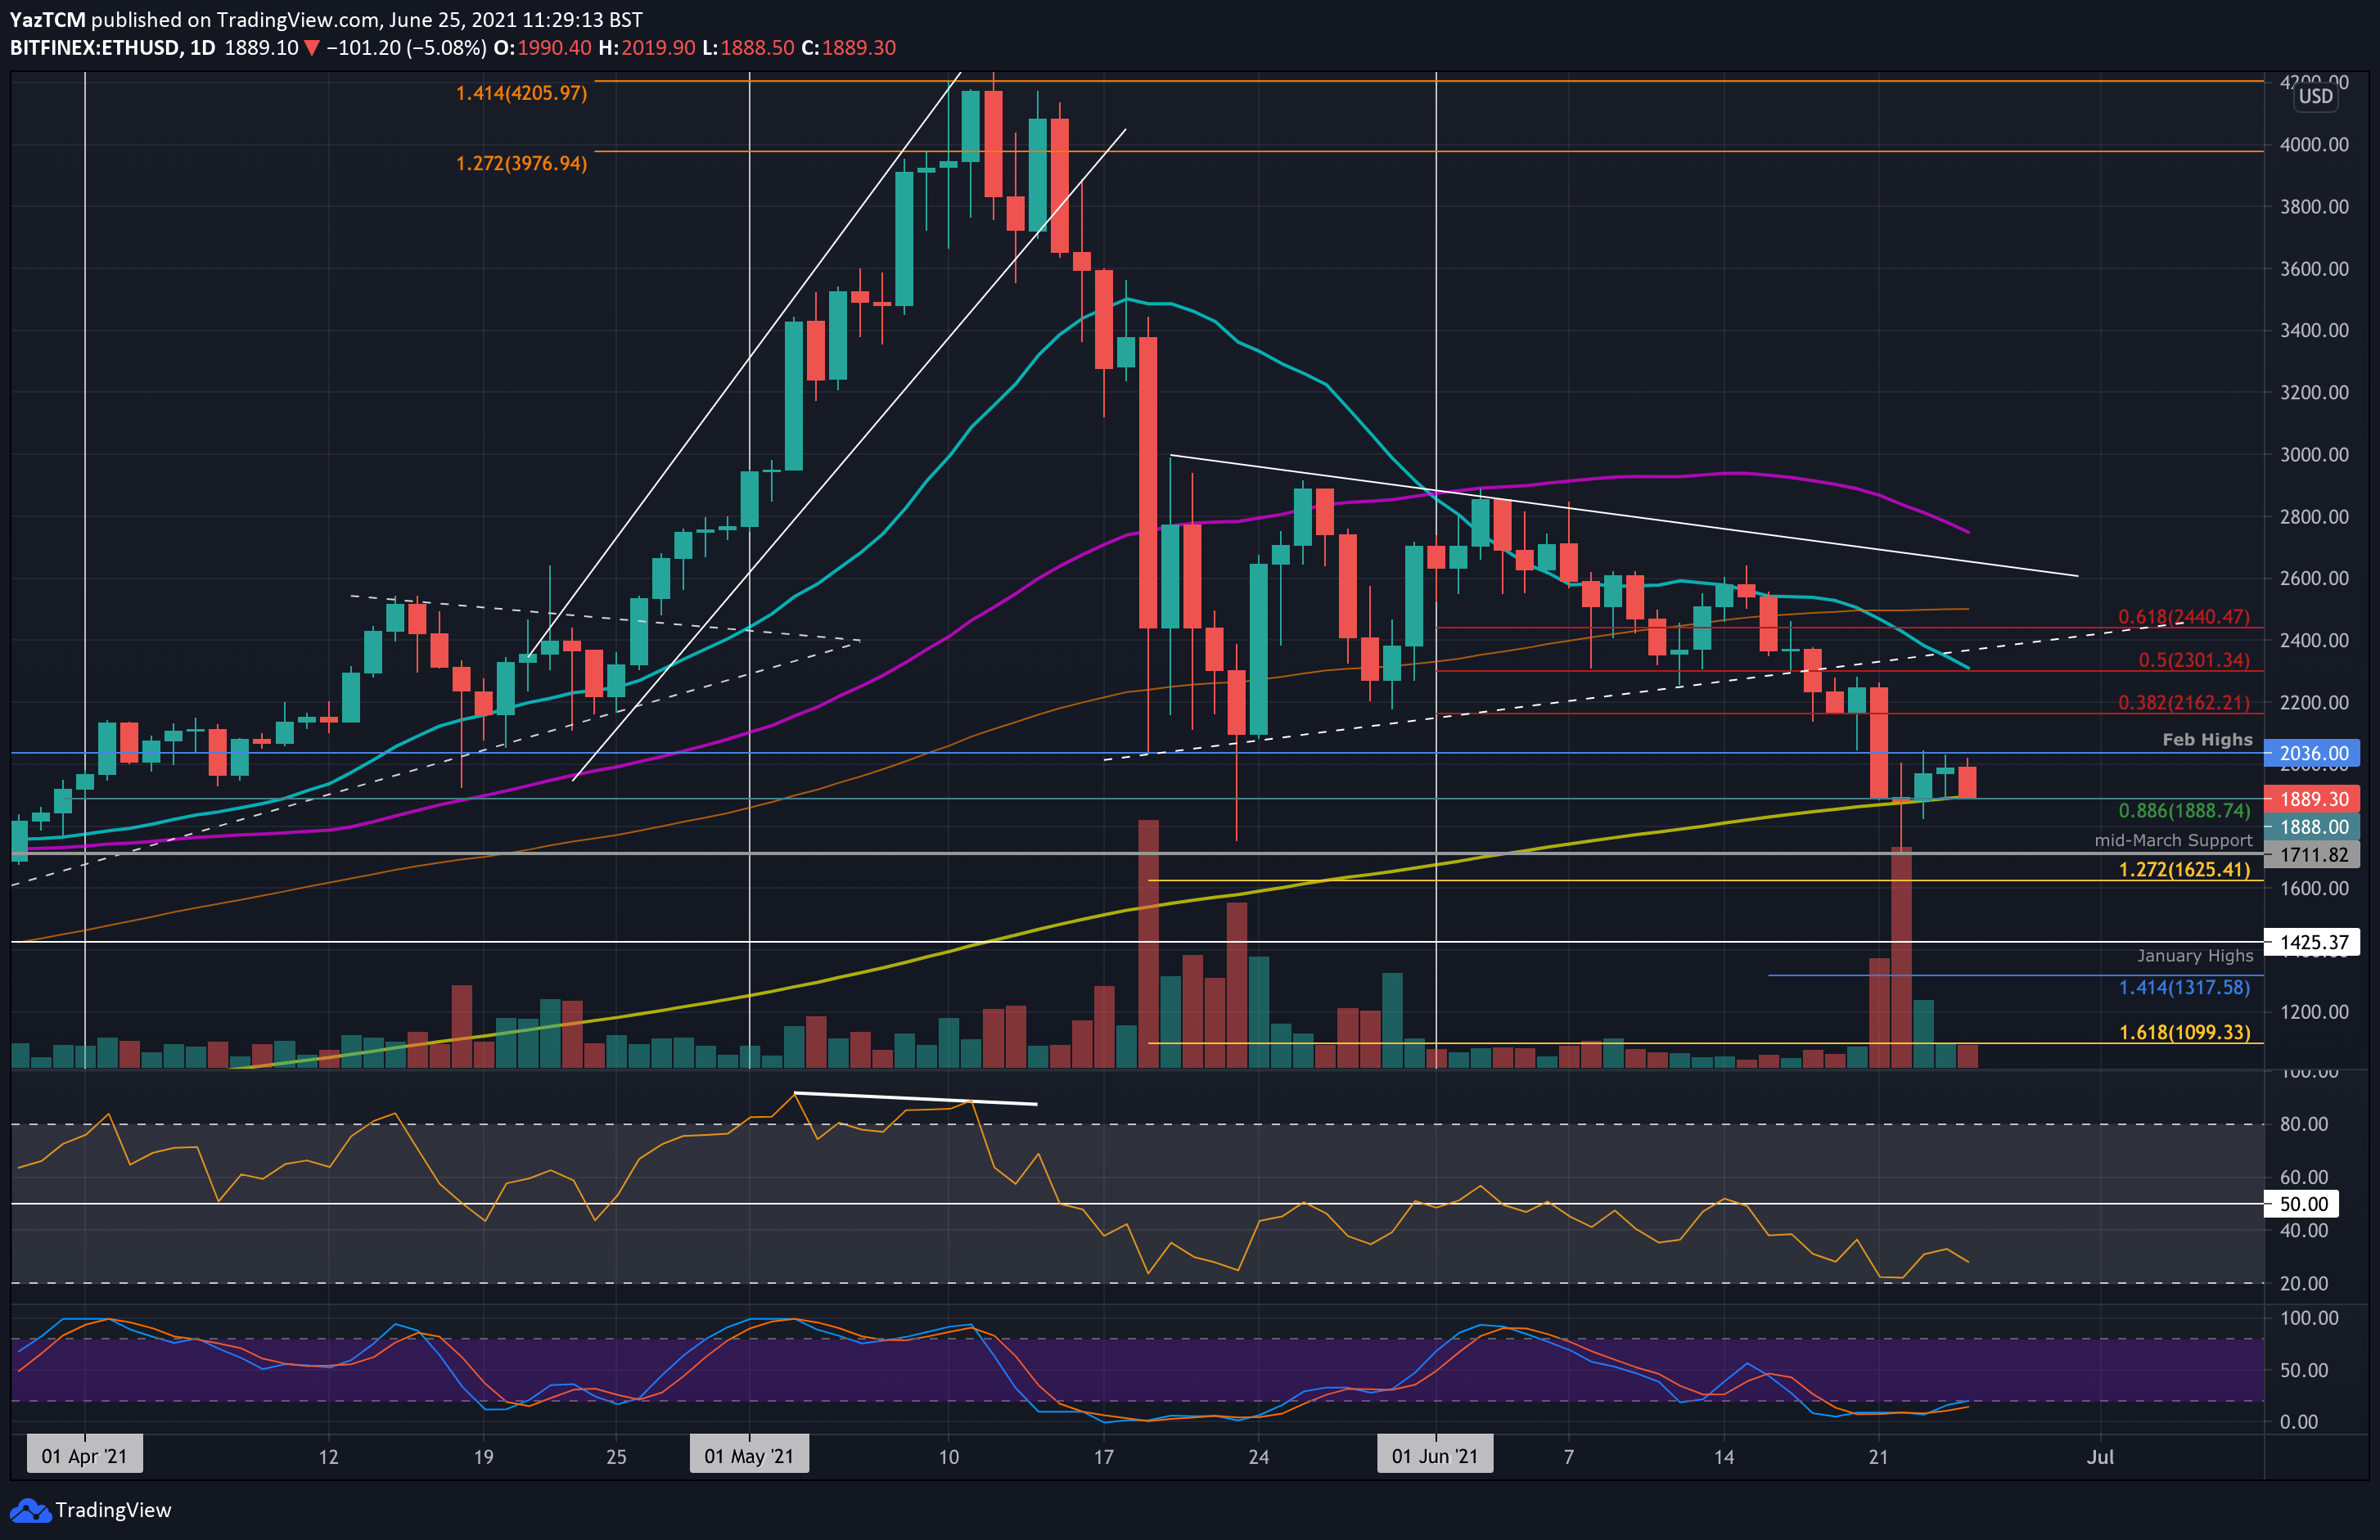
Ethereum fell by a very steep 201 over the week as it trades at $1888 – support provided by the 200-day MA and a .886 Fib. The cryptocurrency fell beneath $2200 on Monday and crashed into the $1888 support.
On the Tuesday spike lower, ETH dropped to $1710 but quickly rebounded to close the daily candle above the 200-day MA. Since then, ETH has been unable to reclaim the $2000 level and has returned to the 200-day MA.
Looking ahead, if the sellers break beneath the 200-day MA, the first support lies at $1710 (mid-March support). This is followed by $1625 (downside 1.272 Fib Extension), $1500, and $1425 (January 2021 highs).
On the other side, the first resistance lies at $2000. This is followed by $2160 (bearish .382 Fib), $2300 (bearish .5 Fib & 20-day MA), $2500 (100-day MA), and $2600.
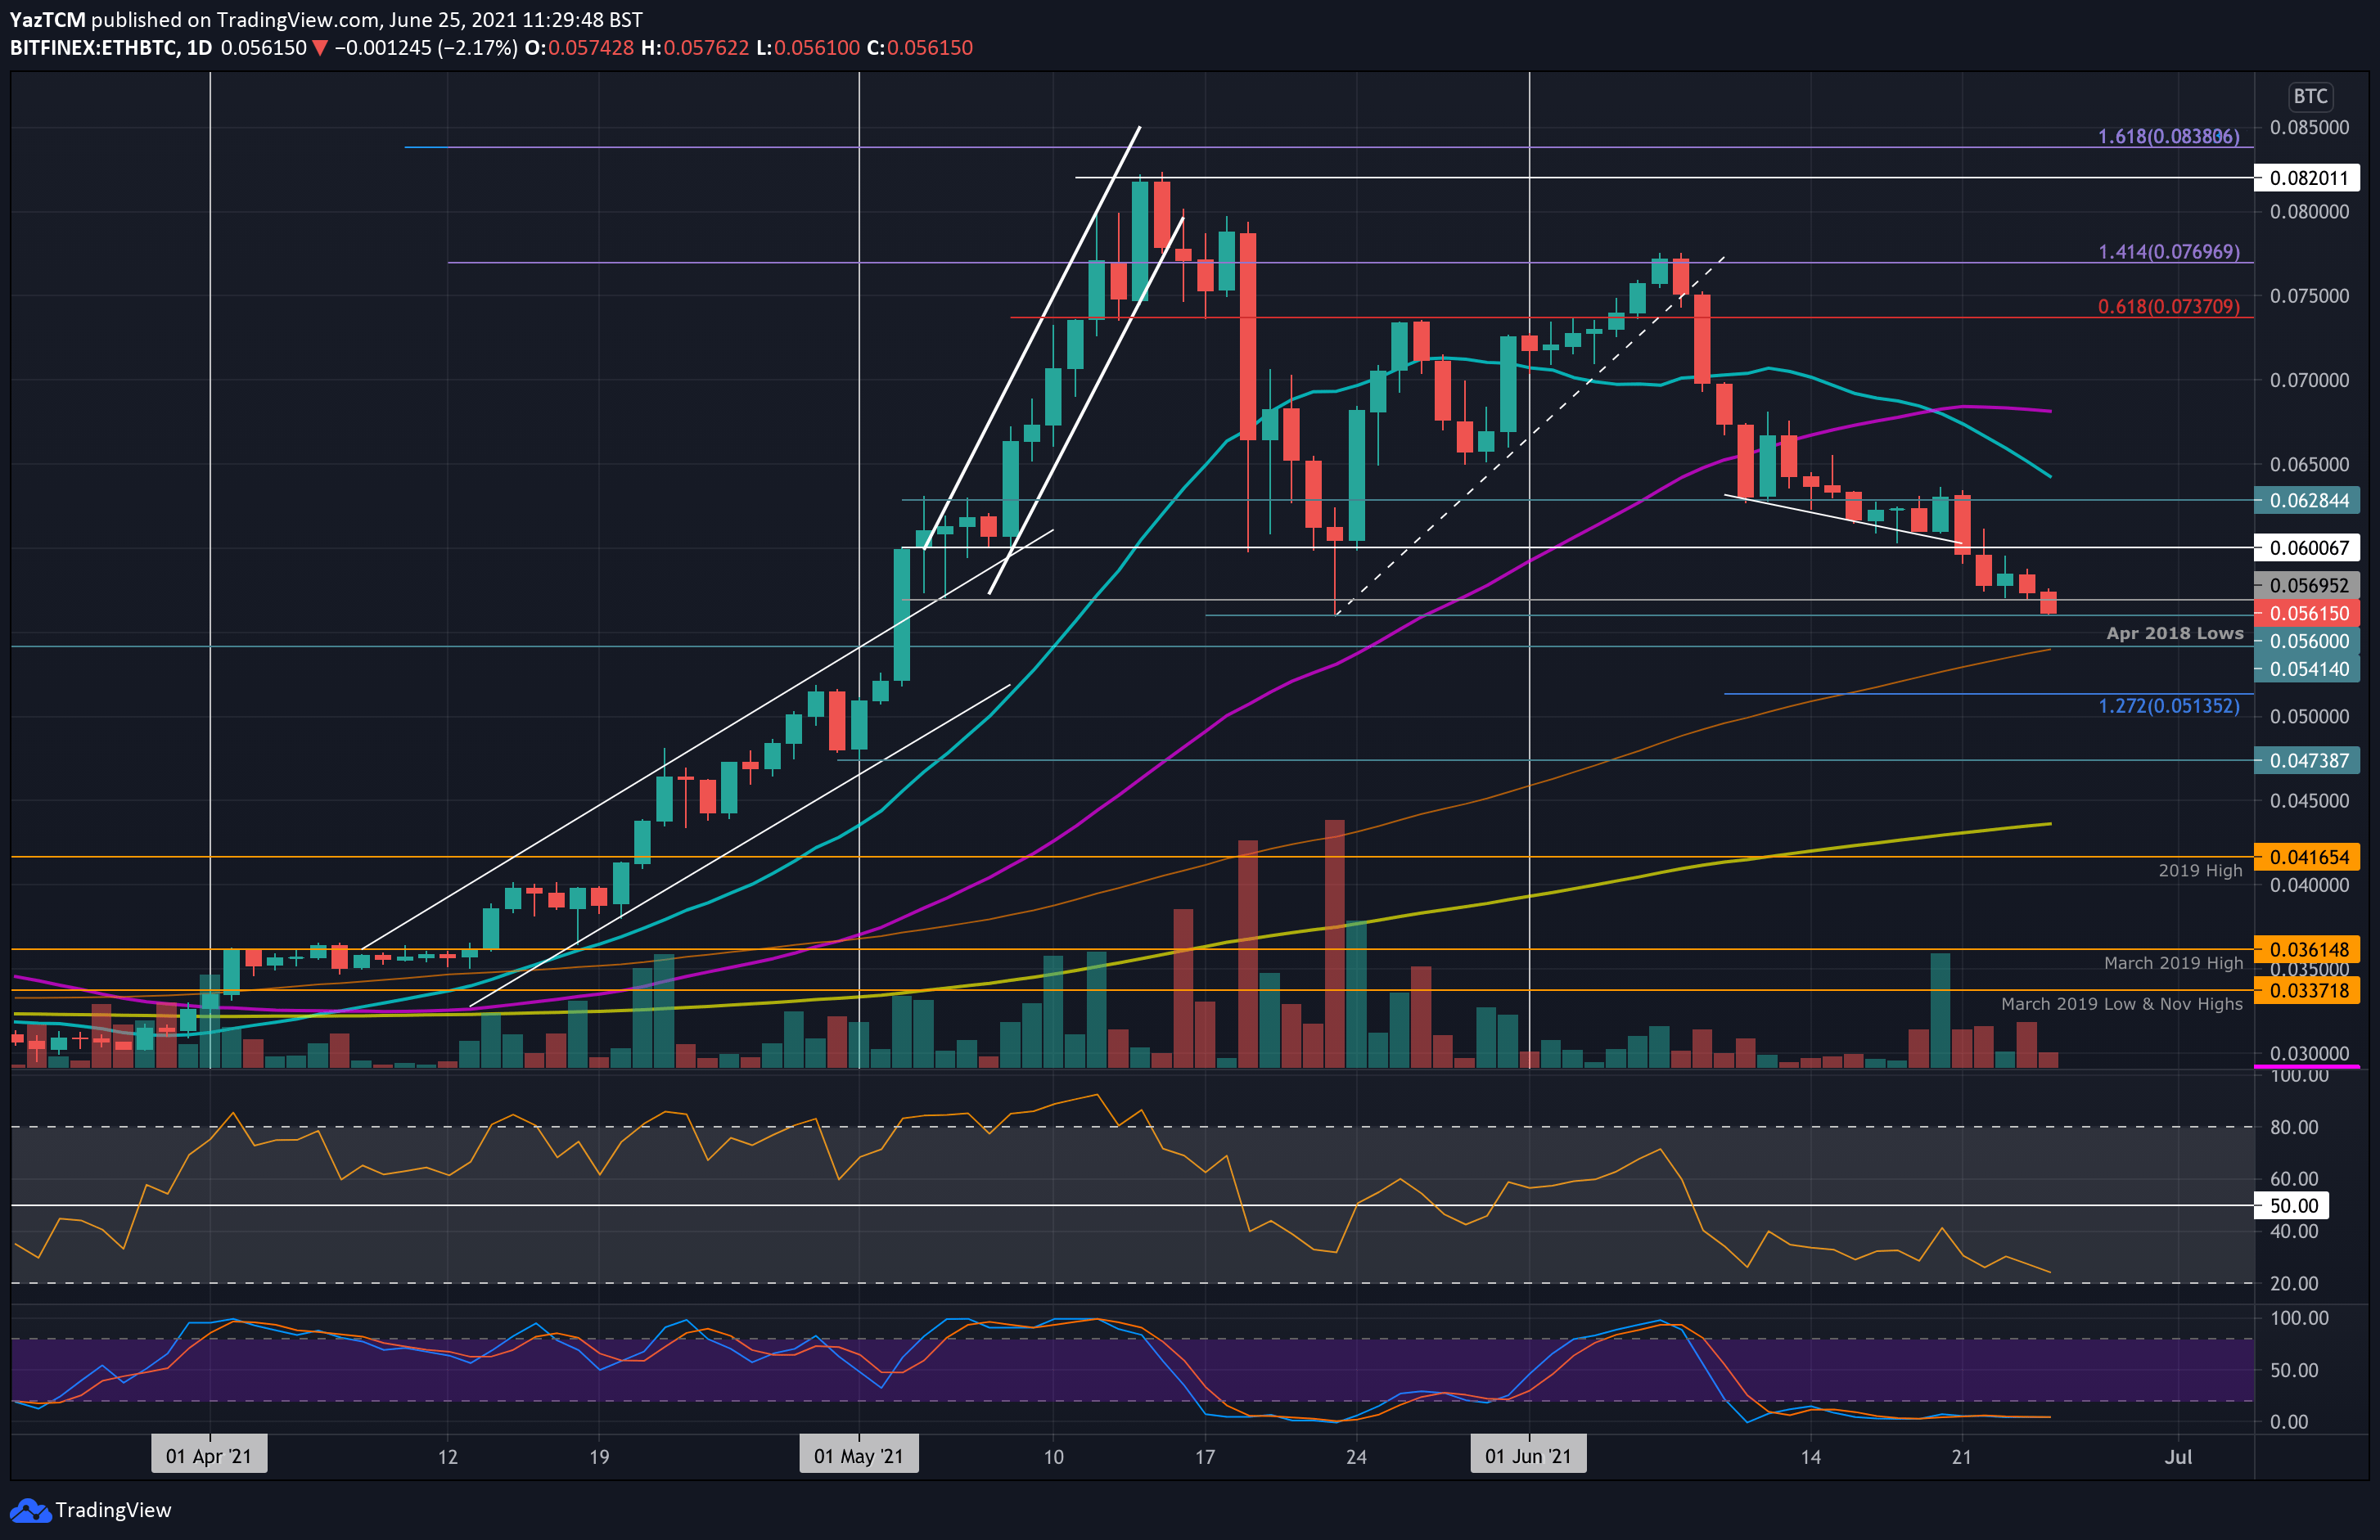
ETH is also in trouble against BTC after dropping from 0.063 BTC on Monday and heading beneath 0.06 BTC on Tuesday. It continued to run lower as it broke below support at 0.0569 BTC today.
It is currently trading at 0.056 BTC, but the bearish momentum is still likely to drag it lower in the coming days.
If the sellers push beneath 0.056 BTC, the first support lies at 0.0541 BTC (April 2018 lows & 100-day MA). This is followed by 0.0513 (downside 1.272 Fib Extension), 0.05 BTC, and 0.0473 BTC.
On the other side, the first strong resistance lies at 0.06 BTC. This is followed by 0.0628 BTC, 0.0648 BTC (20-day MA), and 0.068 BTC (50-day MA).
Ripple
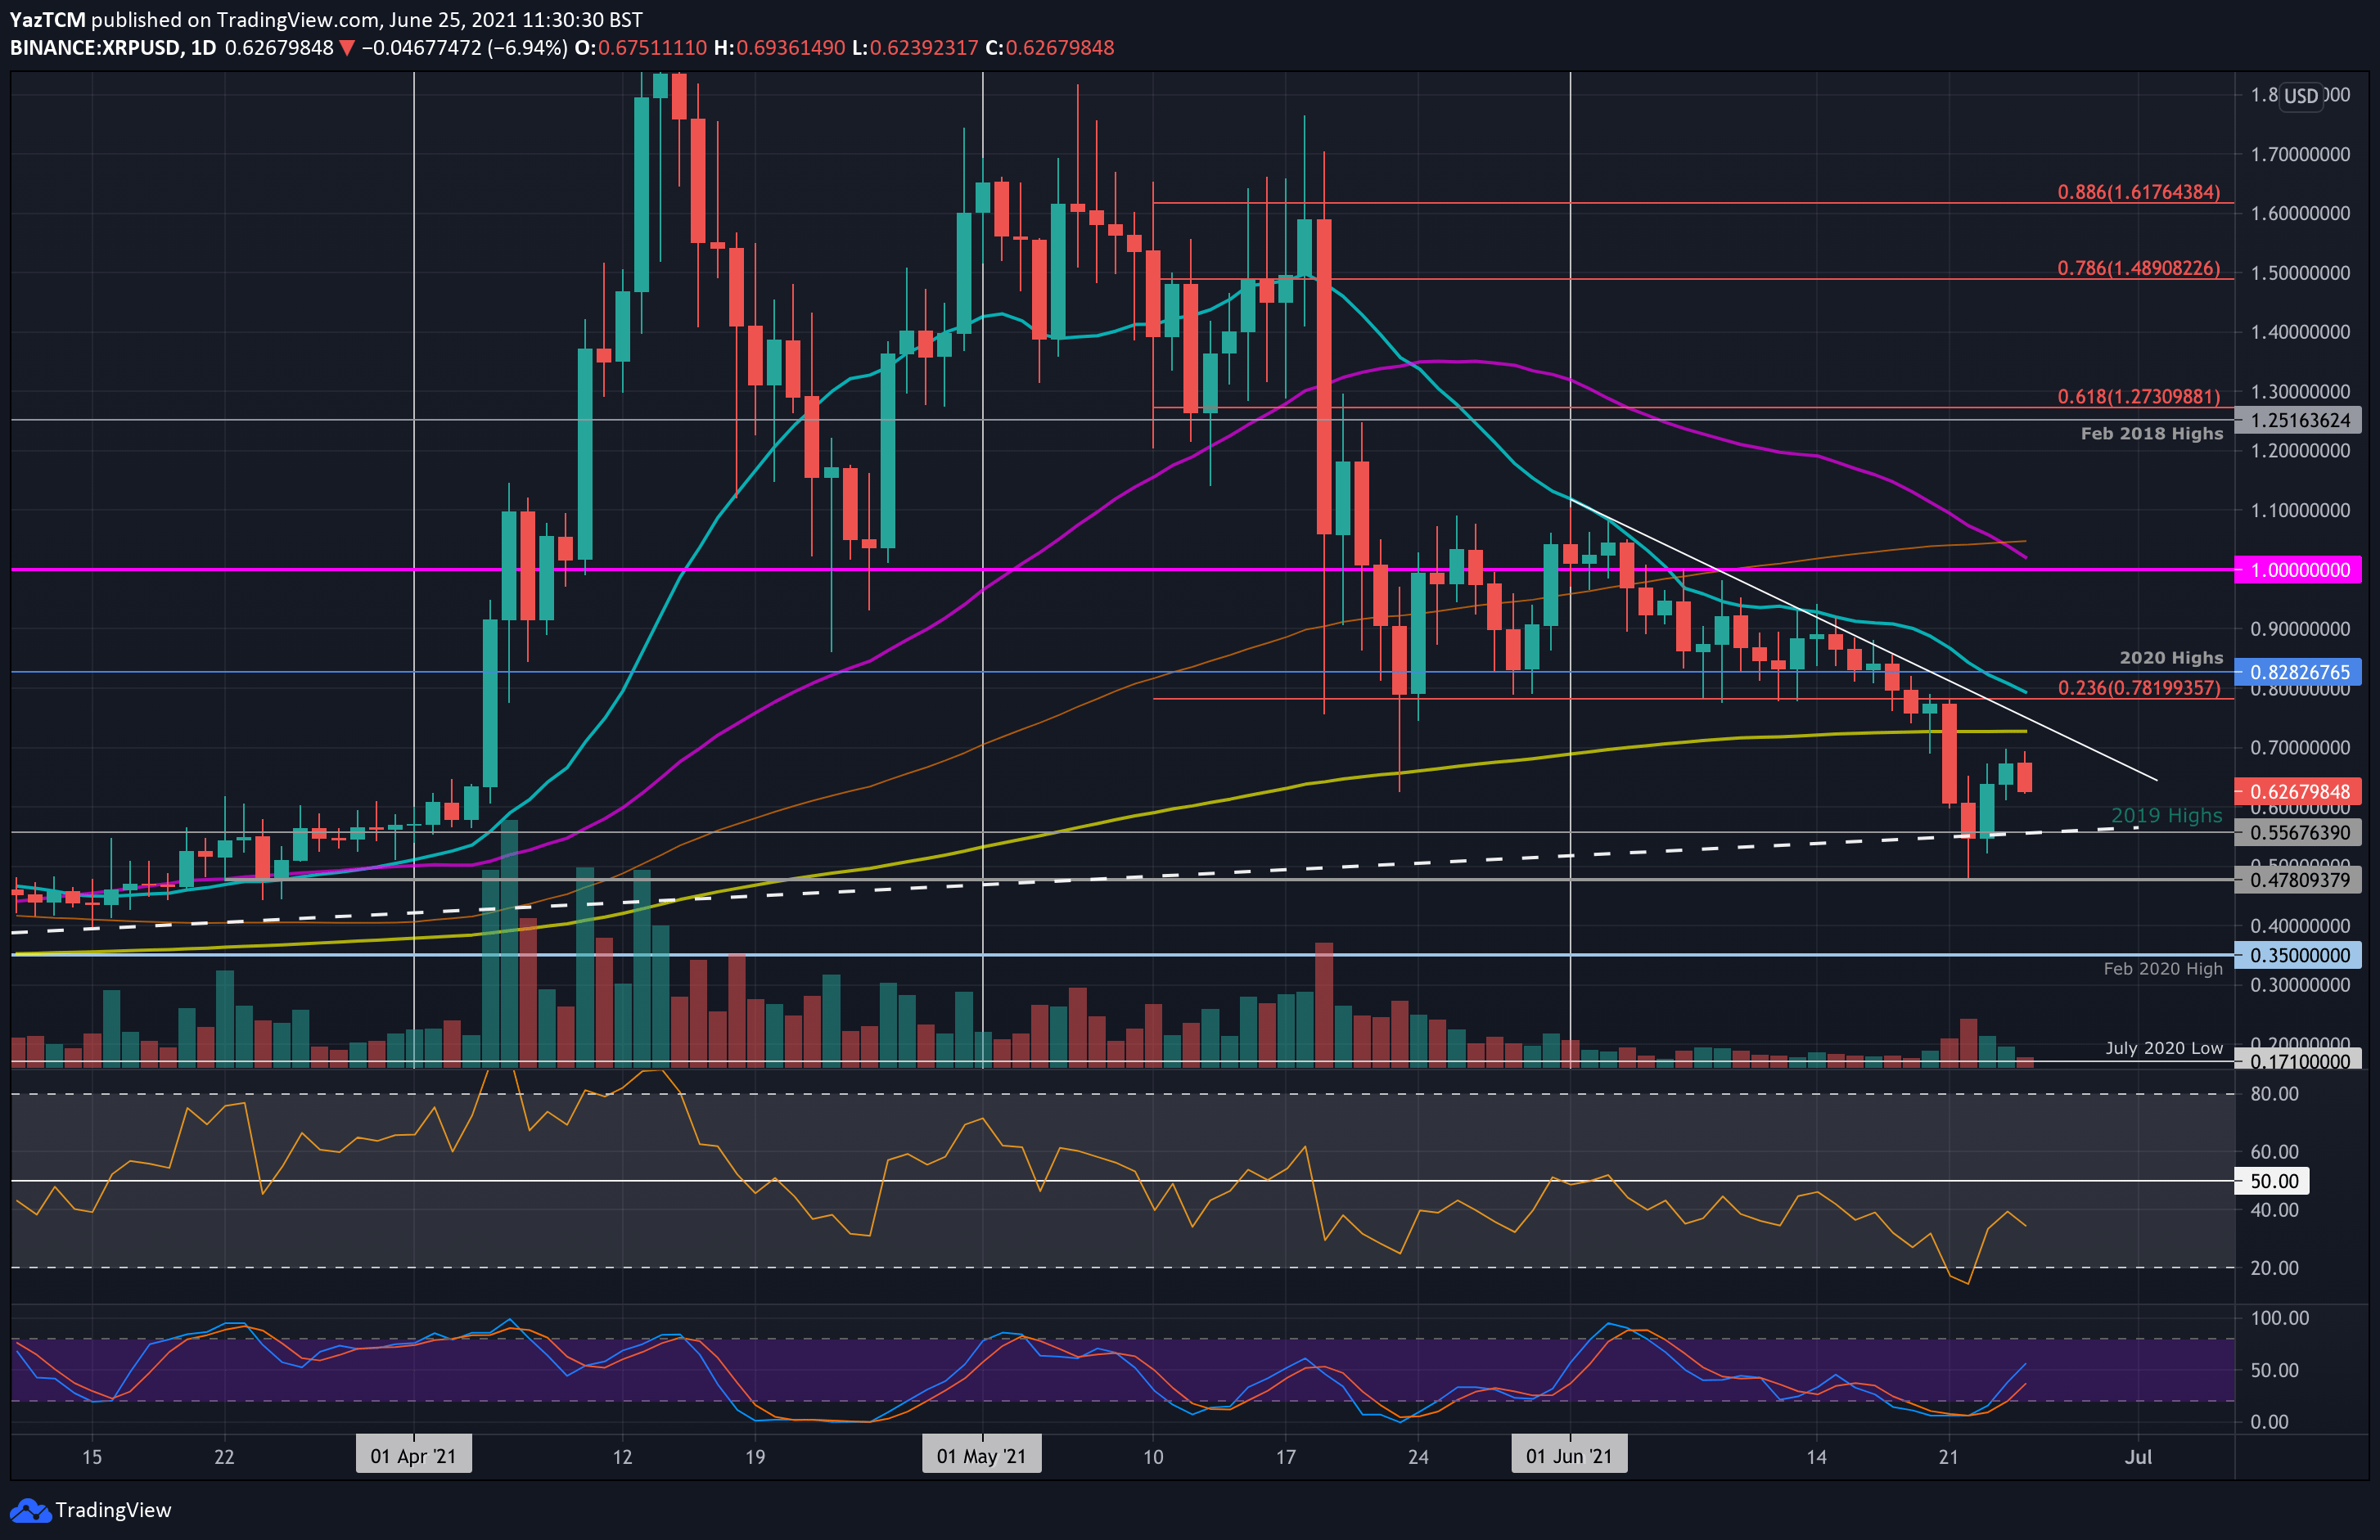
XRP fell by an even steeper 25% over the week. The cryptocurrency dropped from $0.781 resistance on Monday to reach $0.6.
It continued on Tuesday to hit the support at $0.55 provided by the 2019 highs and a long-term ascending trend line. It has since attempted to rebound but is struggling to make ground back above $0.7 as it now trades at $0.62.
Moving forward, the first strong support lies at $0.6. This is followed by $0.55 (2019 highs), $0.5, $0.478 (this week’s low), and $0.4.
On the other side, the first resistance lies between $0.7 and $0.72 (200-day MA). Above this, resistance is found at $0.781 (bearish .236 Fib), $0.8282 (2020 highs), $0.9, and $1.00.
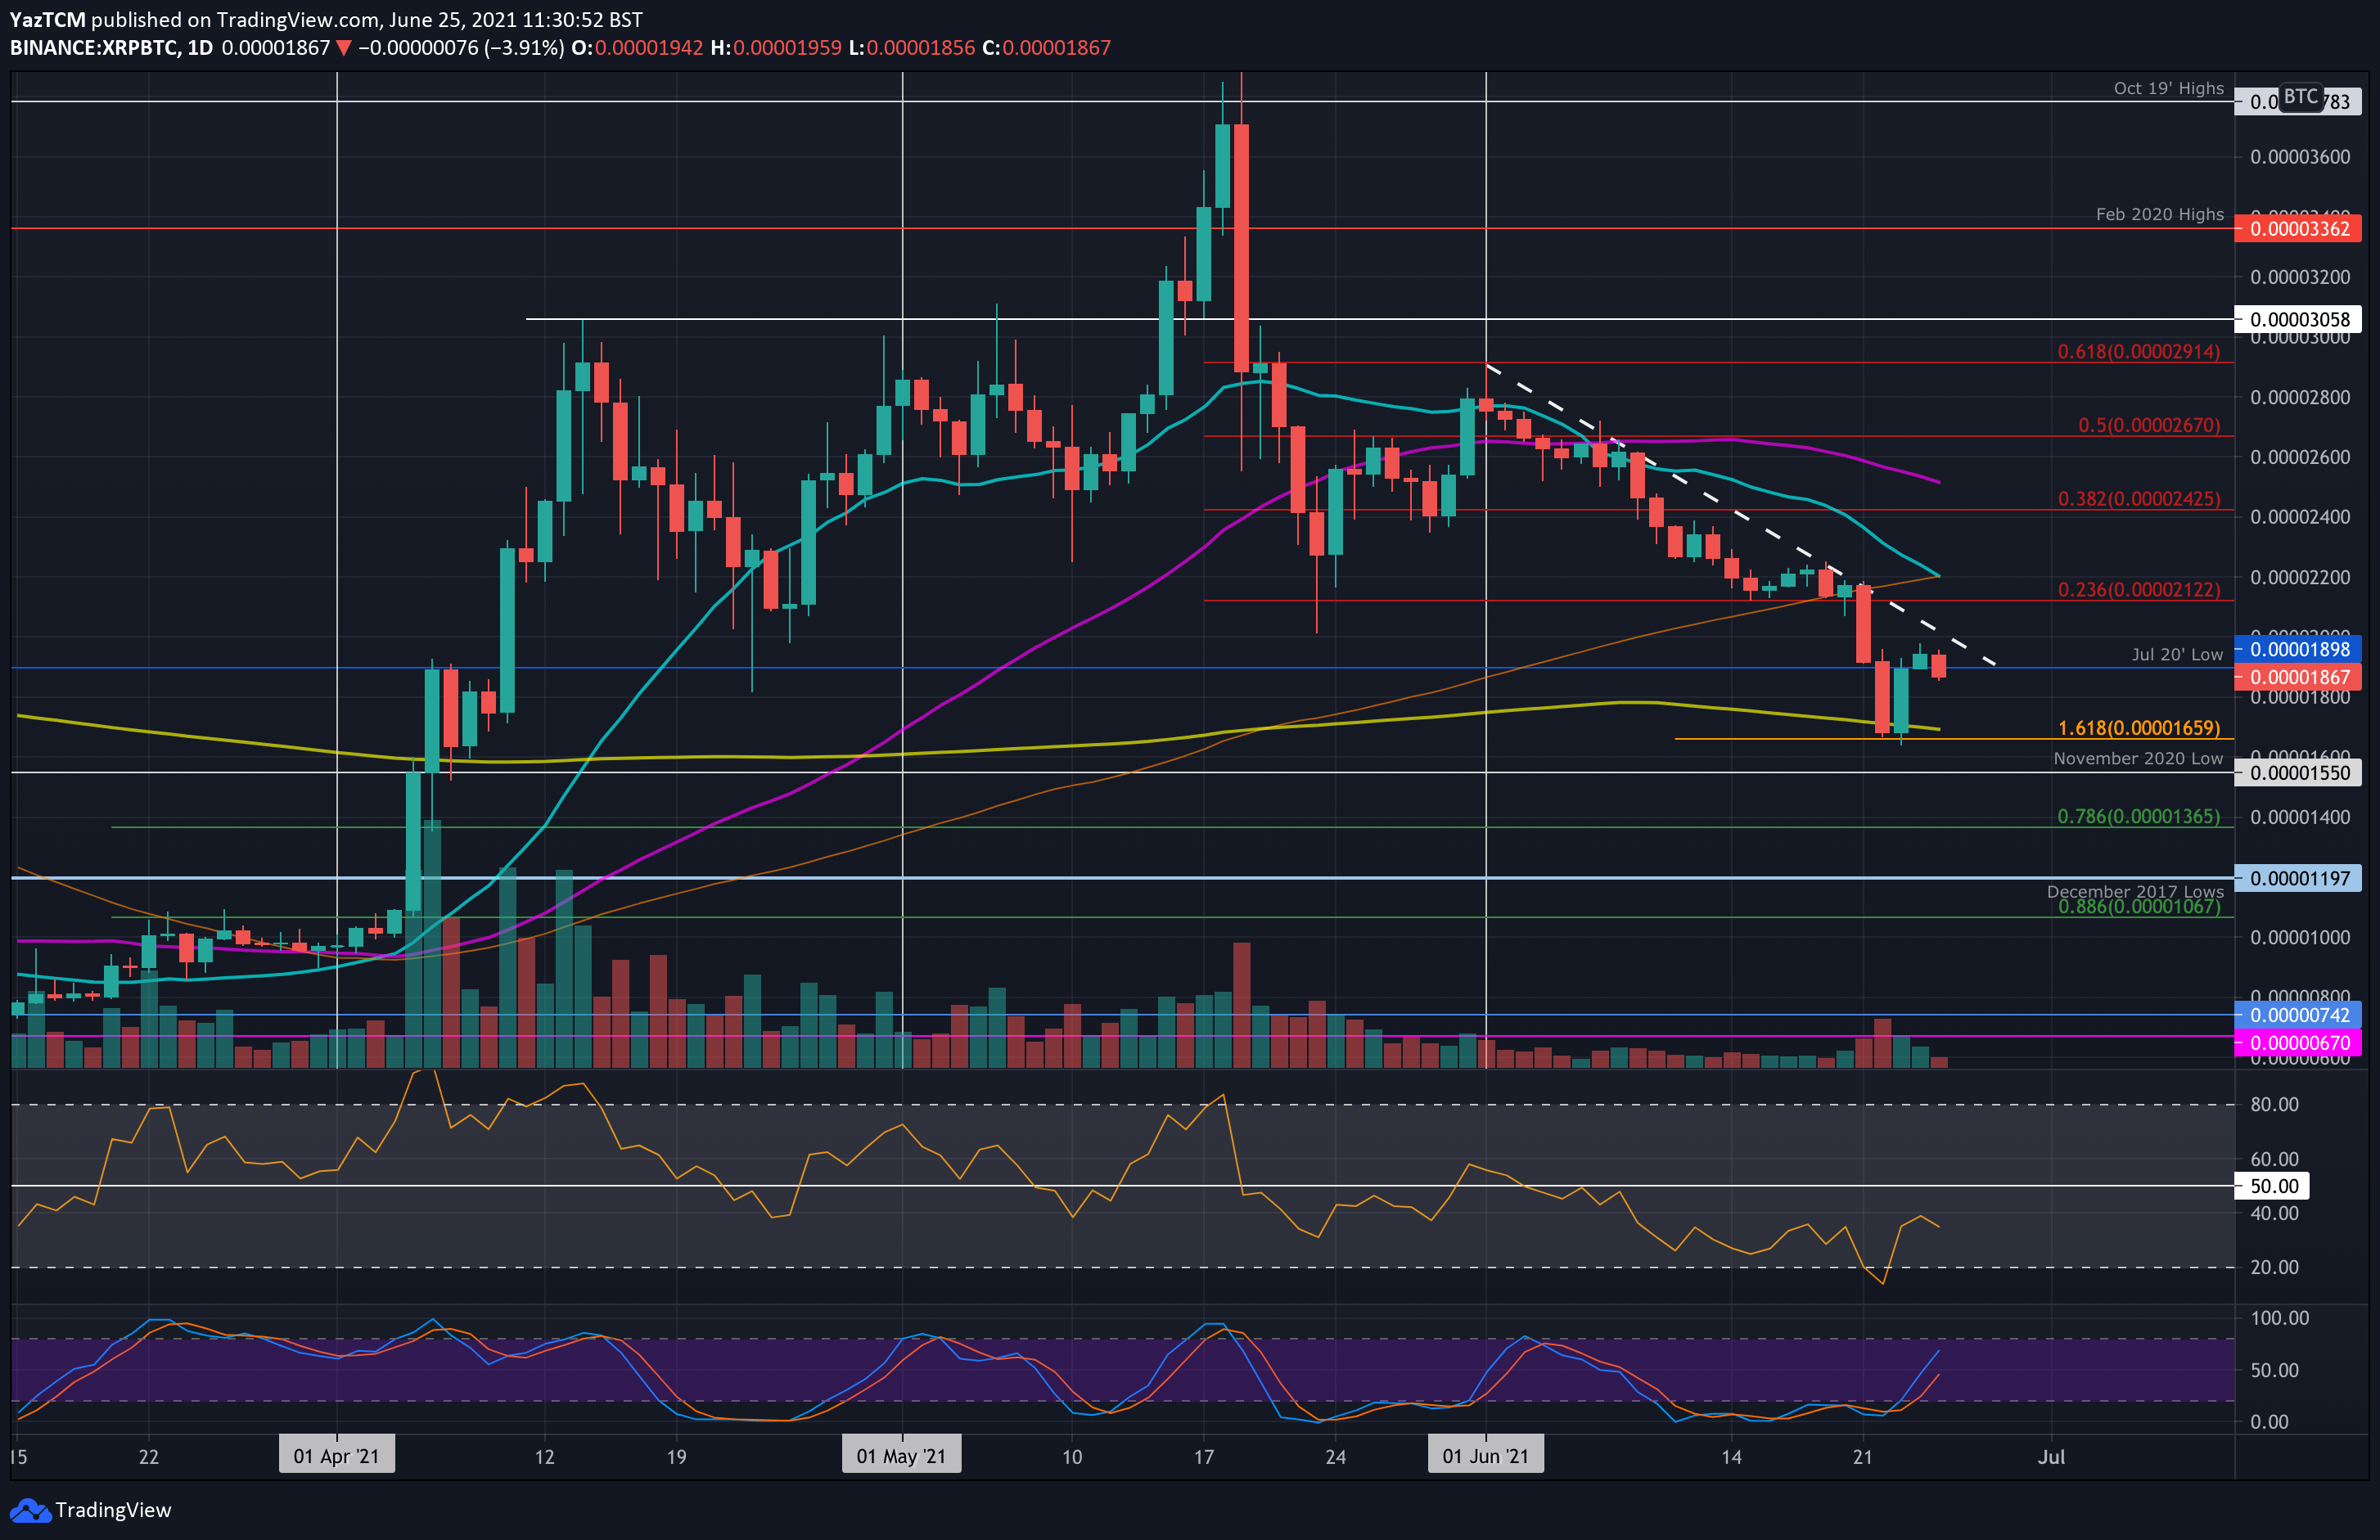
Against bitcoin, XRP set a fresh three-month low this week as it broke beneath the 2200 SAT (100-day MA) support and plummeted beneath the July 2020 lows at 1900 SAT to reach 1760 SAT.
There, the support provided by the 200-day MA and a downside 1.618 Fib Extension allowed XRP to rebound. However, it is still struggling to sustain itself above 1900 SAT.
Looking ahead, the first strong resistance lies at 2000 SAT. This is followed by 2122 SAT (bearish .236 Fib), 2200 SAT (100-day & 20-day MA), and 2425 SAT (bearish .382 Fib).
On the other side, the first support lies at 1800 SAT. This is followed by 1660 SAT (200-day MA), 1550 SAT (November 2020 low), and 1365 SAT (.786 Fib).
Cardano
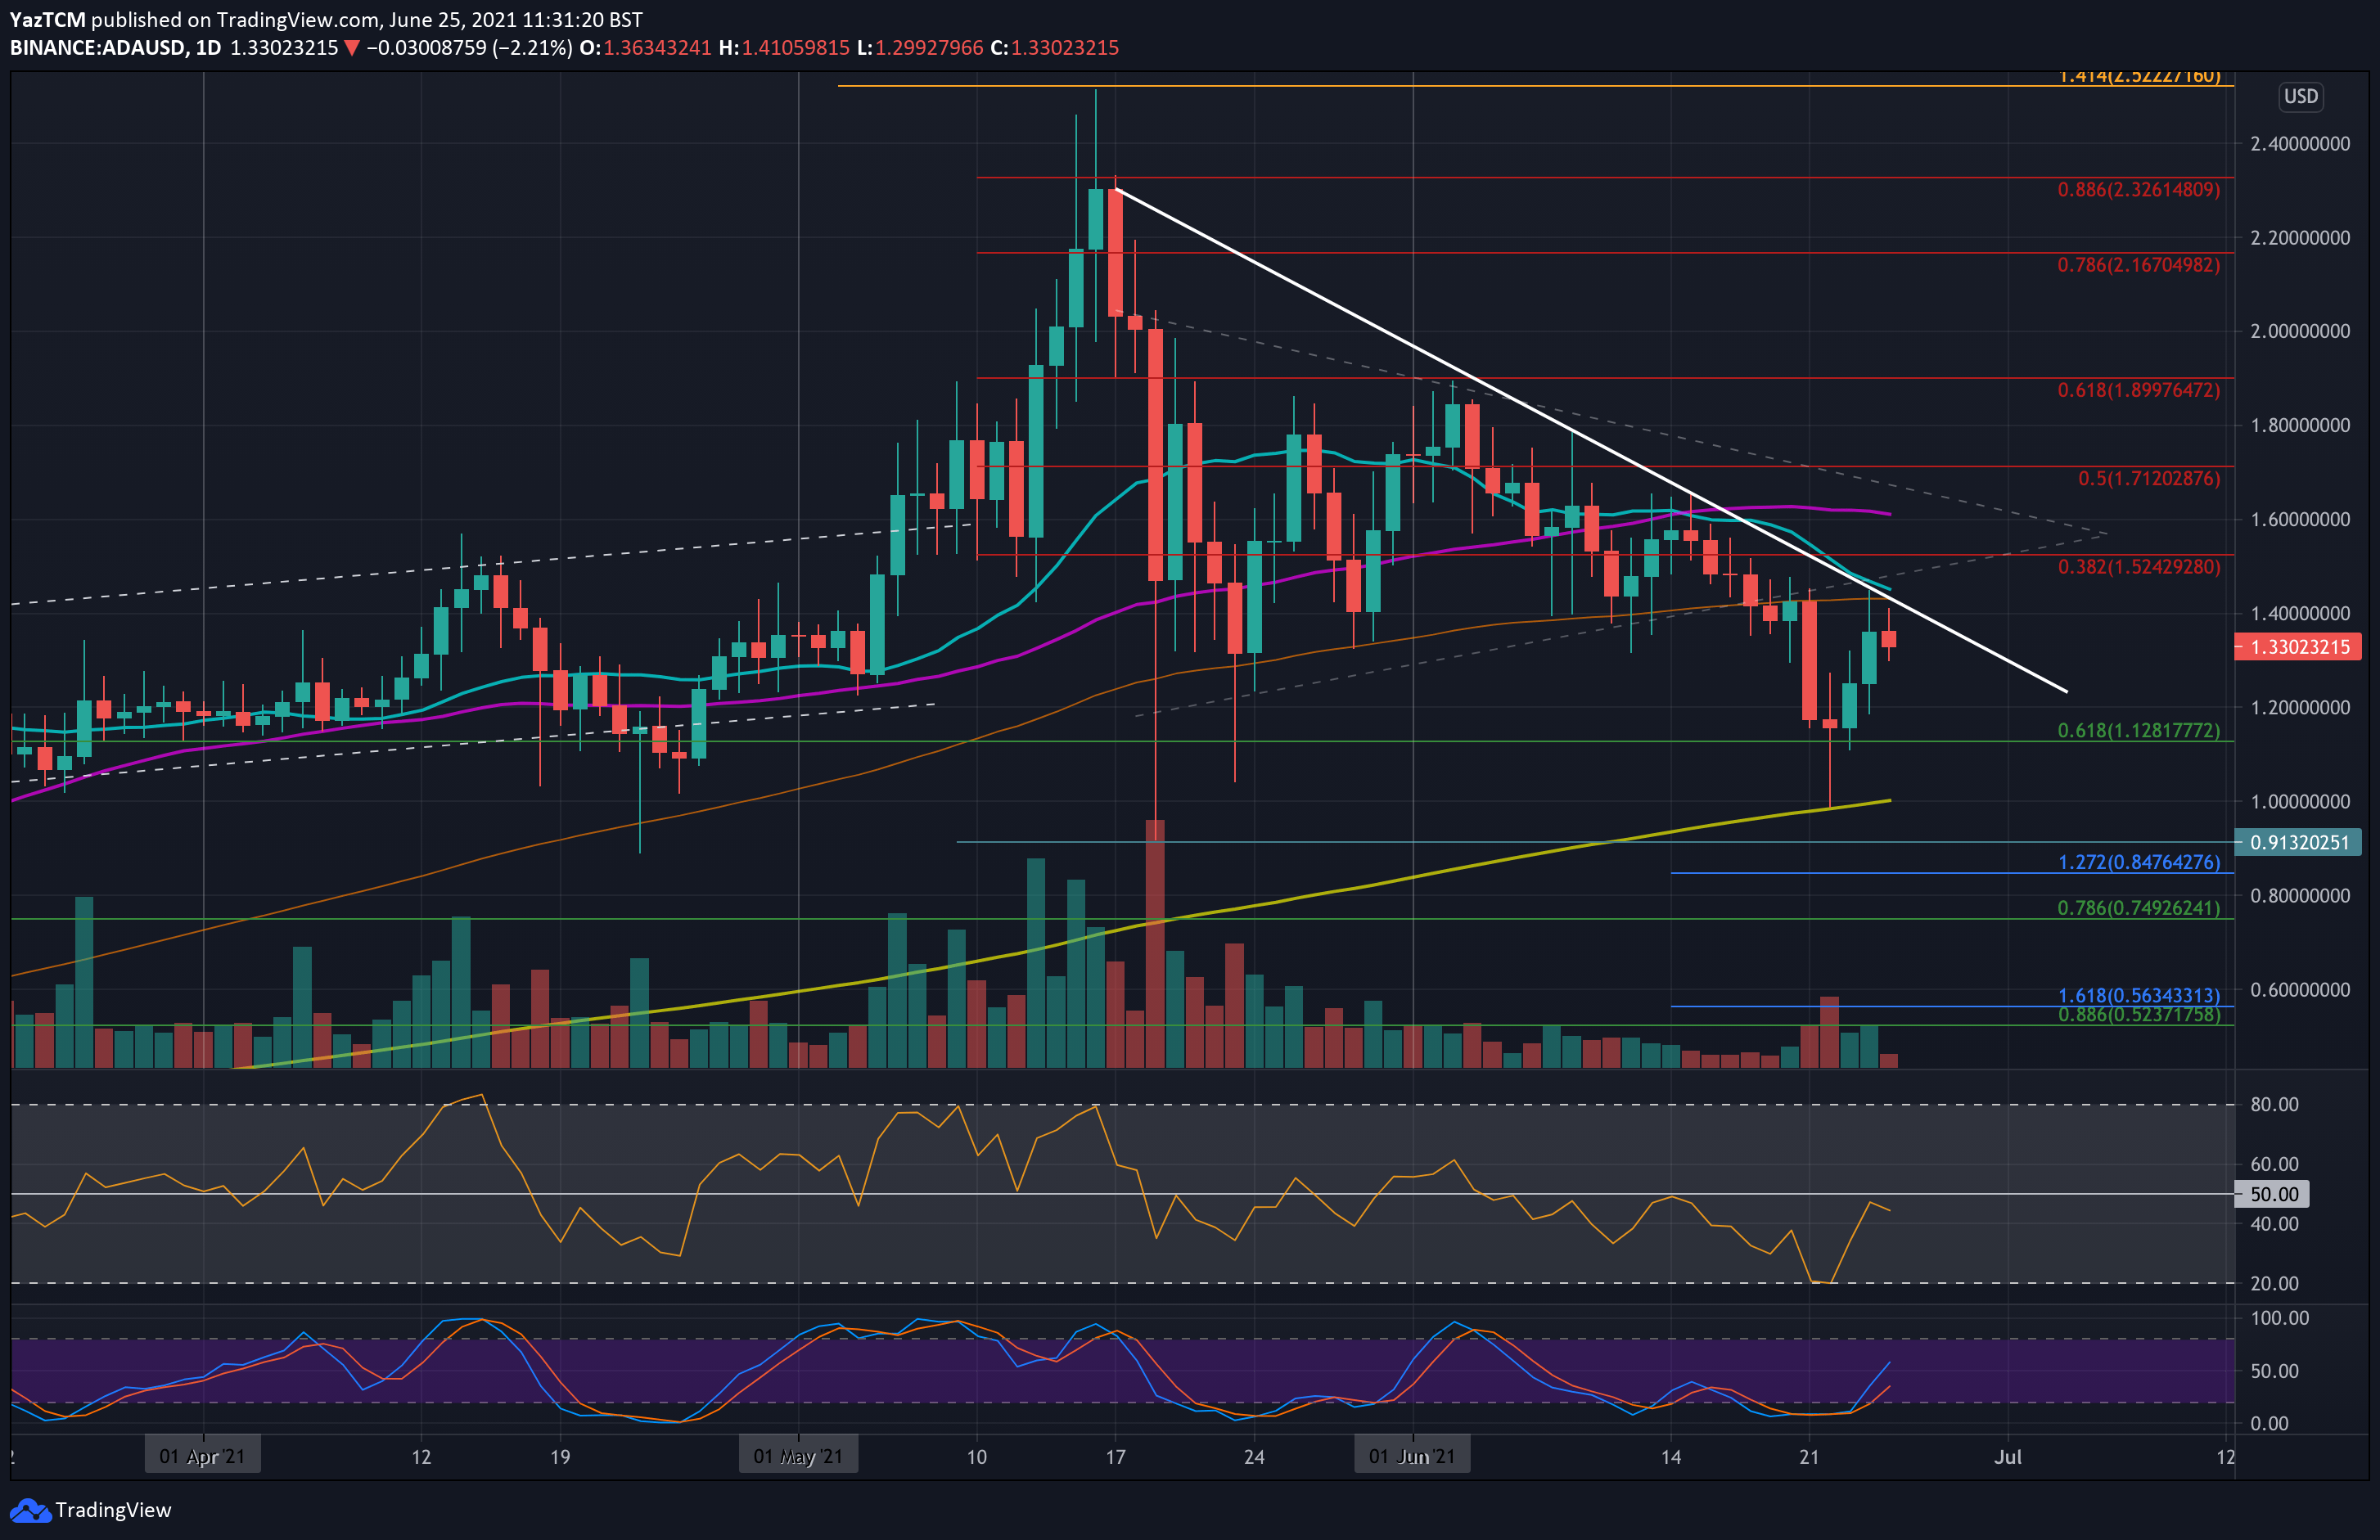
ADA dropped by a smaller 9% this week as it trades above $1.30. It had fallen from resistance at the 100-day MA around $1.42 on Monday and dropped as low as $1.00 on Tuesday.
There, it found support at the 200-day MA and quickly recovered back above $1.15 to close the daily candle. Since then, ADA pushed higher but was unable to break the 100-day MA yesterday. It is currently testing a descending trend line that dates back to the May peaks.
Looking ahead, the first resistance lies at $1.42 – provided by the falling trend line, the 20-day MA, and the 100-day MA. This is followed by $1.52 (bearish .382 Fib), $1.60 (50-day MA), and $1.71 (bearish .5 Fib).
On the other side, the first support lies at $1.120. This is followed by $1.15, $1.10, and $1.00 (200-day MA).
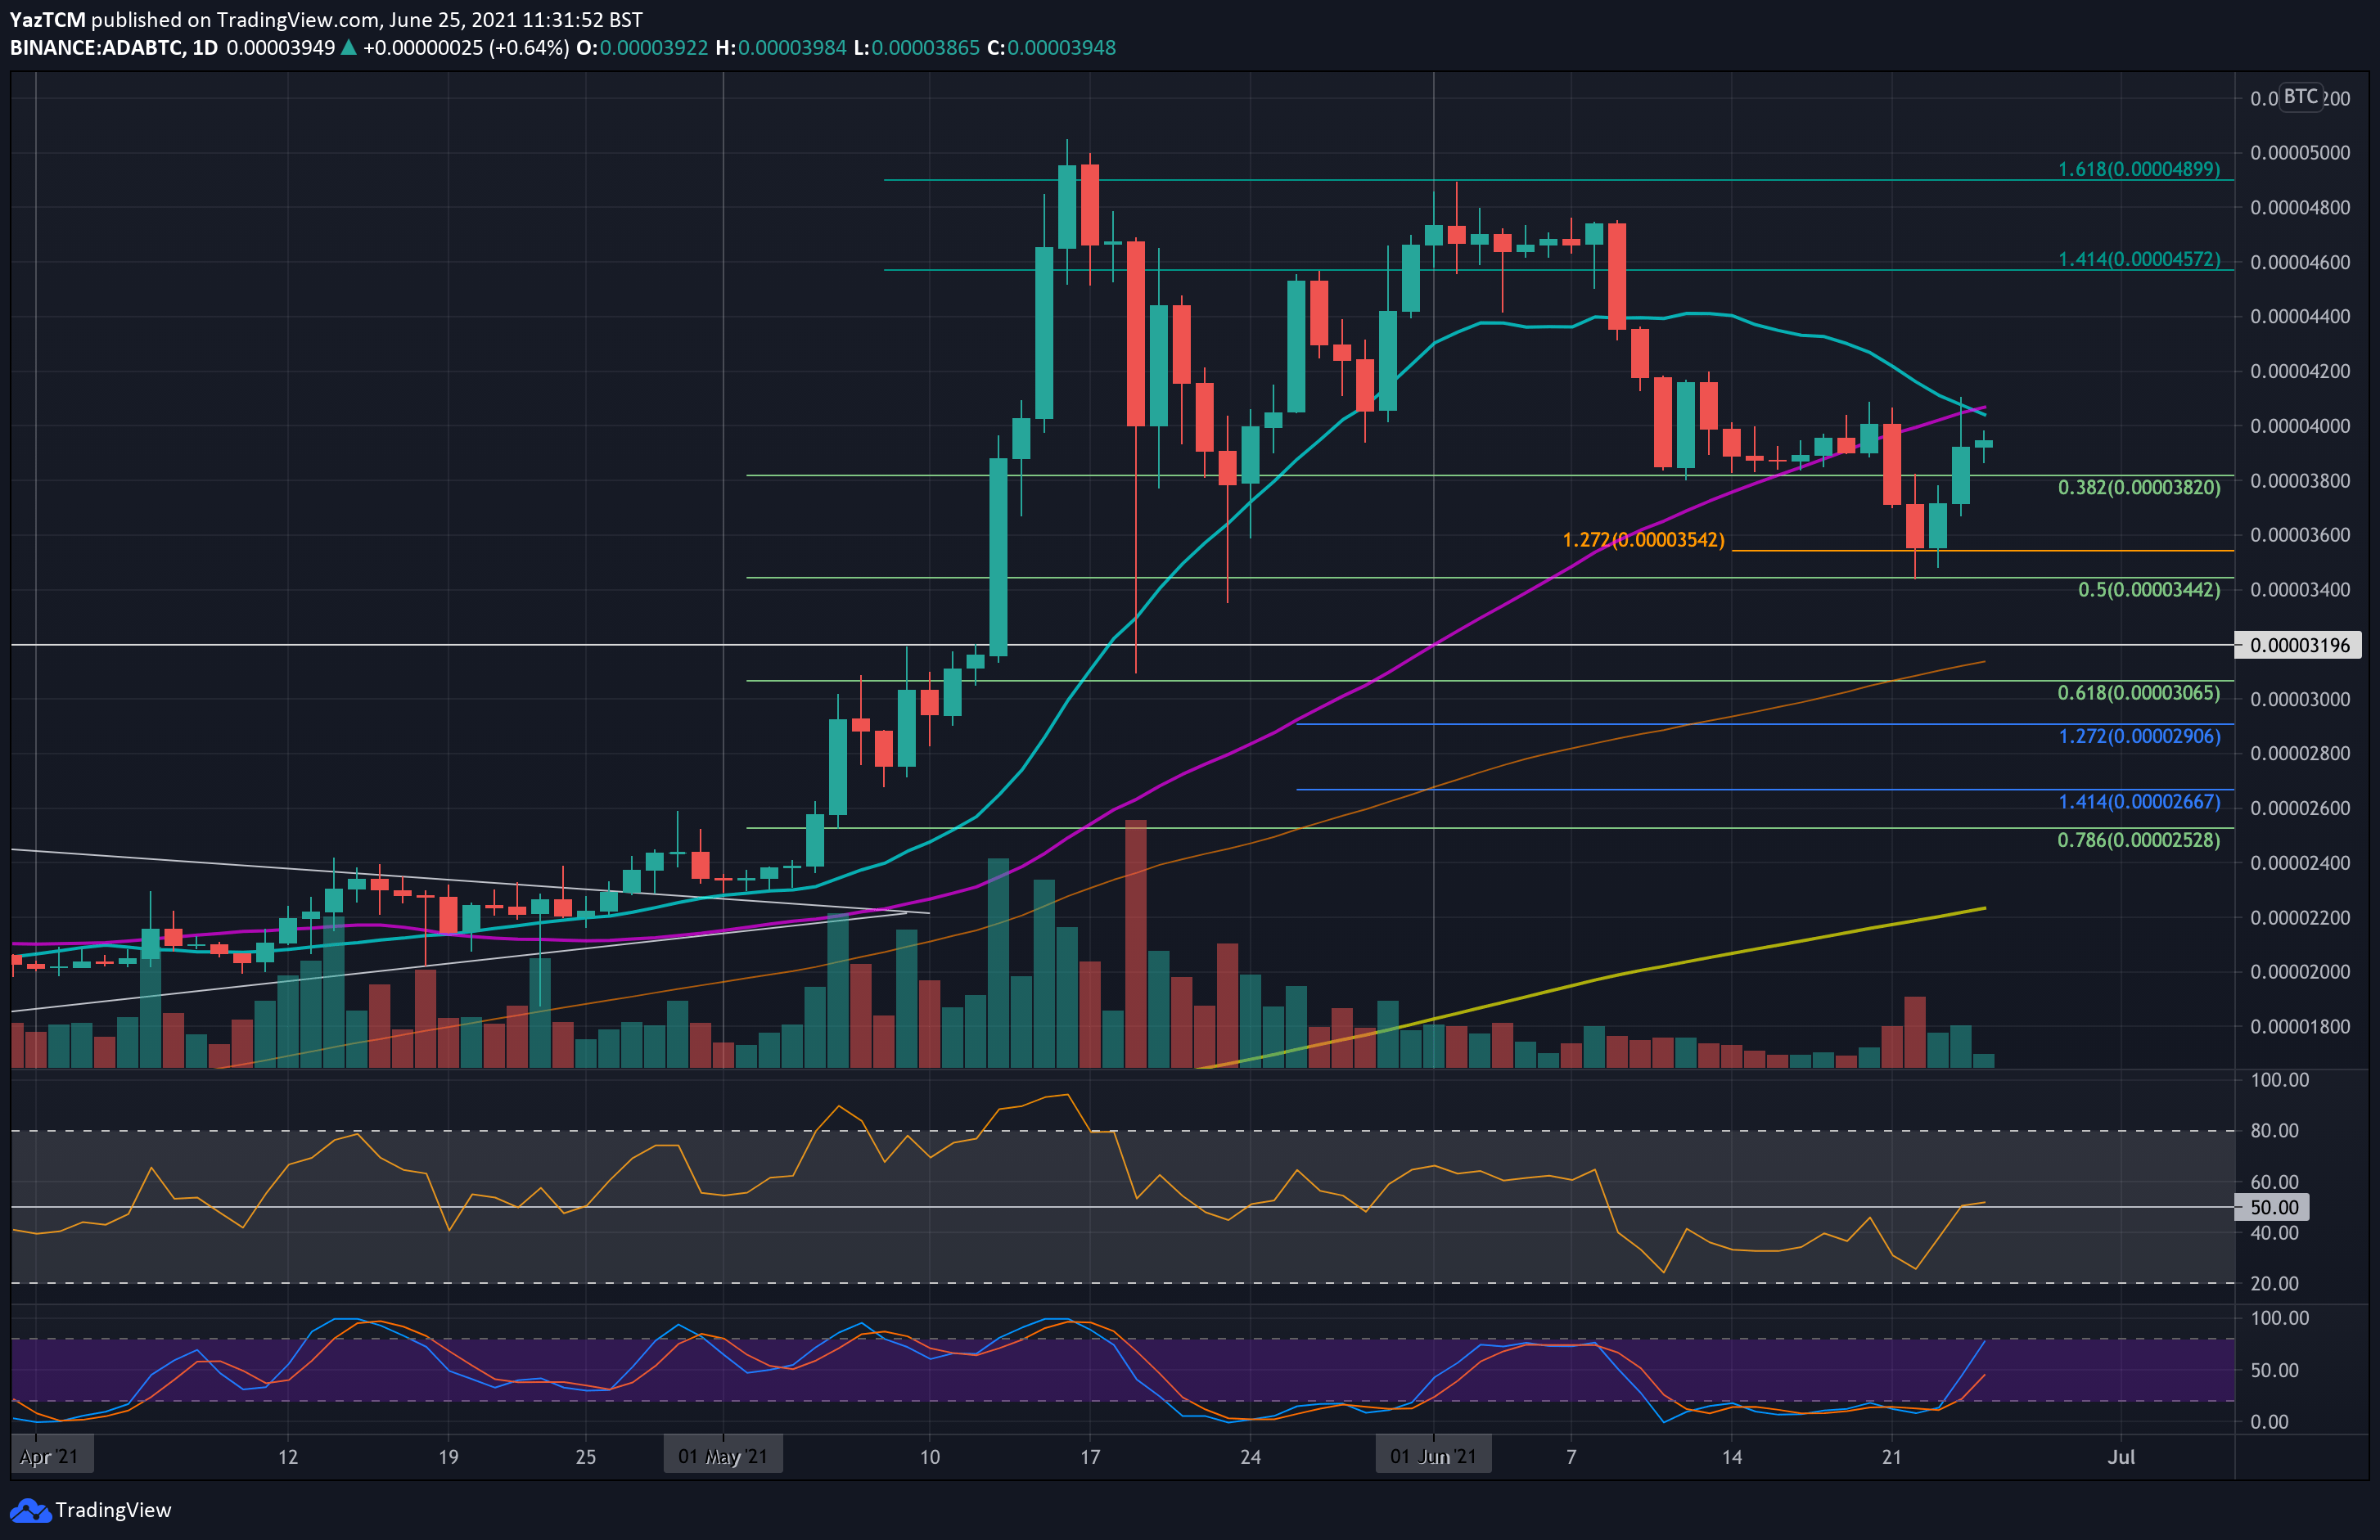
ADA is pretty neutral against BTC this week. It did drop beneath support at 3820 SAT (.382 Fib) on Monday and fell as low as 3440 SAT (.5 Fib) on Tuesday. However, the bulls regrouped and allowed the daily candle to close above 3540 SAT (downside 1.272 Fib Extension).
From there, it has pushed back above the 3820 SAT support but is struggling to make ground beyond 4000 SAT.
Looking ahead, the first resistance lies at 4000 SAT (20-day & 50-day MA). This is followed by 4200 SAT, 4400 SAT, 4570 SAT (1.414 Fib Extension), and 4900 SAT (1.618 Fib Extension & June highs).
On the other side, the first support lies at 3820 SAT (.382 Fib). This is followed by 3540 SAT (downside 1.414 Fib Extension), 3440 SAT (.5 Fib), 3200 SAT (100-day MA), and 3060 SAT (.618 Fib).
Polkadot
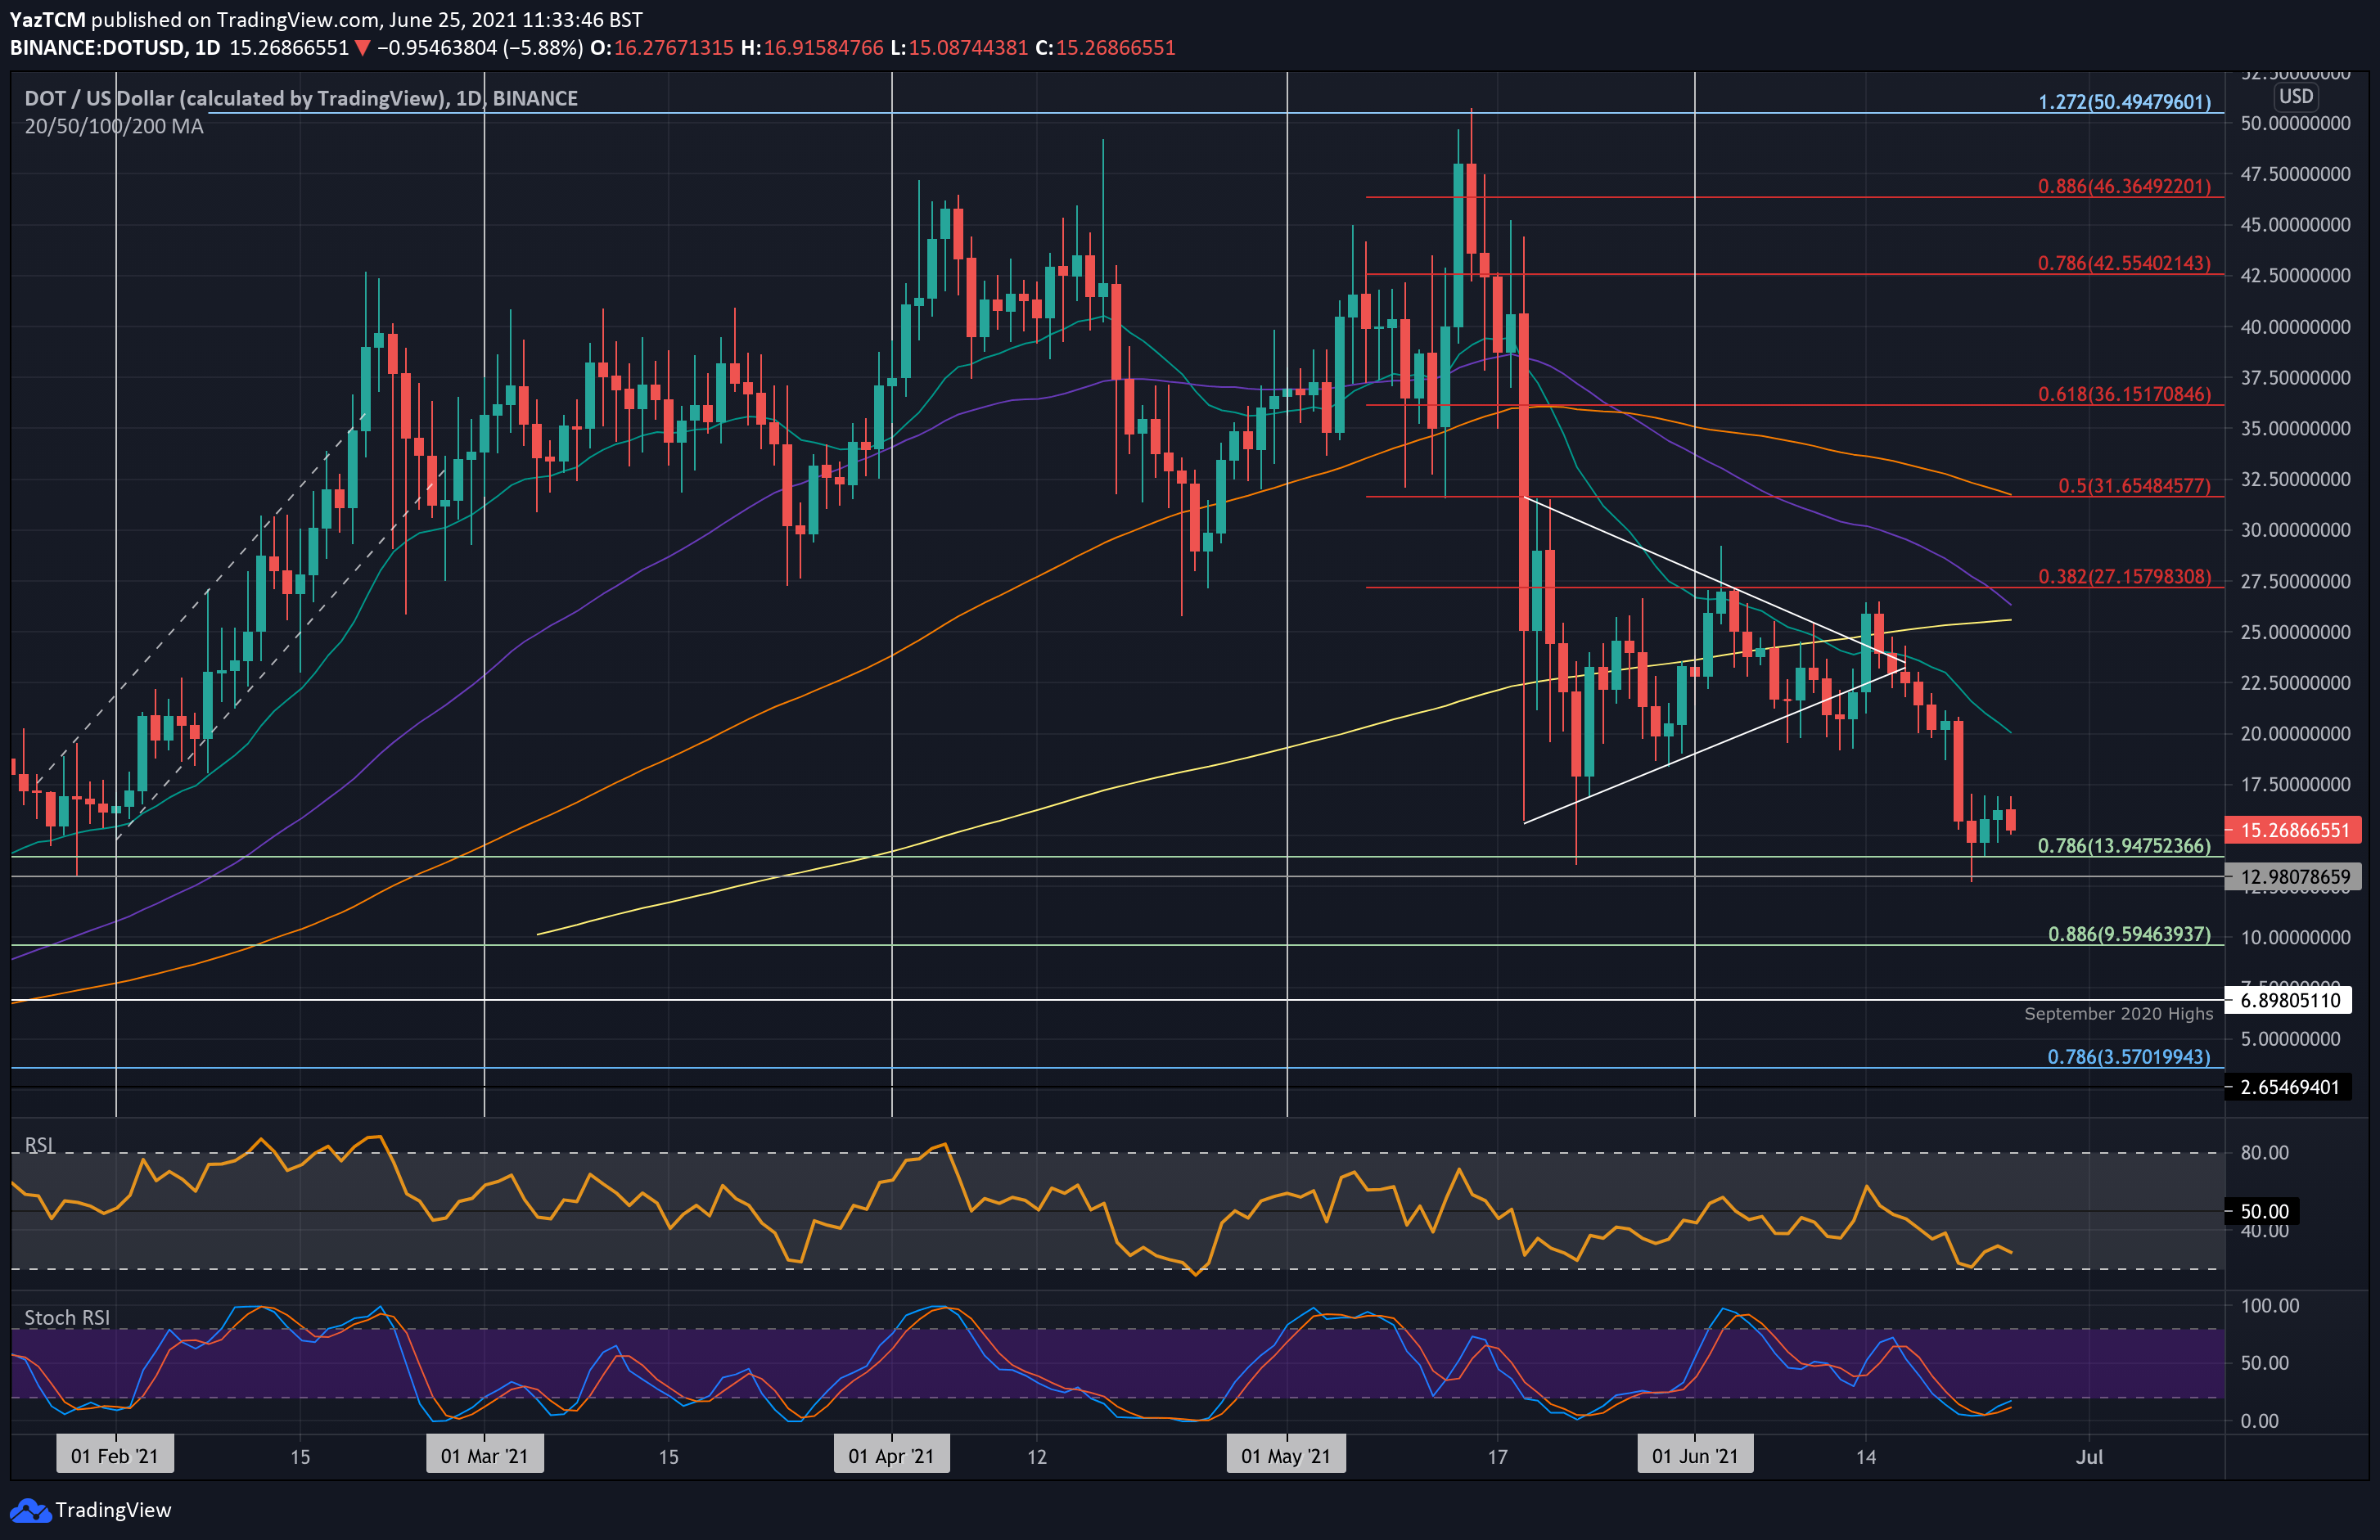
DOT is down by 32% this week as it trades around $15. The coin fell from above $20 on Monday to reach $13 on Tuesday. The buyers did manage to defend support around $14, provided by a .786 Fib Retracement.
Unfortunately, the bulls have been unable to push much past $17 since rebounding, and the market is looking like it will head lower again.
If the sellers push lower, the first support lies at $14 (.786 Fib). This is followed by $13, $10 (.886 Fib), and $6.90 (Sep 2020 highs).
On the other side, the first resistance lies at $17. This is followed by $20 (20-day MA), $22.5, and $25 (200-day MA).
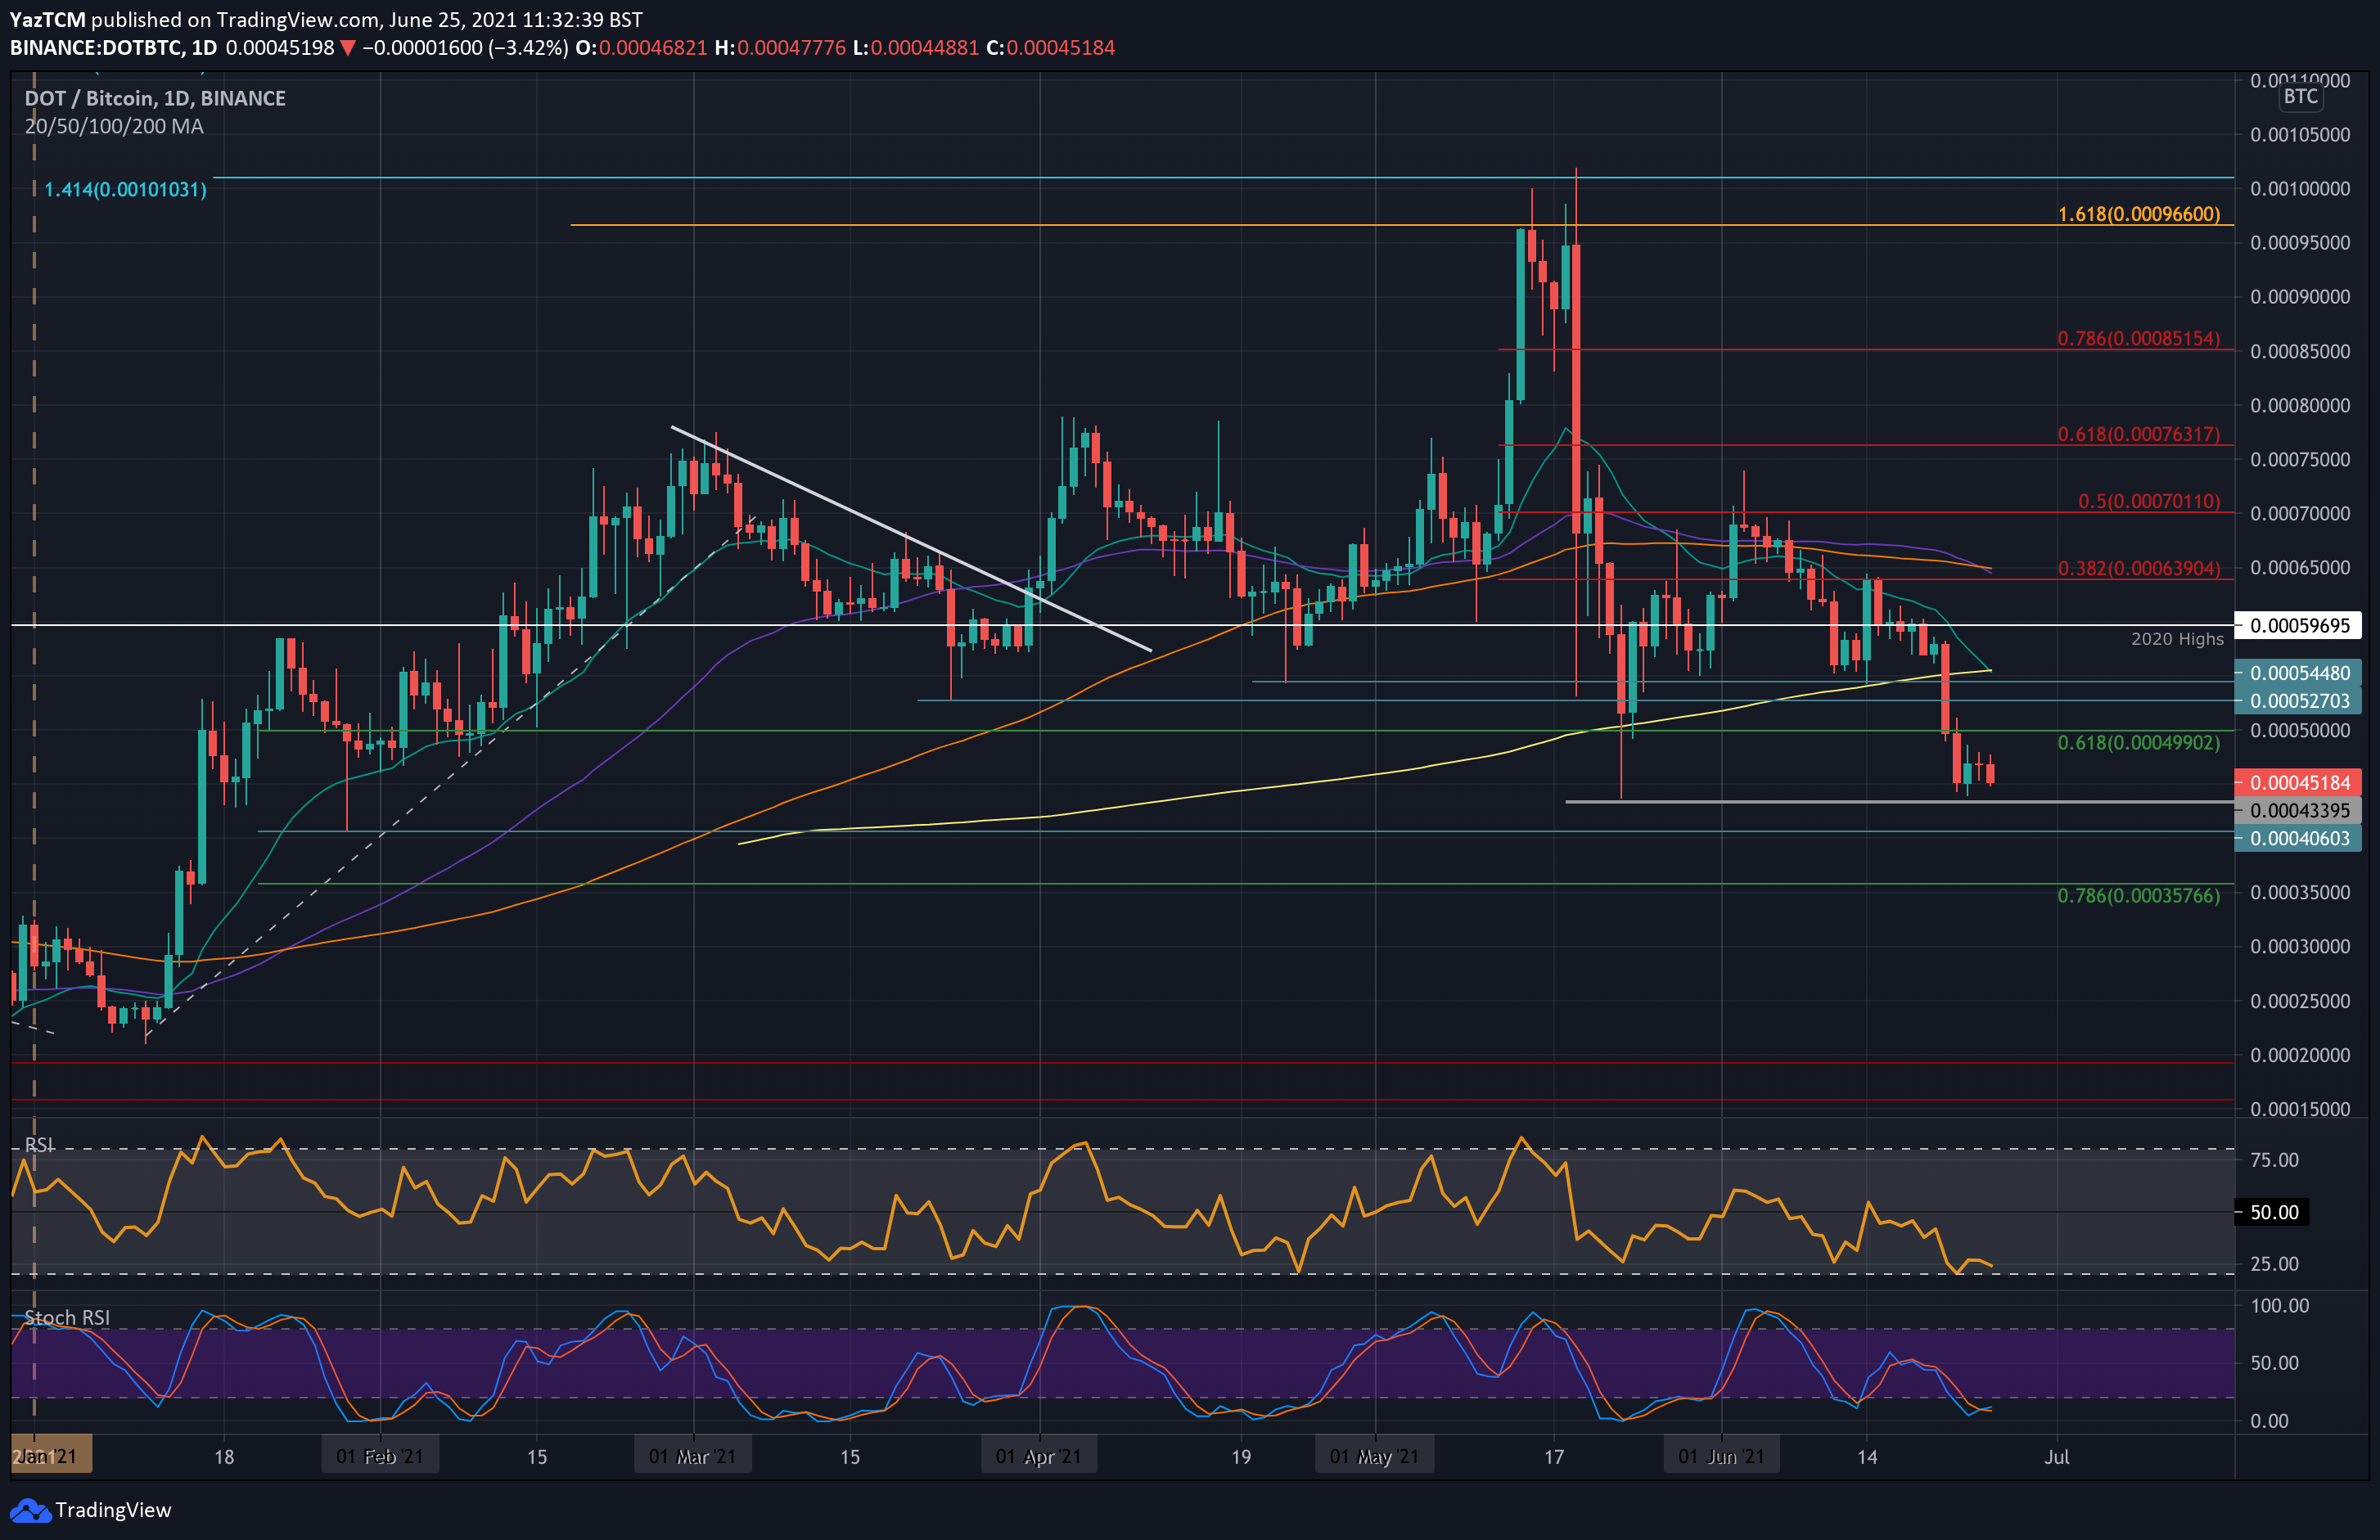
Dot is also struggling against BTC this week as it dropped beneath the 200-day MA around 54,500 SAT and continued lower to meet support at 45,000 SAT on Tuesday.
Since then, the market has moved sideways, unable to really push higher again.
Looking ahead, the first support beneath 45,000 SAT lies at 44,000 SAT (May lows). This is followed by 40,600 SAT, 40,000 SAT, and 35,770 SAT (.786 Fib).
On the other side, the first strong resistance lies at 50,000 SAT. This is followed by 52,700 SAT, 55,000 SAT (200-day & 20-day MA), and 60,000 SAT.