It was a tough week in the cryptocurrency market as the majority of it is in the red. The big exception this week is THETA which skyrocketed and found a place in the top 10.BitcoinBitcoin is down by a total of 8% over the past week of trading as the cryptocurrency currently trades at ,330. It attempted to break resistance at ,000 last weekend but failed. As a result, it started to head lower on Sunday and went on to break beneath the March ascending trend line on Monday.After that, Bitcoin started to plummet throughout the week. Initially, it held support at ,500 but continued beneath there on Wednesday to reach ,540 (.618 Fib). Yesterday, Bitcoin continued decreasing below ,540 but found solid support at the 50-day MA level (blue line).Today, BTC rebounded from the 50-day
Topics:
Yaz Sheikh considers the following as important: ADABTC, ADAUSD, Bitcoin (BTC) Price, BTC Analysis, BTCEUR, BTCGBP, btcusd, btcusdt, Cardano (ADA) Price, ETH Analysis, ETHBTC, Ethereum (ETH) Price, ethusd, Price Analysis, theta, THETABTC, THETAUSD, UNIBTC, uniswap, UNIUSD
This could be interesting, too:
Mandy Williams writes Bitcoin ETFs Record Over .6B in Outflows in the Past 2 Weeks
Dimitar Dzhondzhorov writes Millions of ADA Sold by Cardano Whales During Market Crash – Will the Decline Continue?
Chayanika Deka writes Bitcoin Whales Offload 6,813 BTC as Selling Pressure Mounts
Wayne Jones writes Bitcoin Sentiment Hits 2022 Lows as Fear & Greed Index Falls to 10
It was a tough week in the cryptocurrency market as the majority of it is in the red. The big exception this week is THETA which skyrocketed and found a place in the top 10.

Bitcoin
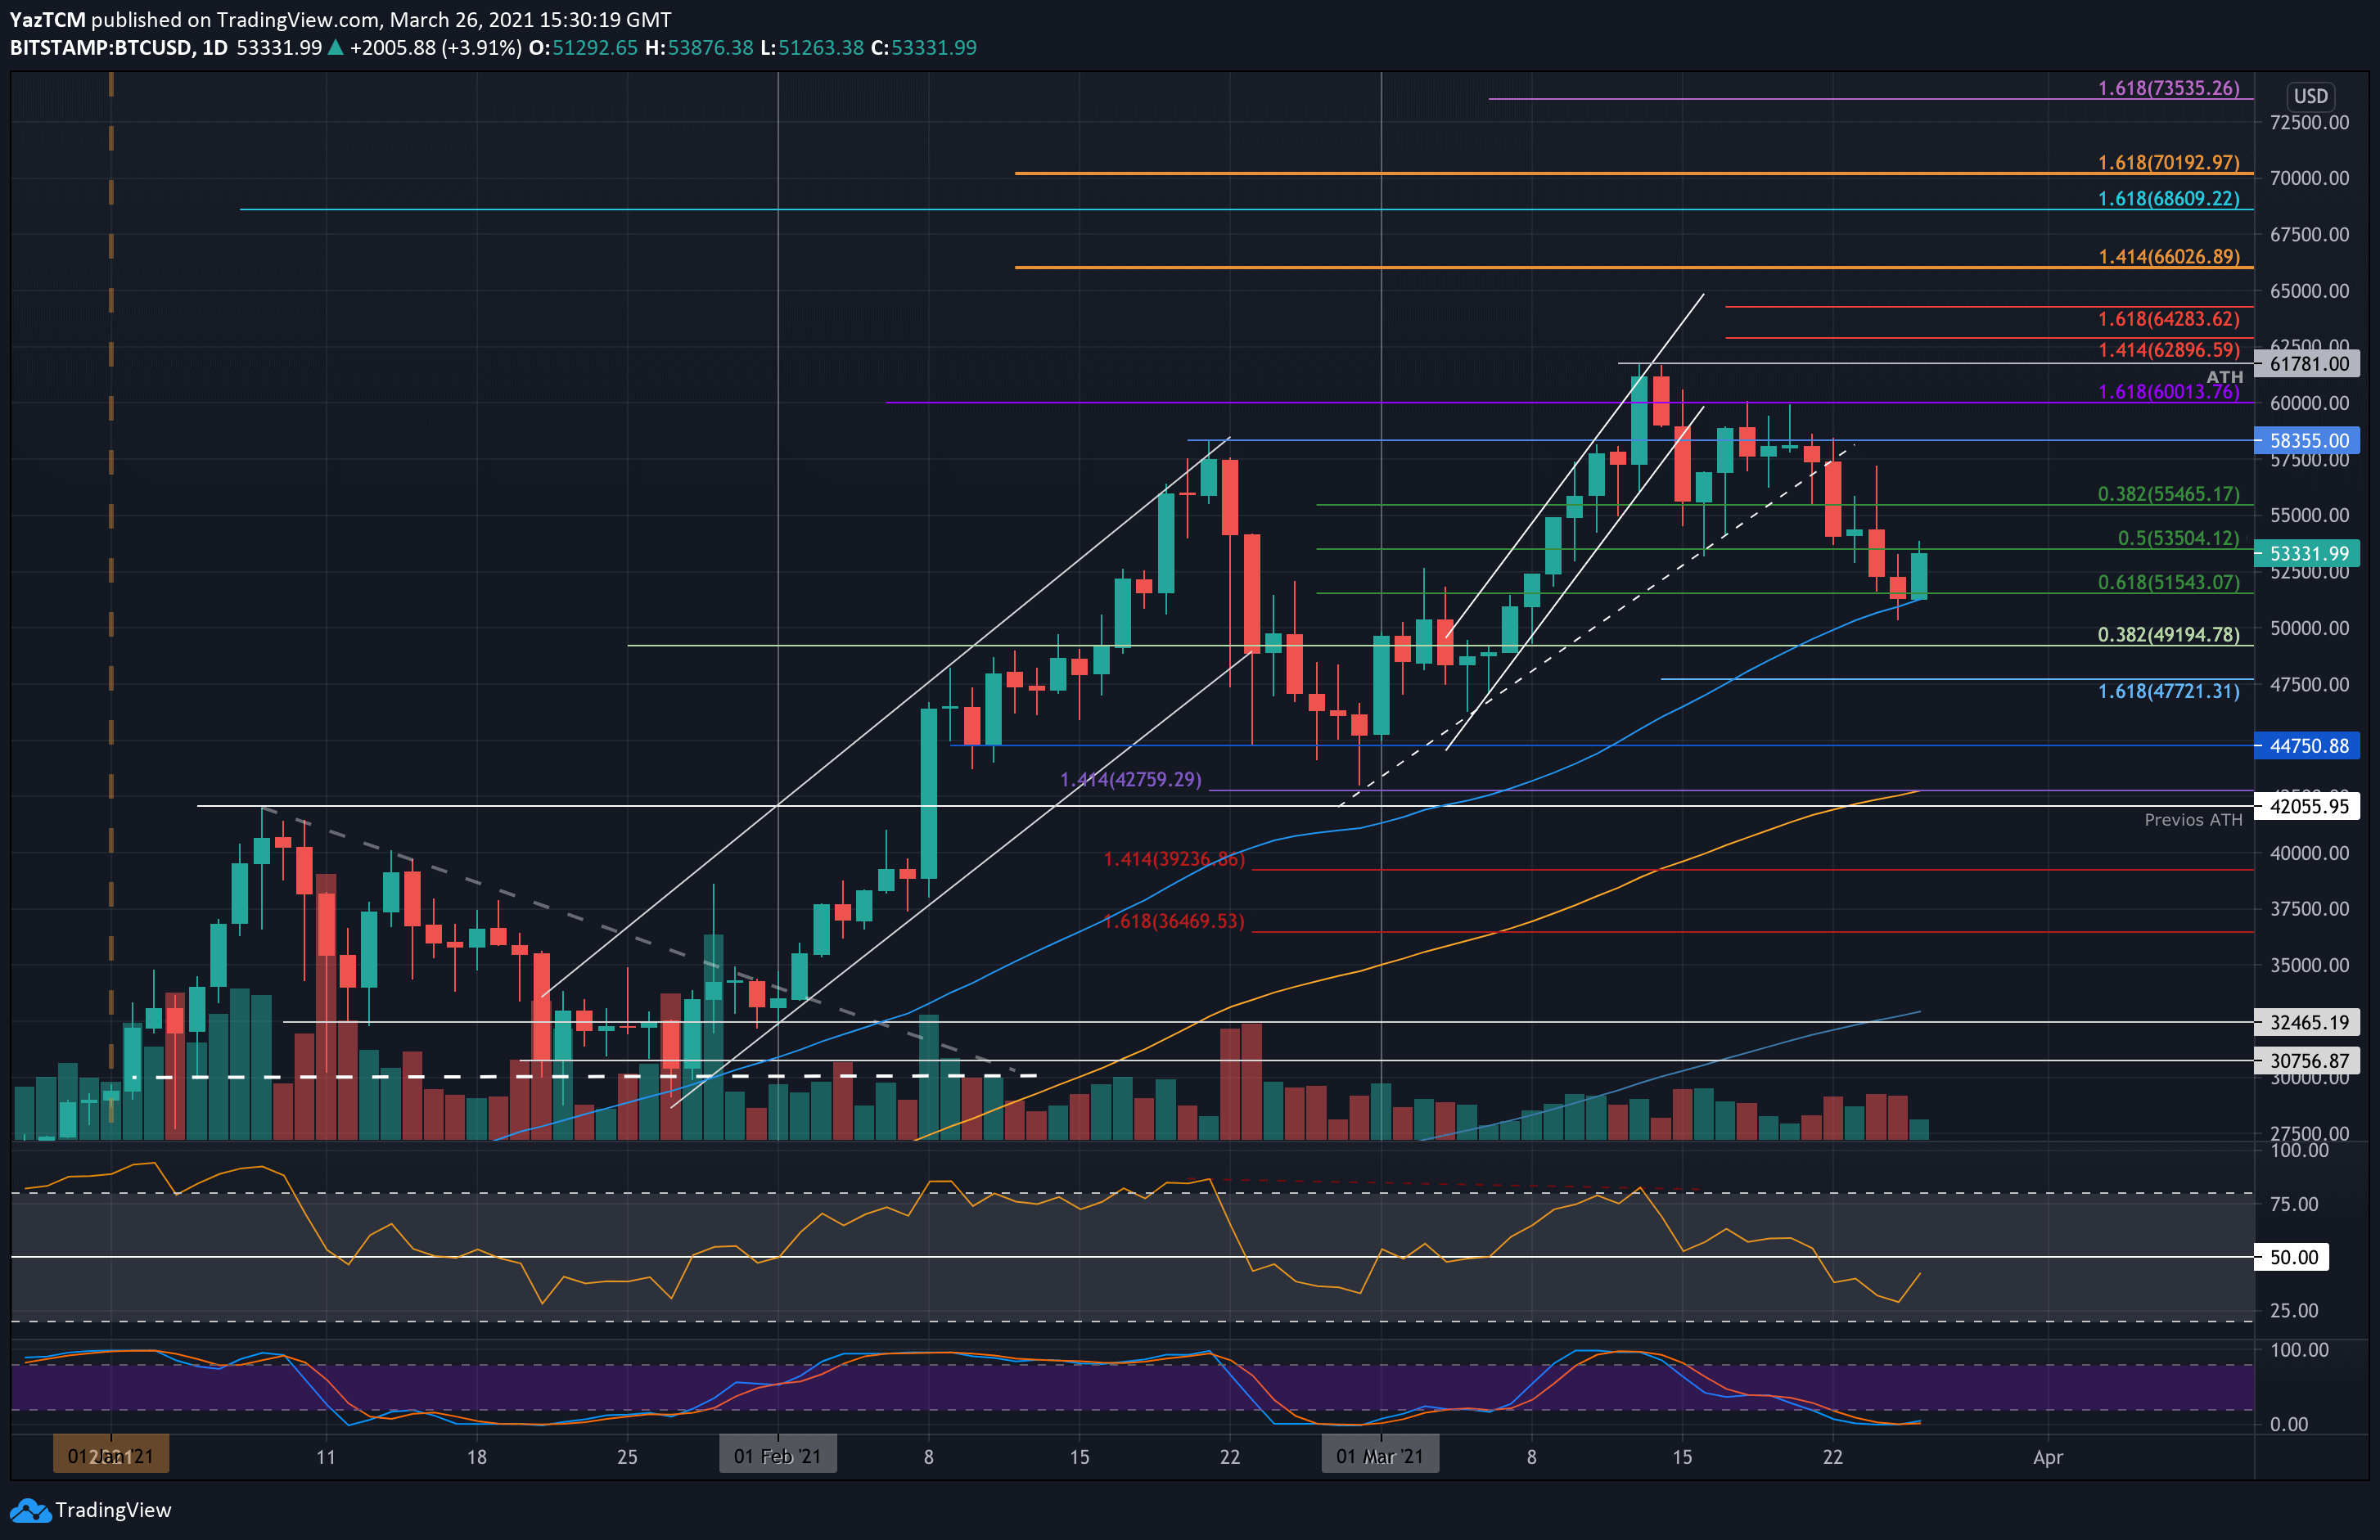
Bitcoin is down by a total of 8% over the past week of trading as the cryptocurrency currently trades at $53,330. It attempted to break resistance at $60,000 last weekend but failed. As a result, it started to head lower on Sunday and went on to break beneath the March ascending trend line on Monday.
After that, Bitcoin started to plummet throughout the week. Initially, it held support at $53,500 but continued beneath there on Wednesday to reach $51,540 (.618 Fib). Yesterday, Bitcoin continued decreasing below $51,540 but found solid support at the 50-day MA level (blue line).
Today, BTC rebounded from the 50-day MA and surged by a total of 3.5% to reach the current $53,330 level.
Looking ahead, the first level of resistance is expected at $55,000. This is followed by $57,700, $58,355, and $60,000. Above $60,000, resistance lies at $61,781 (ATH price), $62,900 (1.414 Fib Extension – red), and $64,283 (1.618 Fib Extension – red).
On the other side, the first level of support lies at $52,500. This is followed by $51,540 (.618 Fib & 50-day MA), $50,000, and $47,720 (downside1.618 Fib Extension).
Ethereum
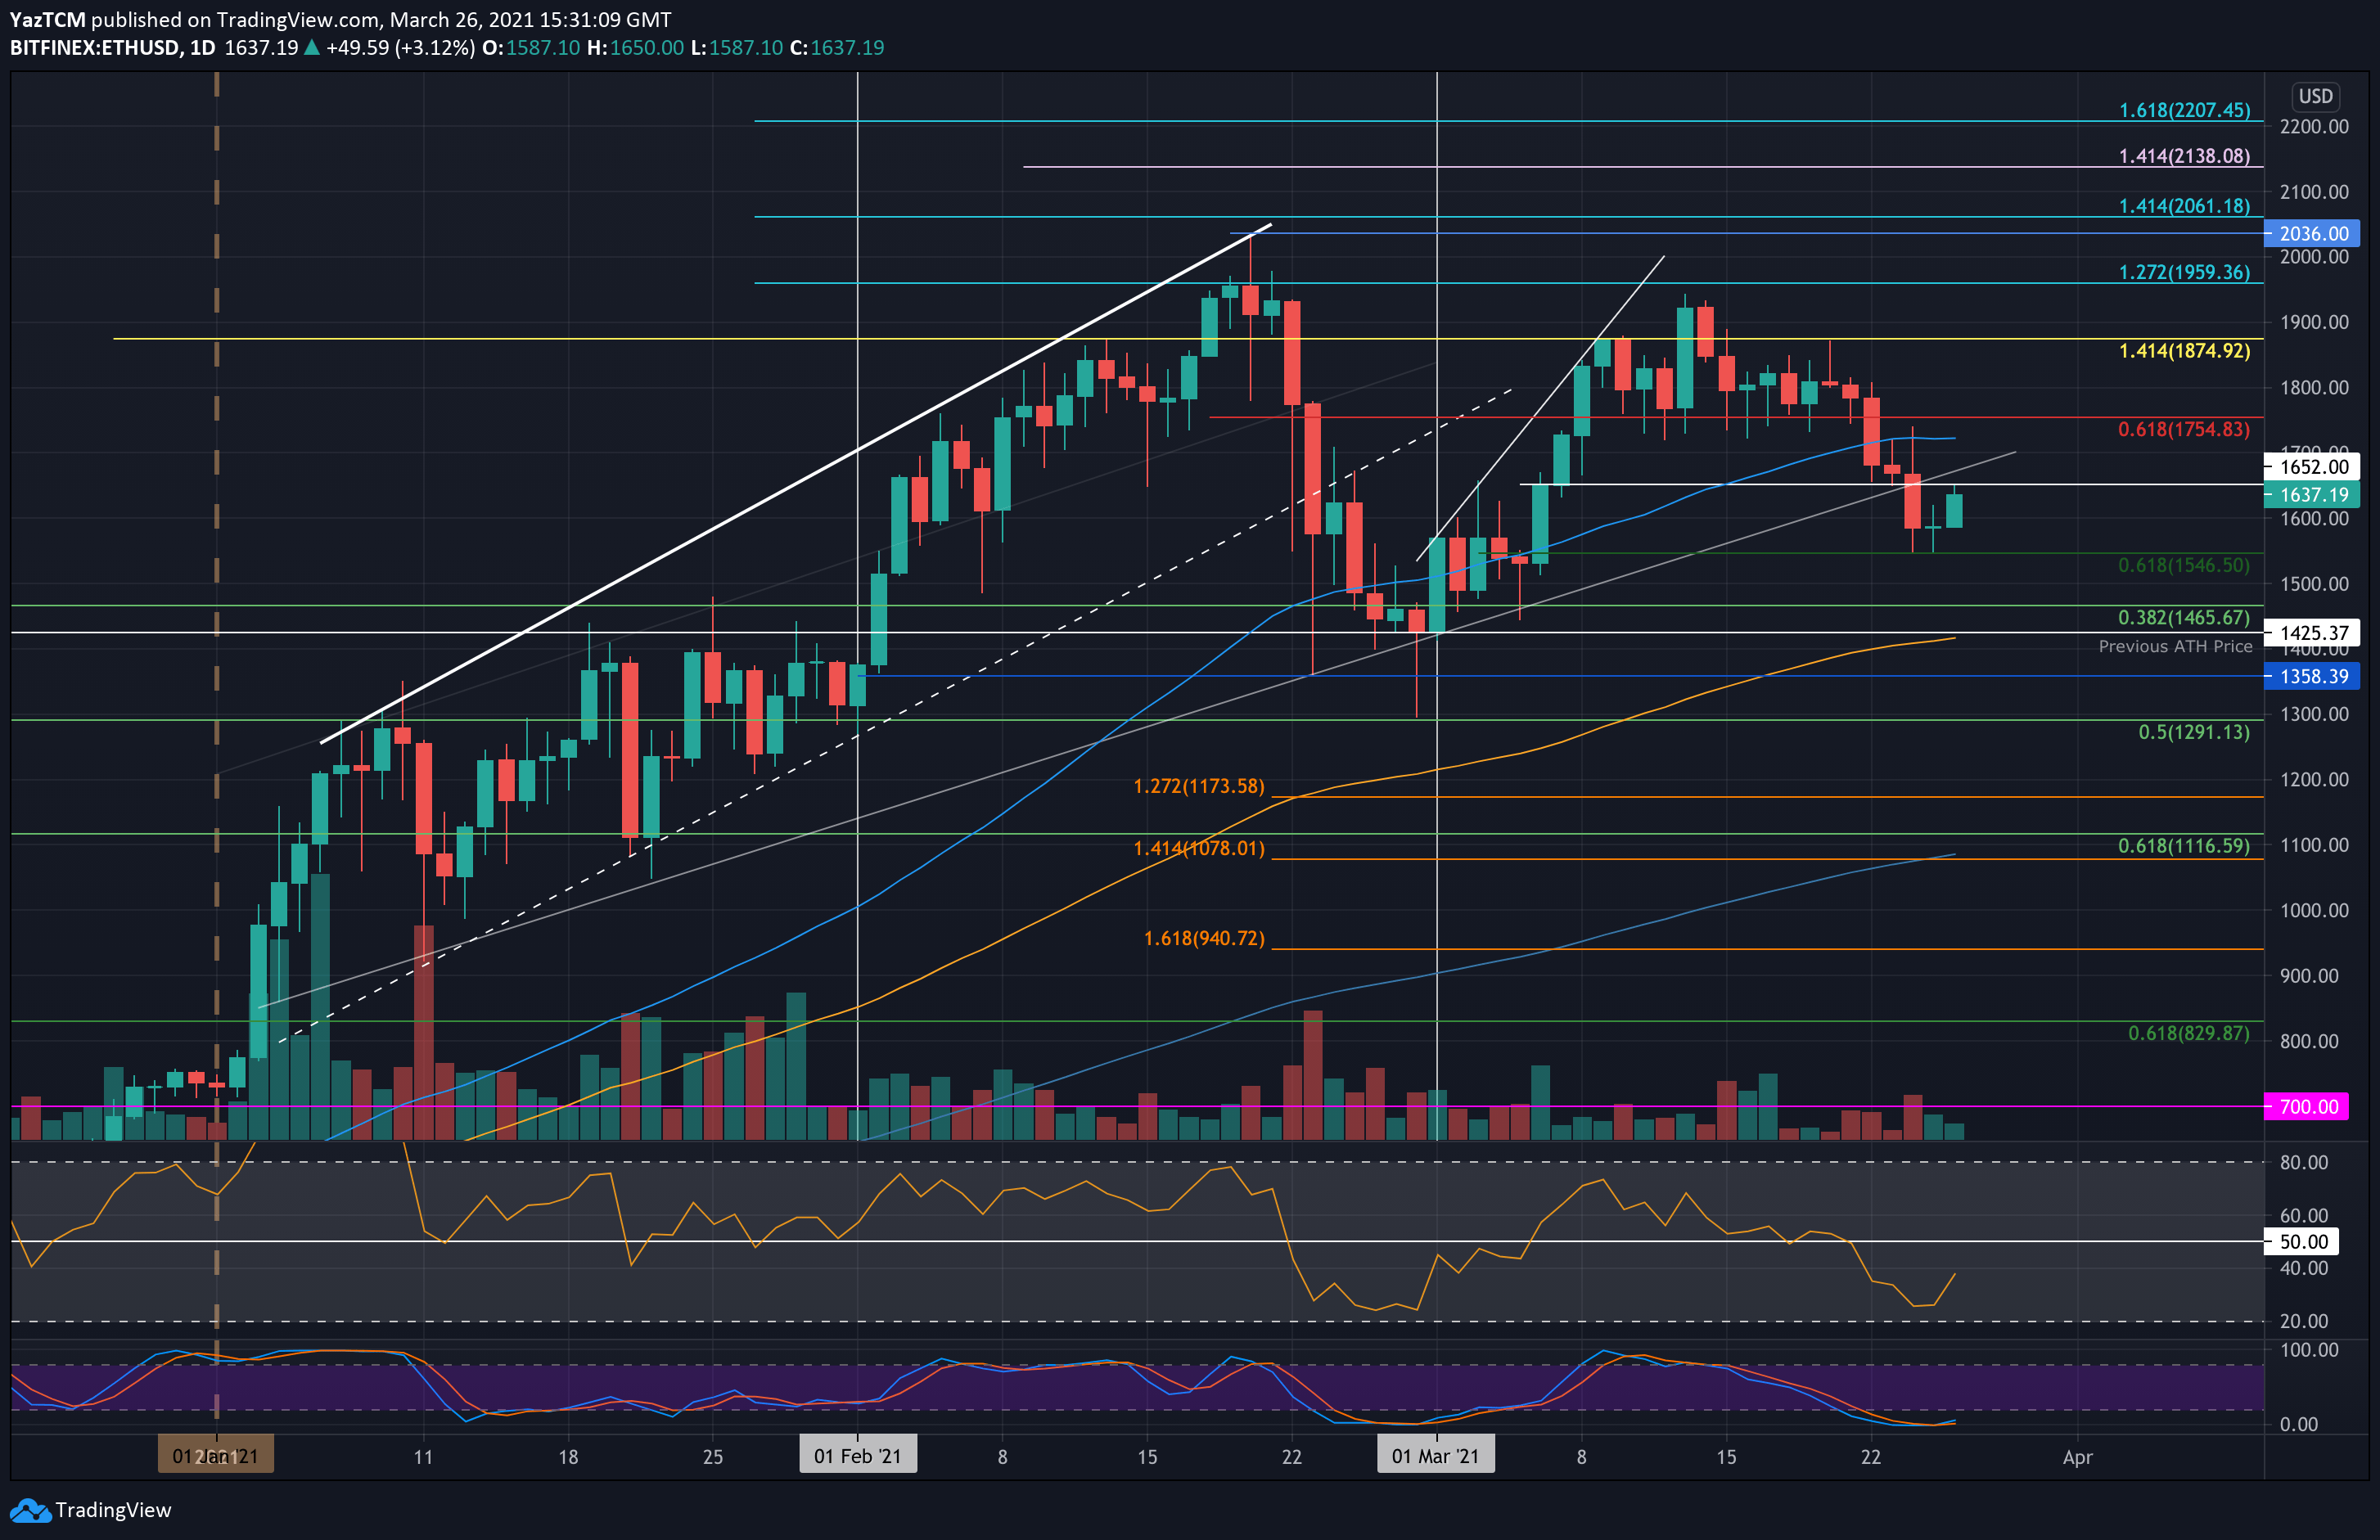
Ethereum is also down by a total of 8% over the past week of trading as it currently trades at $1637. The cryptocurrency attempted to break resistance at $1875 last weekend but could not break above. It went on to drop beneath the March support at $1755 on Monday as it started to plummet.
On Wednesday, ETH fell beneath the 2021 ascending trend line and continued to decrease until support was found at $1546 (.618 Fib). It rebounded higher from there to reach the current $1637 level.
Looking ahead, the first level of resistance lies at $1652. This is followed by $1700, $1755, $1800, and $1875.
On the other side, the first support lies at $1600. This is followed by $1546 (.618 Fib), 41500, $1465, and $1425 (previous ATH price & 100-days EMA).
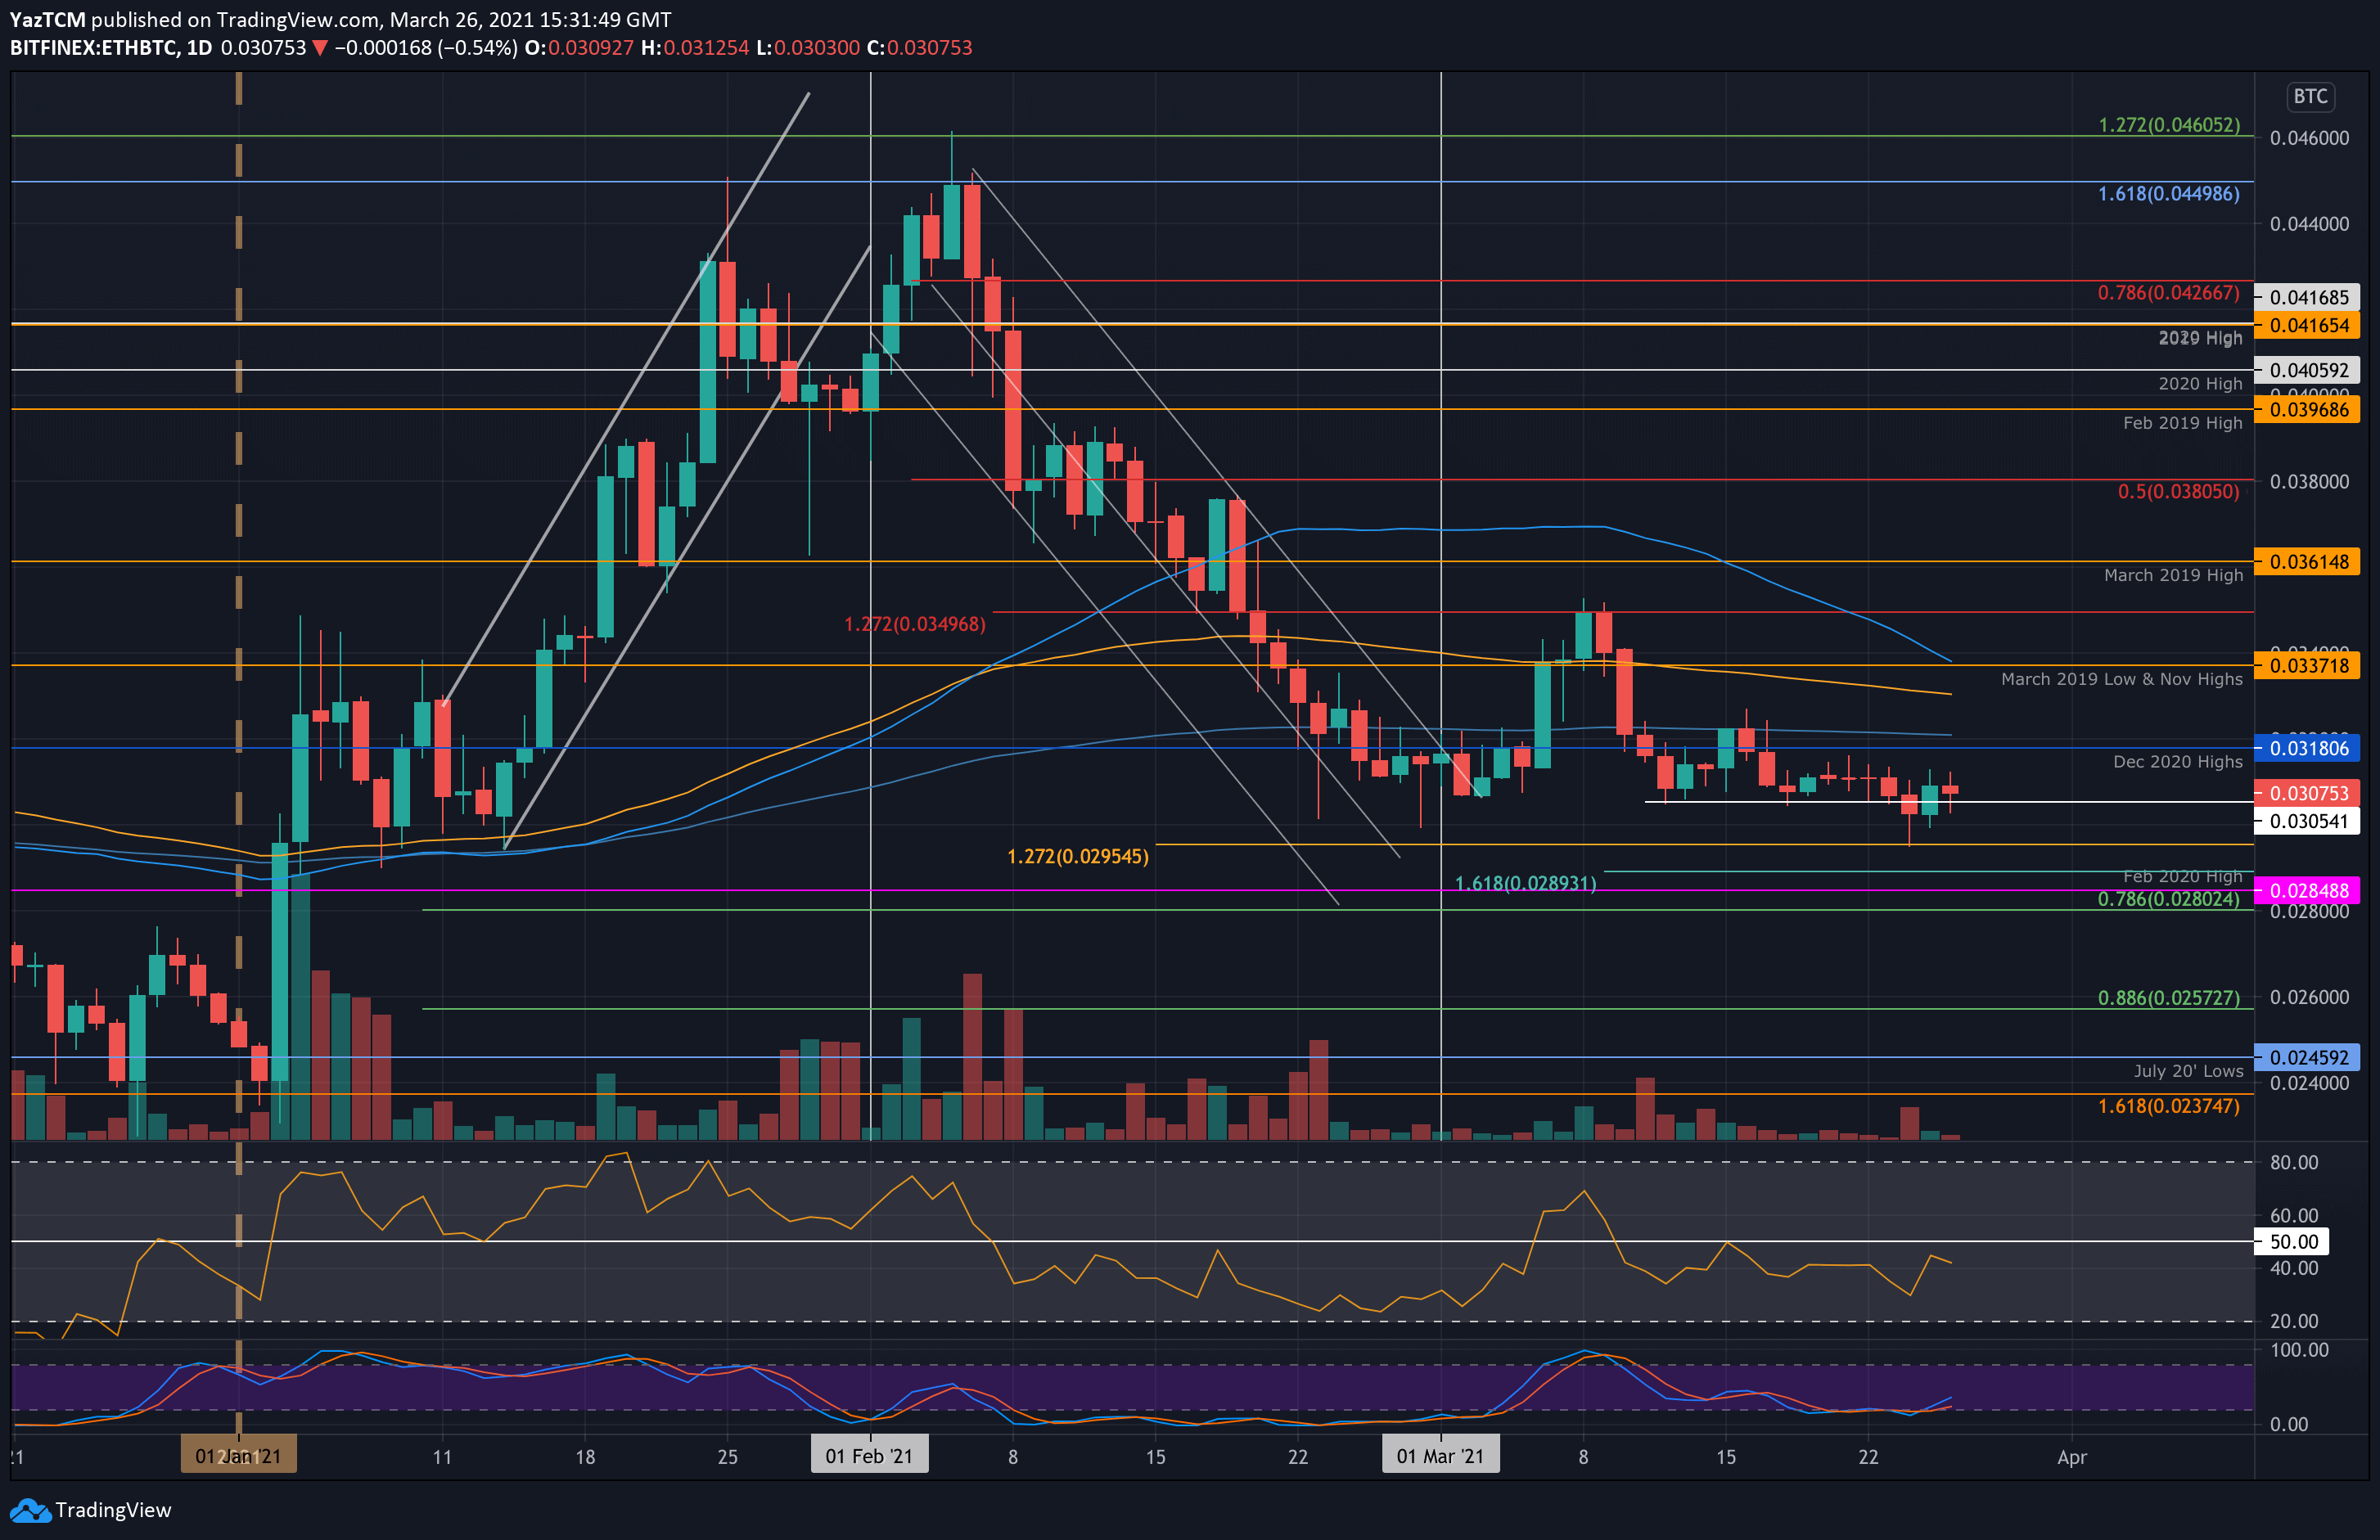
Etheruem also struggled against Bitcoin this week. The cryptocurrency was holding support at 0.0305 BTC throughout the entire period of March. However, on Wednesday, Ethereum collapsed below 0.03 BTC until it met lower support at 0.0295 BTC (downside 1.272 Fib Extension).
Luckily, it rebounded and closed the daily candle above 0.03 BTC. Today, ETH is trading at 0.0307 BTC as the bulls attempt a recovery.
Looking ahead, the first level of resistance lies at 0.0318 BTC (Dec 2020 Highs). This is followed by 0.032 BTC (200-days EMA), 0.0337 BTC (March 2019 lows), and 0.034 BTC.
On the other side, the first support lies at 0.0305 BTC. This is followed by 0.03 BTC, 0.0295 BTC, and 0.0295 BTC (Feb 2020 Lows).
Cardano
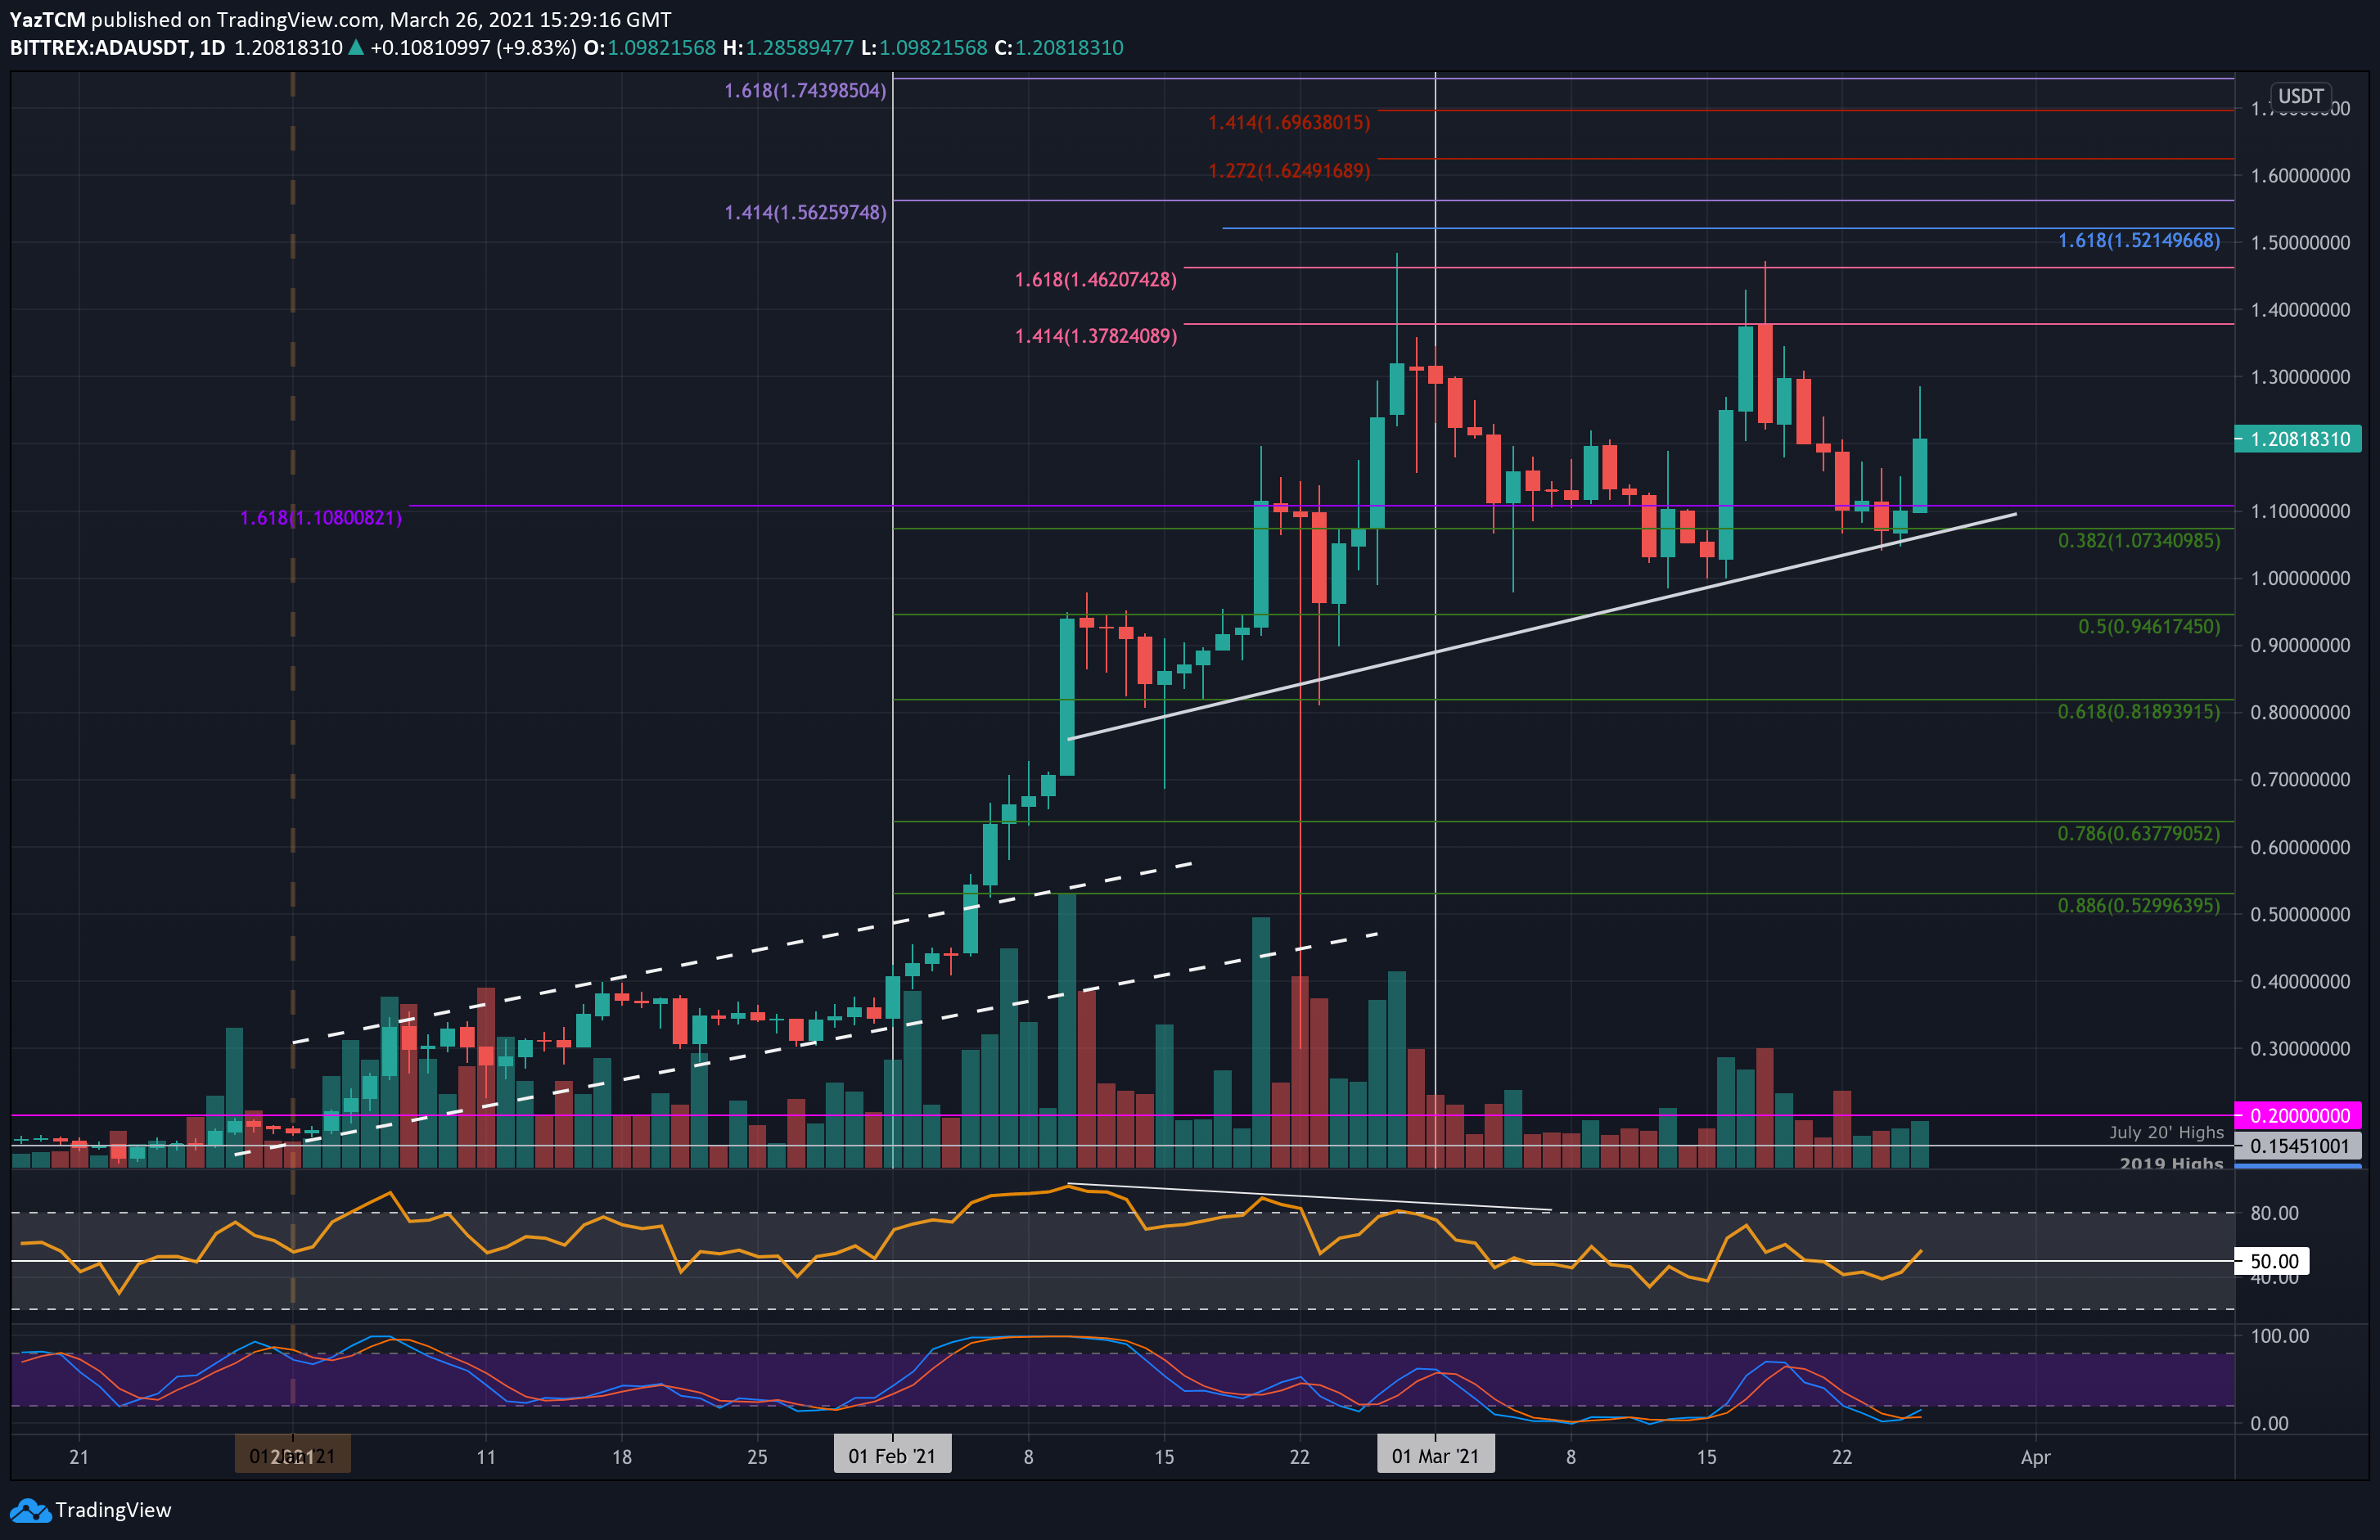
Cardano is down by a small 1.7% over the past week as it currently trades at $1.20. The coin was at $1.30 last week as it started to head lower. ADA continued to drop further throughout the week until support was found around $1.07 (.382 Fib) on Wednesday. A rising trend line further bolstered this level.
ADA rebounded from there yesterday and surged by a total of 8.7% today, allowing the cryptocurrency to reach $1.20.
Looking ahead, the first level of resistance lies at $1.30. This is followed by $1.37 (1.414 Fib Extension), $1.46 (1.414 Fib Extension), and $1.50. Additional resistance is expected at $1.62 (1.272 Fib Extension – red), $1.70 (1.414 Fib Extension – red), and $1.80.
On the other side, the first level of support lies at $1.10. This is followed by the rising trend line (around $1.07), $1.00, and $0.95 (.5 Fib).
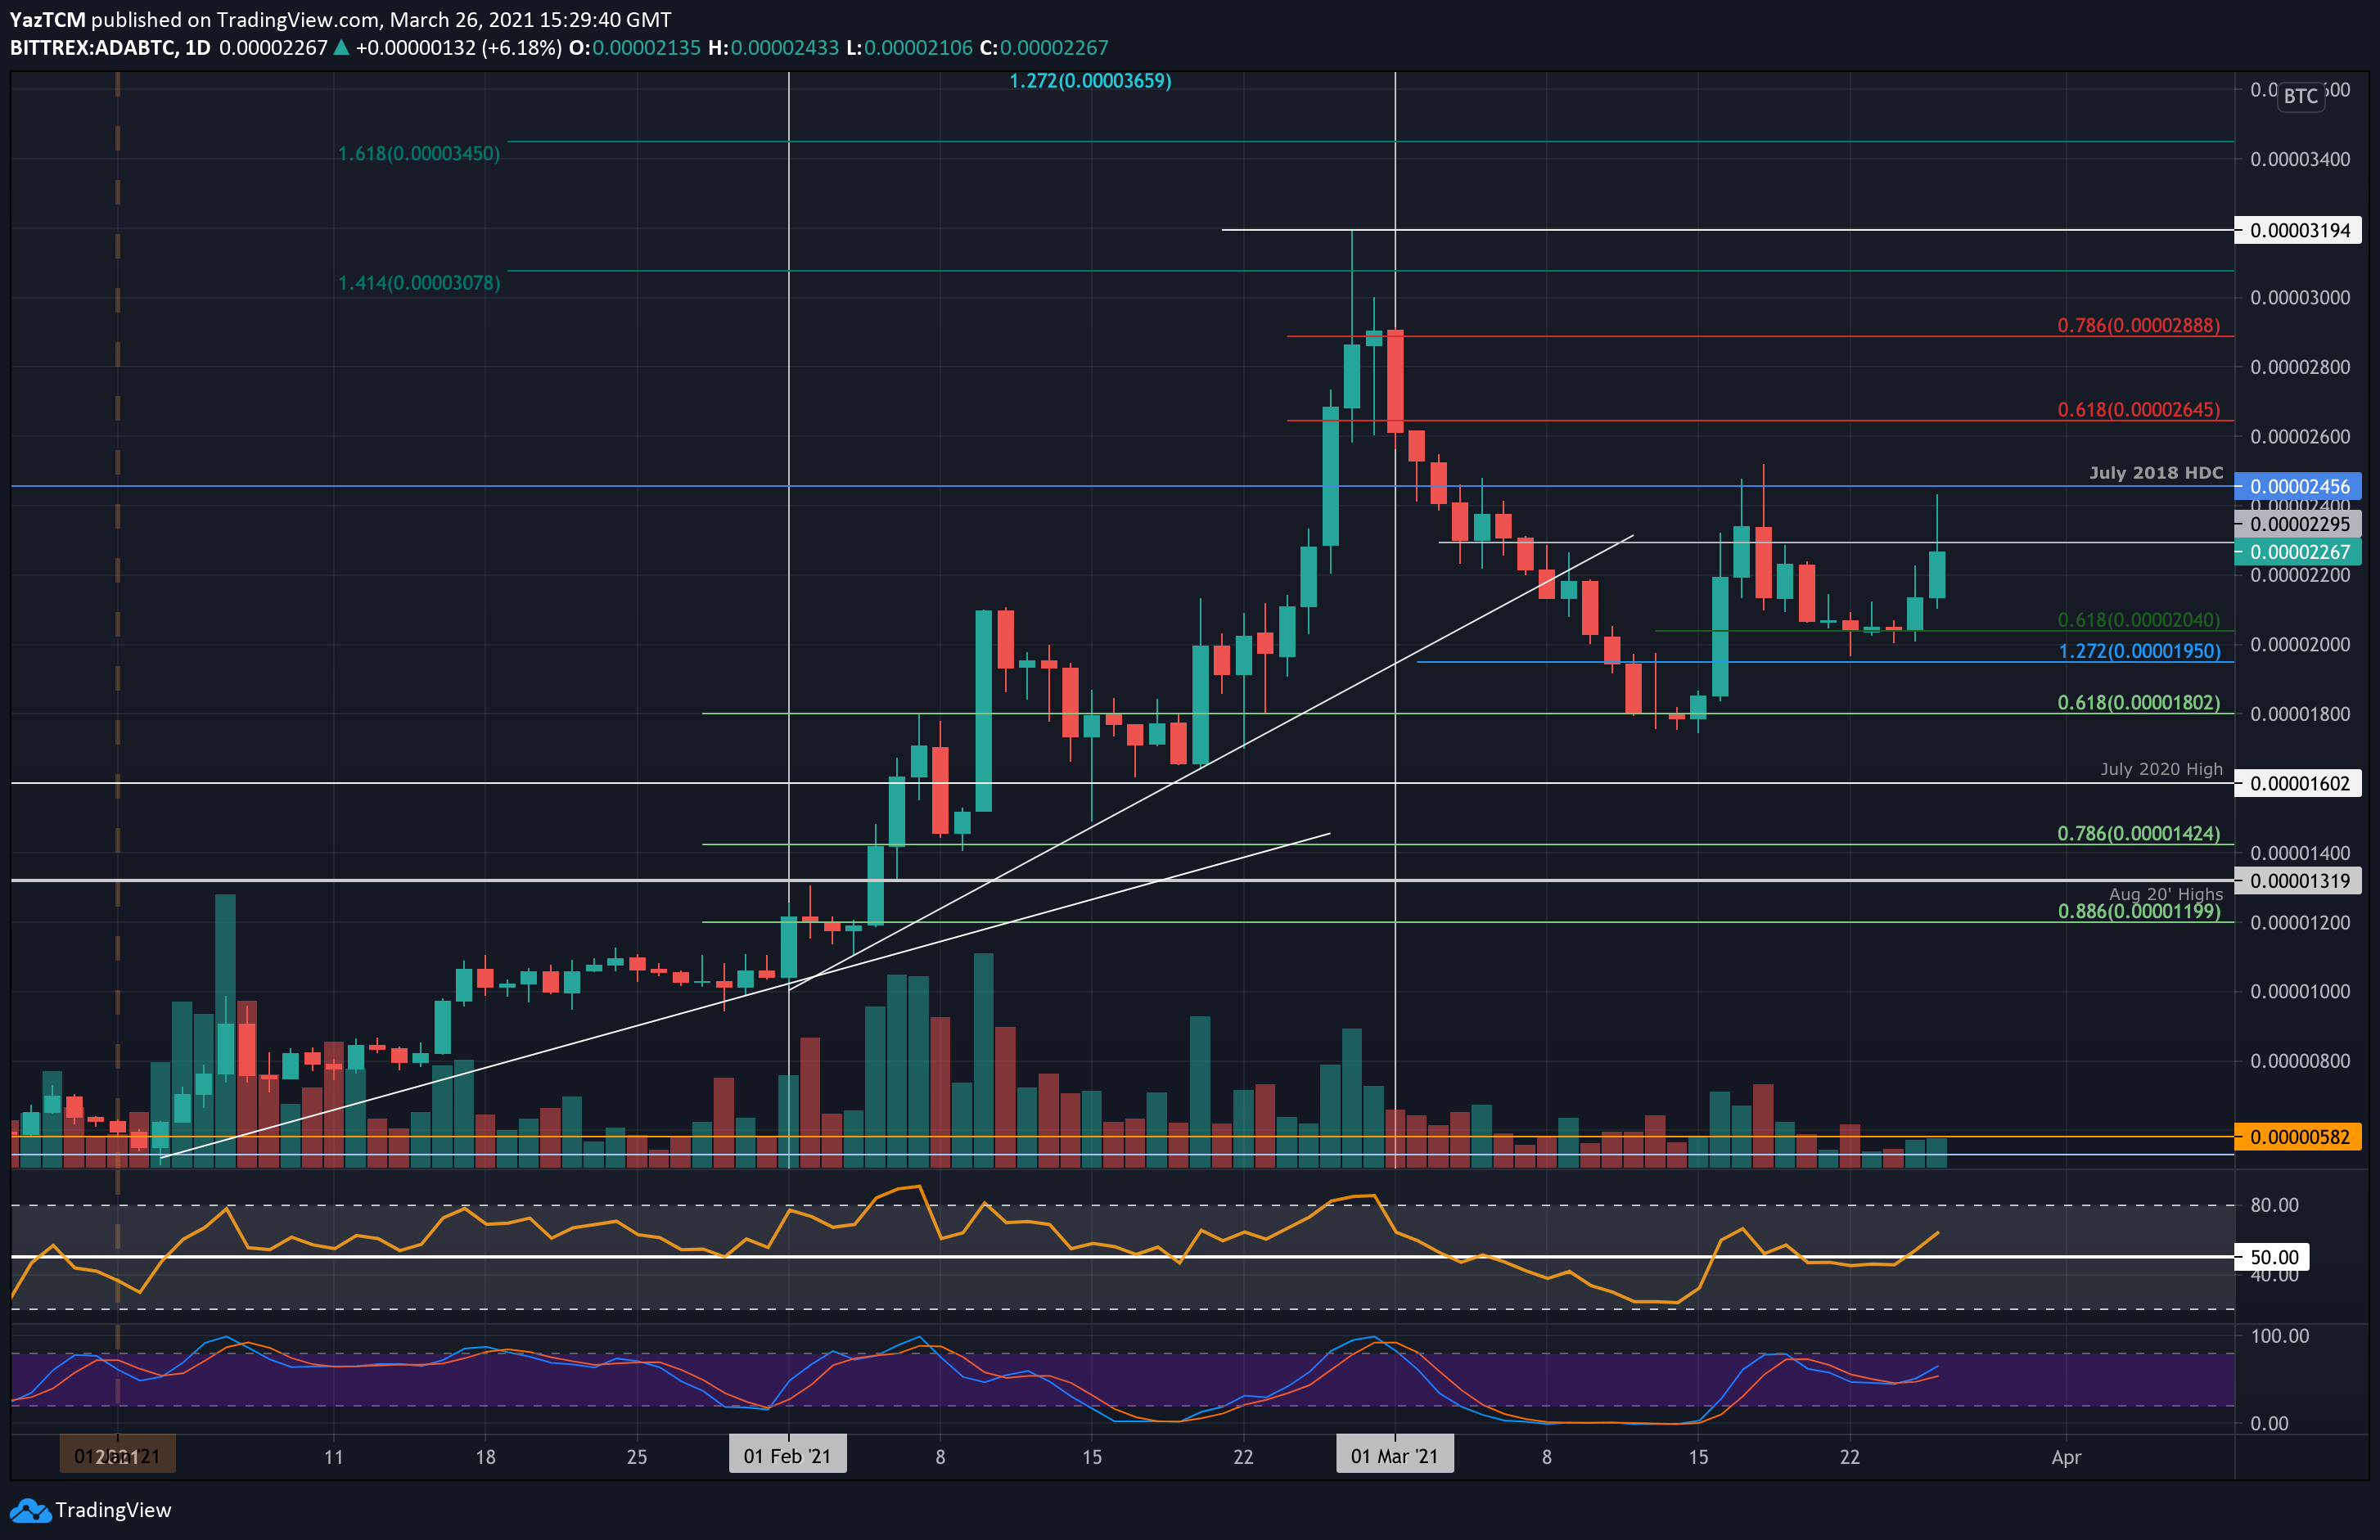
Against Bitcoin, ADA is also trading near the same level it was last week. Throughout the last seven days, it had dropped lower but managed to hold the .618 Fib support at around 2040 SAT on Wednesday. It has since rebounded from there yesterday to reach 2200 SAT, and it continued higher today to trade at the current 2295 SAT resistance.
Looking ahead, the first level of resistance above 2295 SAT lies at 2400 SAT. This is followed by 2455 SAT (July 2018 HDC), 2600 SAT, 2645 SAT (bearish .618 Fib), and 2800 SAT.
On the other side, the first level of support lies at 2200 SAT. This is followed by 2040 SAT (.618 Fib), 1950 SAT (downside 1.272 Fib Extension), and 1800 SAT.
Uniswap
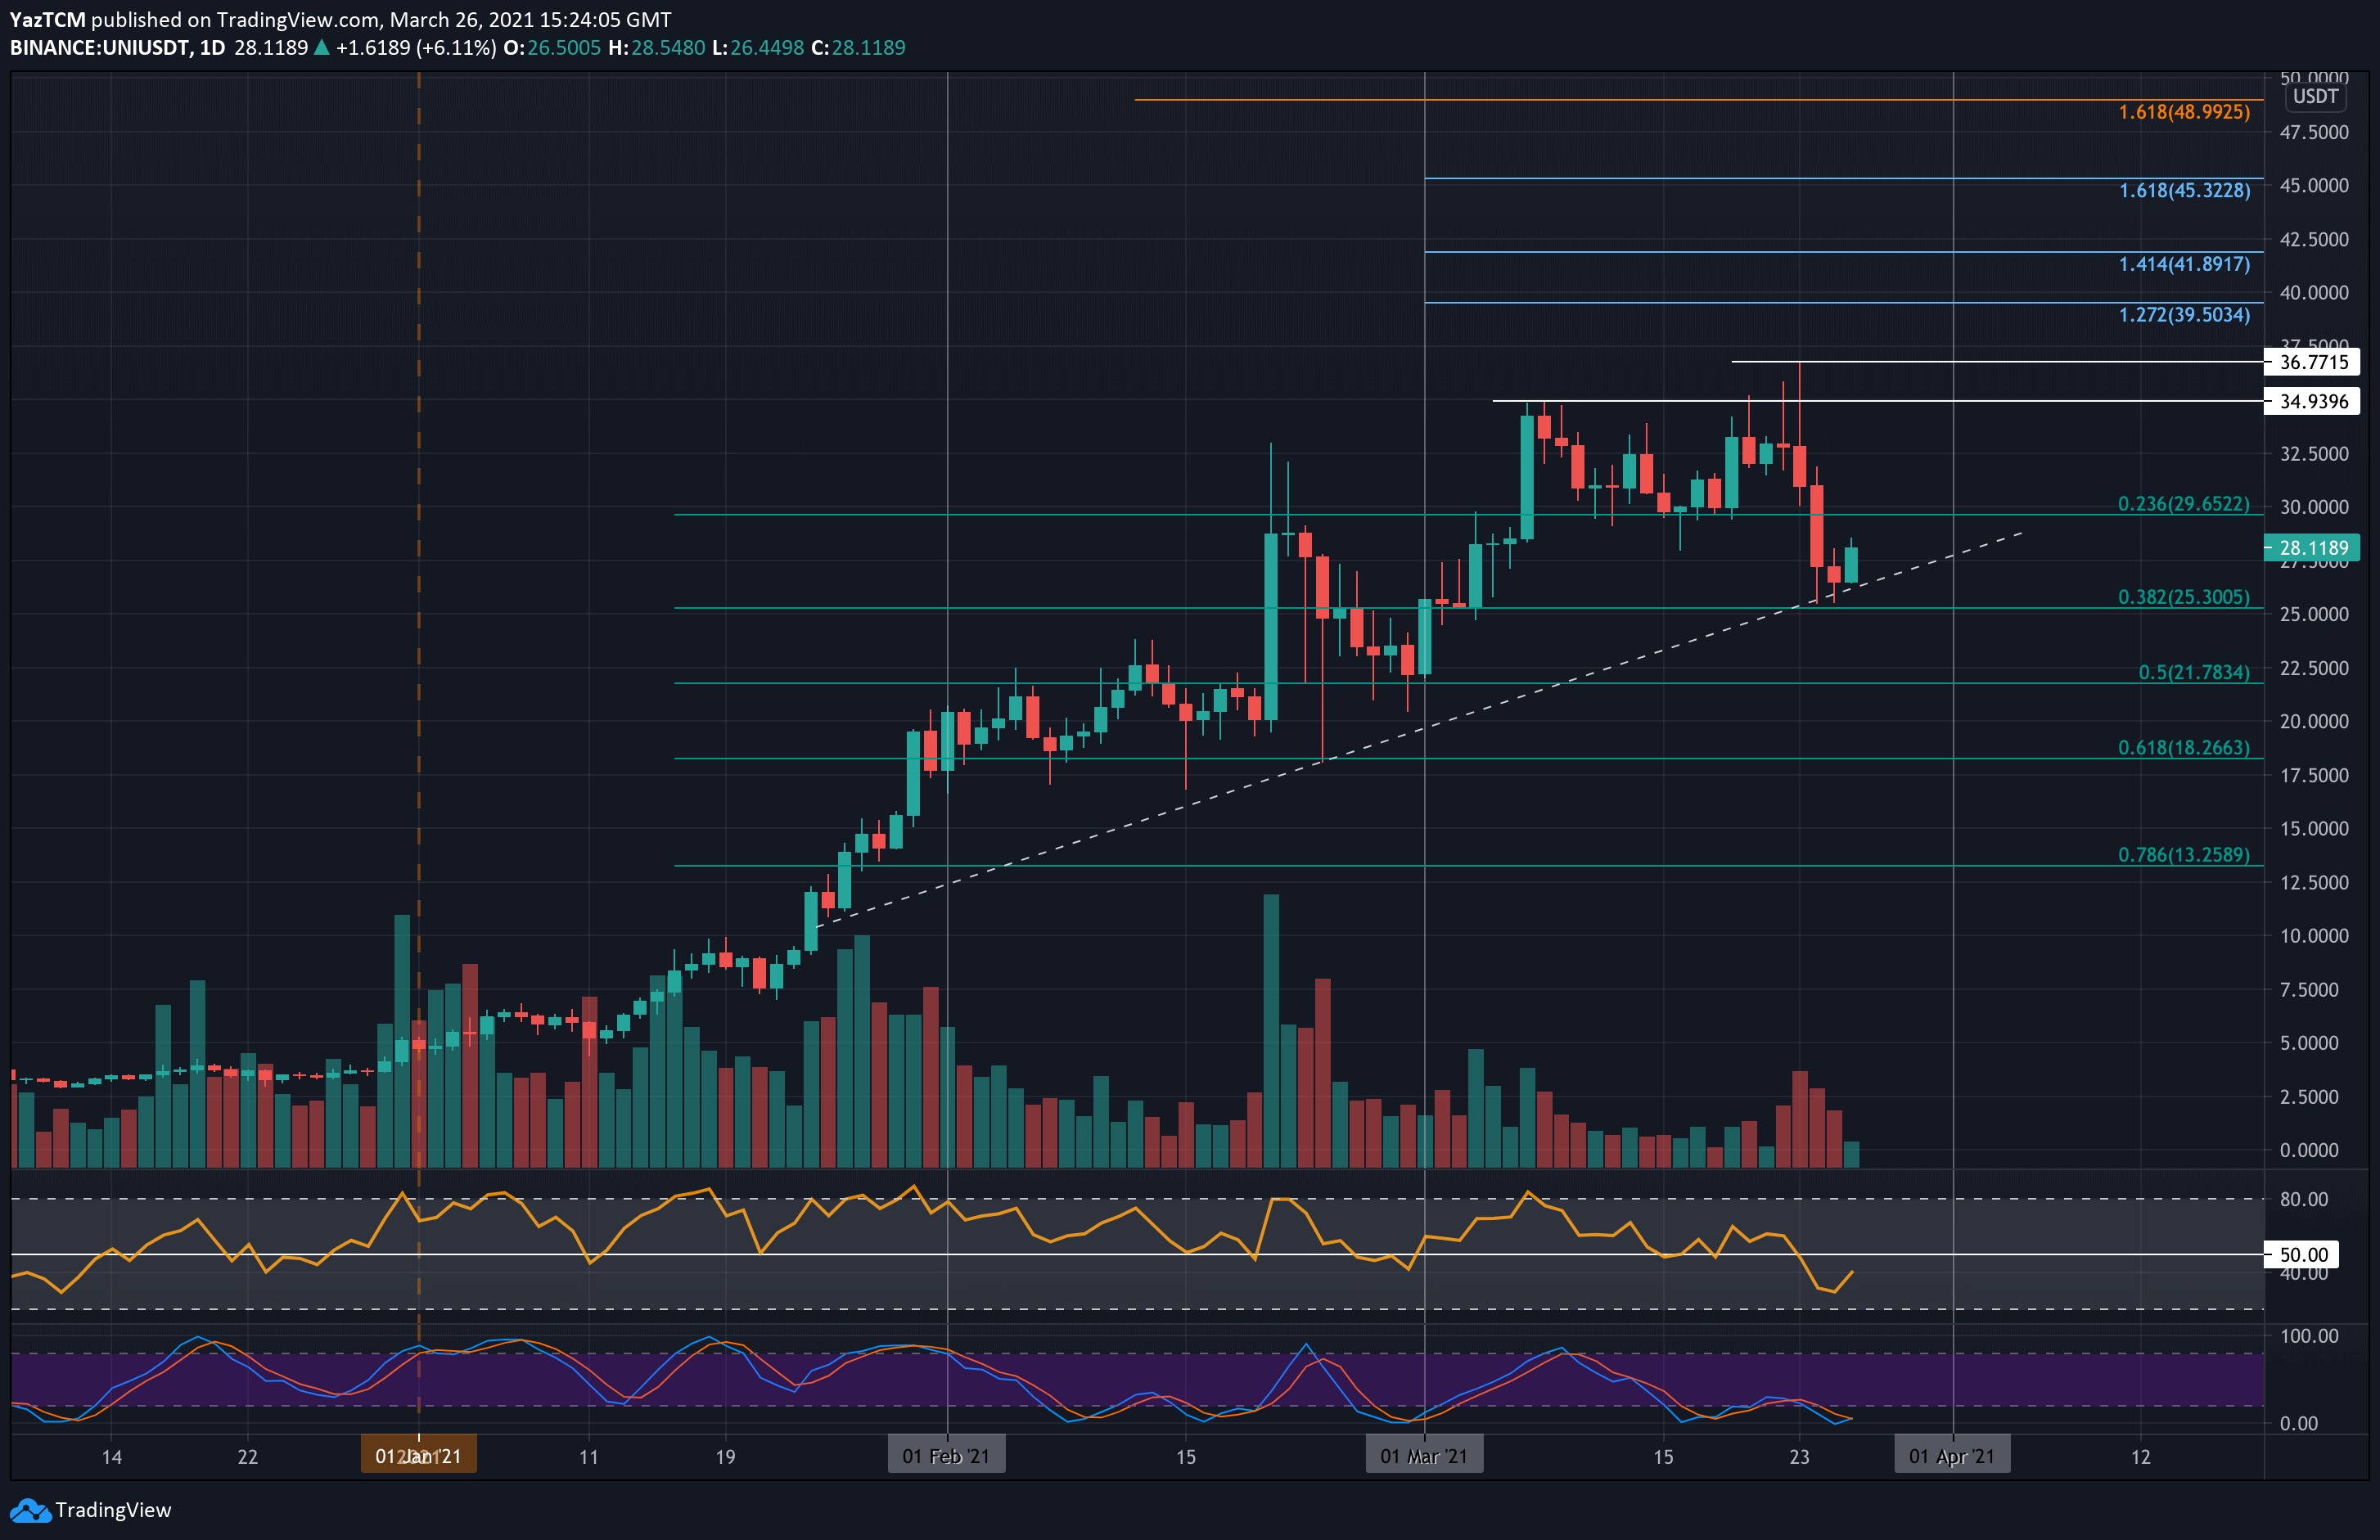
UNI is down by 7.5% over the past week of trading as it currently trades at around $28.11. The cryptocurrency set a new ATH price earlier in the week at $36.77 but started to head lower from there. On Wednesday, UNI dropped $30 and continued to fall until finding support at $25.30 (.382 Fib). This level was strengthened by a rising trend line that has been in play since late January 2021.
It rebounded from this support today as it now trades at $28.11.
Looking ahead, the first level of resistance lies at $30. This is followed by $32.50, $35, $36.77 (ATH price), $39.50 (1.272 Fib Extension), and $40.
On the other side, the first level of support lies at the rising trend line. This is followed by $25.30 (.382 Fib), $23, $21.78 (.5 Fib), and $20.
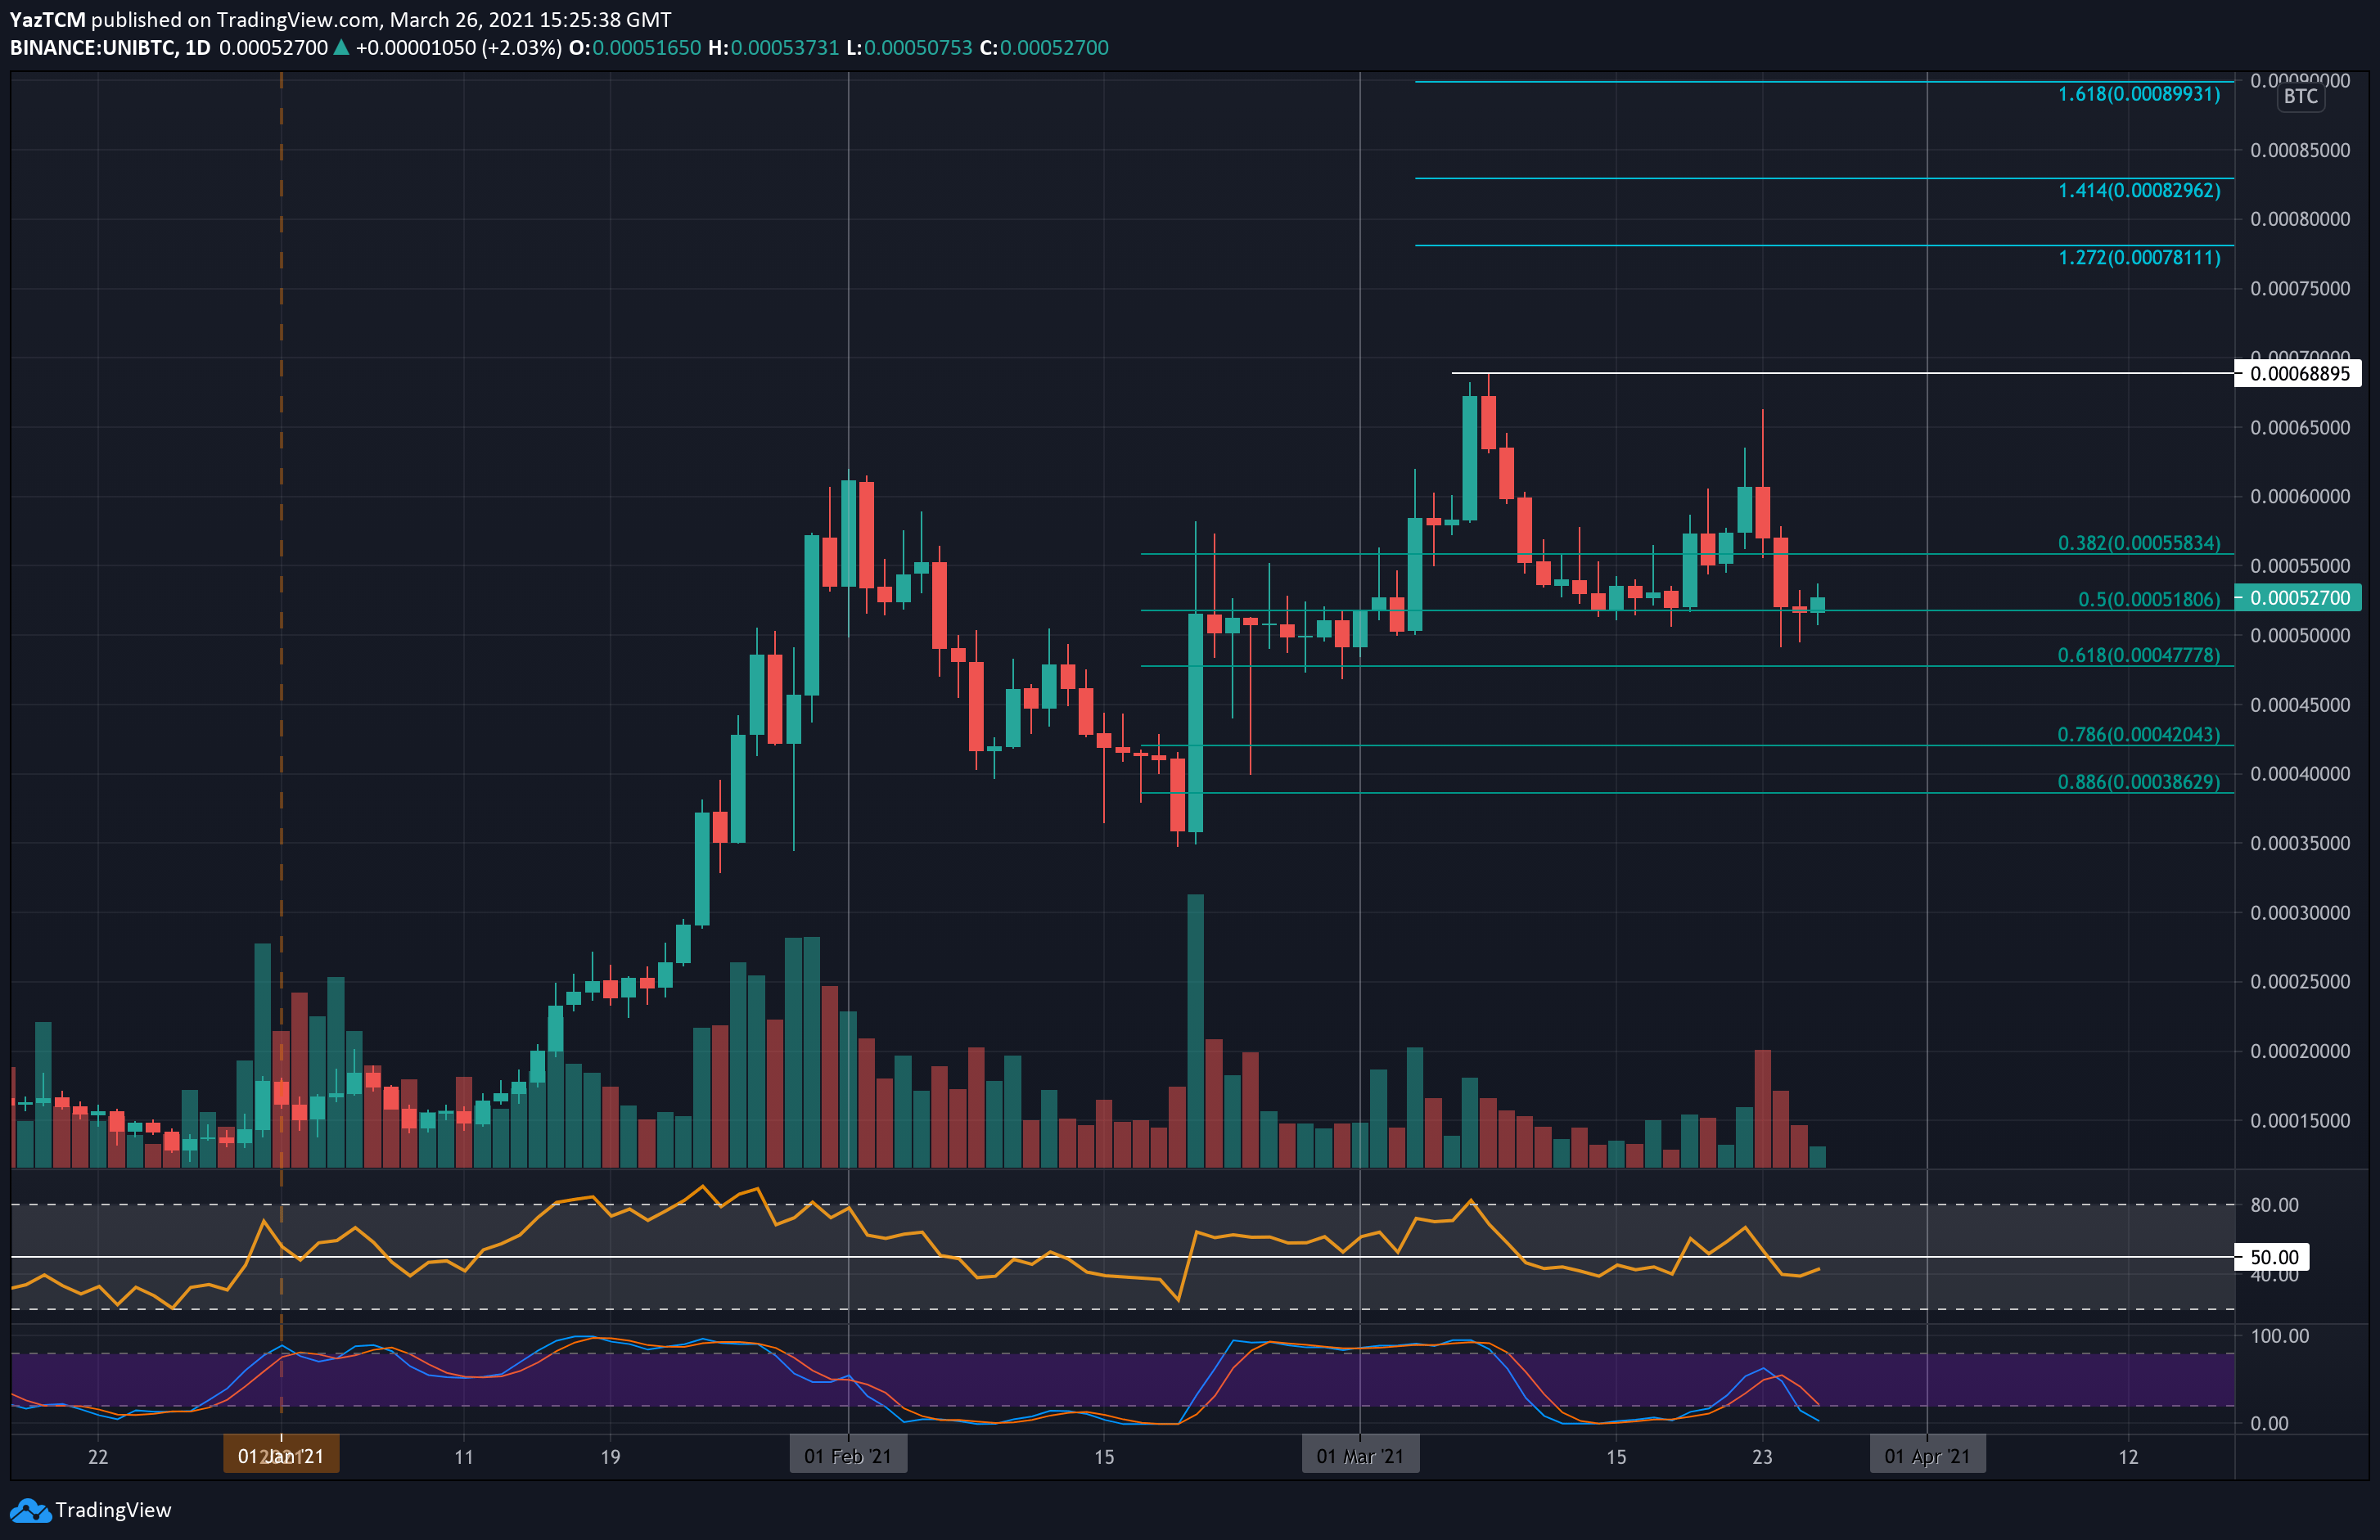
UNI is also trading at the same price it was at last week against Bitcoin. The cryptocurrency had pushed higher from 0.000518 BTC at the start of the week to reach 0.00065 BTC on Tuesday. It started to fall lower from there as it fell back into the 0.000518 BTC support provided by a .5 Fib Retracement.
It has bounced from 0.000518 BTC today as it trades at 0.000527 BTC.
Looking ahead, the first level of resistance lies at 0.00055 BTC. This is followed by 0.0006 BTC, 0.000625 BTC, and 0.00065 BTC. Added resistance is expected at 0.000688 BTC (ATH price), 0.0007 BTC, and 0.00075 BTC.
On the other side, the first support lies at 0.000518 BTC (.5 Fib). This is followed by 0.0005 BTC, 0.000477 BTC (.618 Fib), 0.00045 BTC, and 0.00042 BTC (.786 Fib).
Theta Token
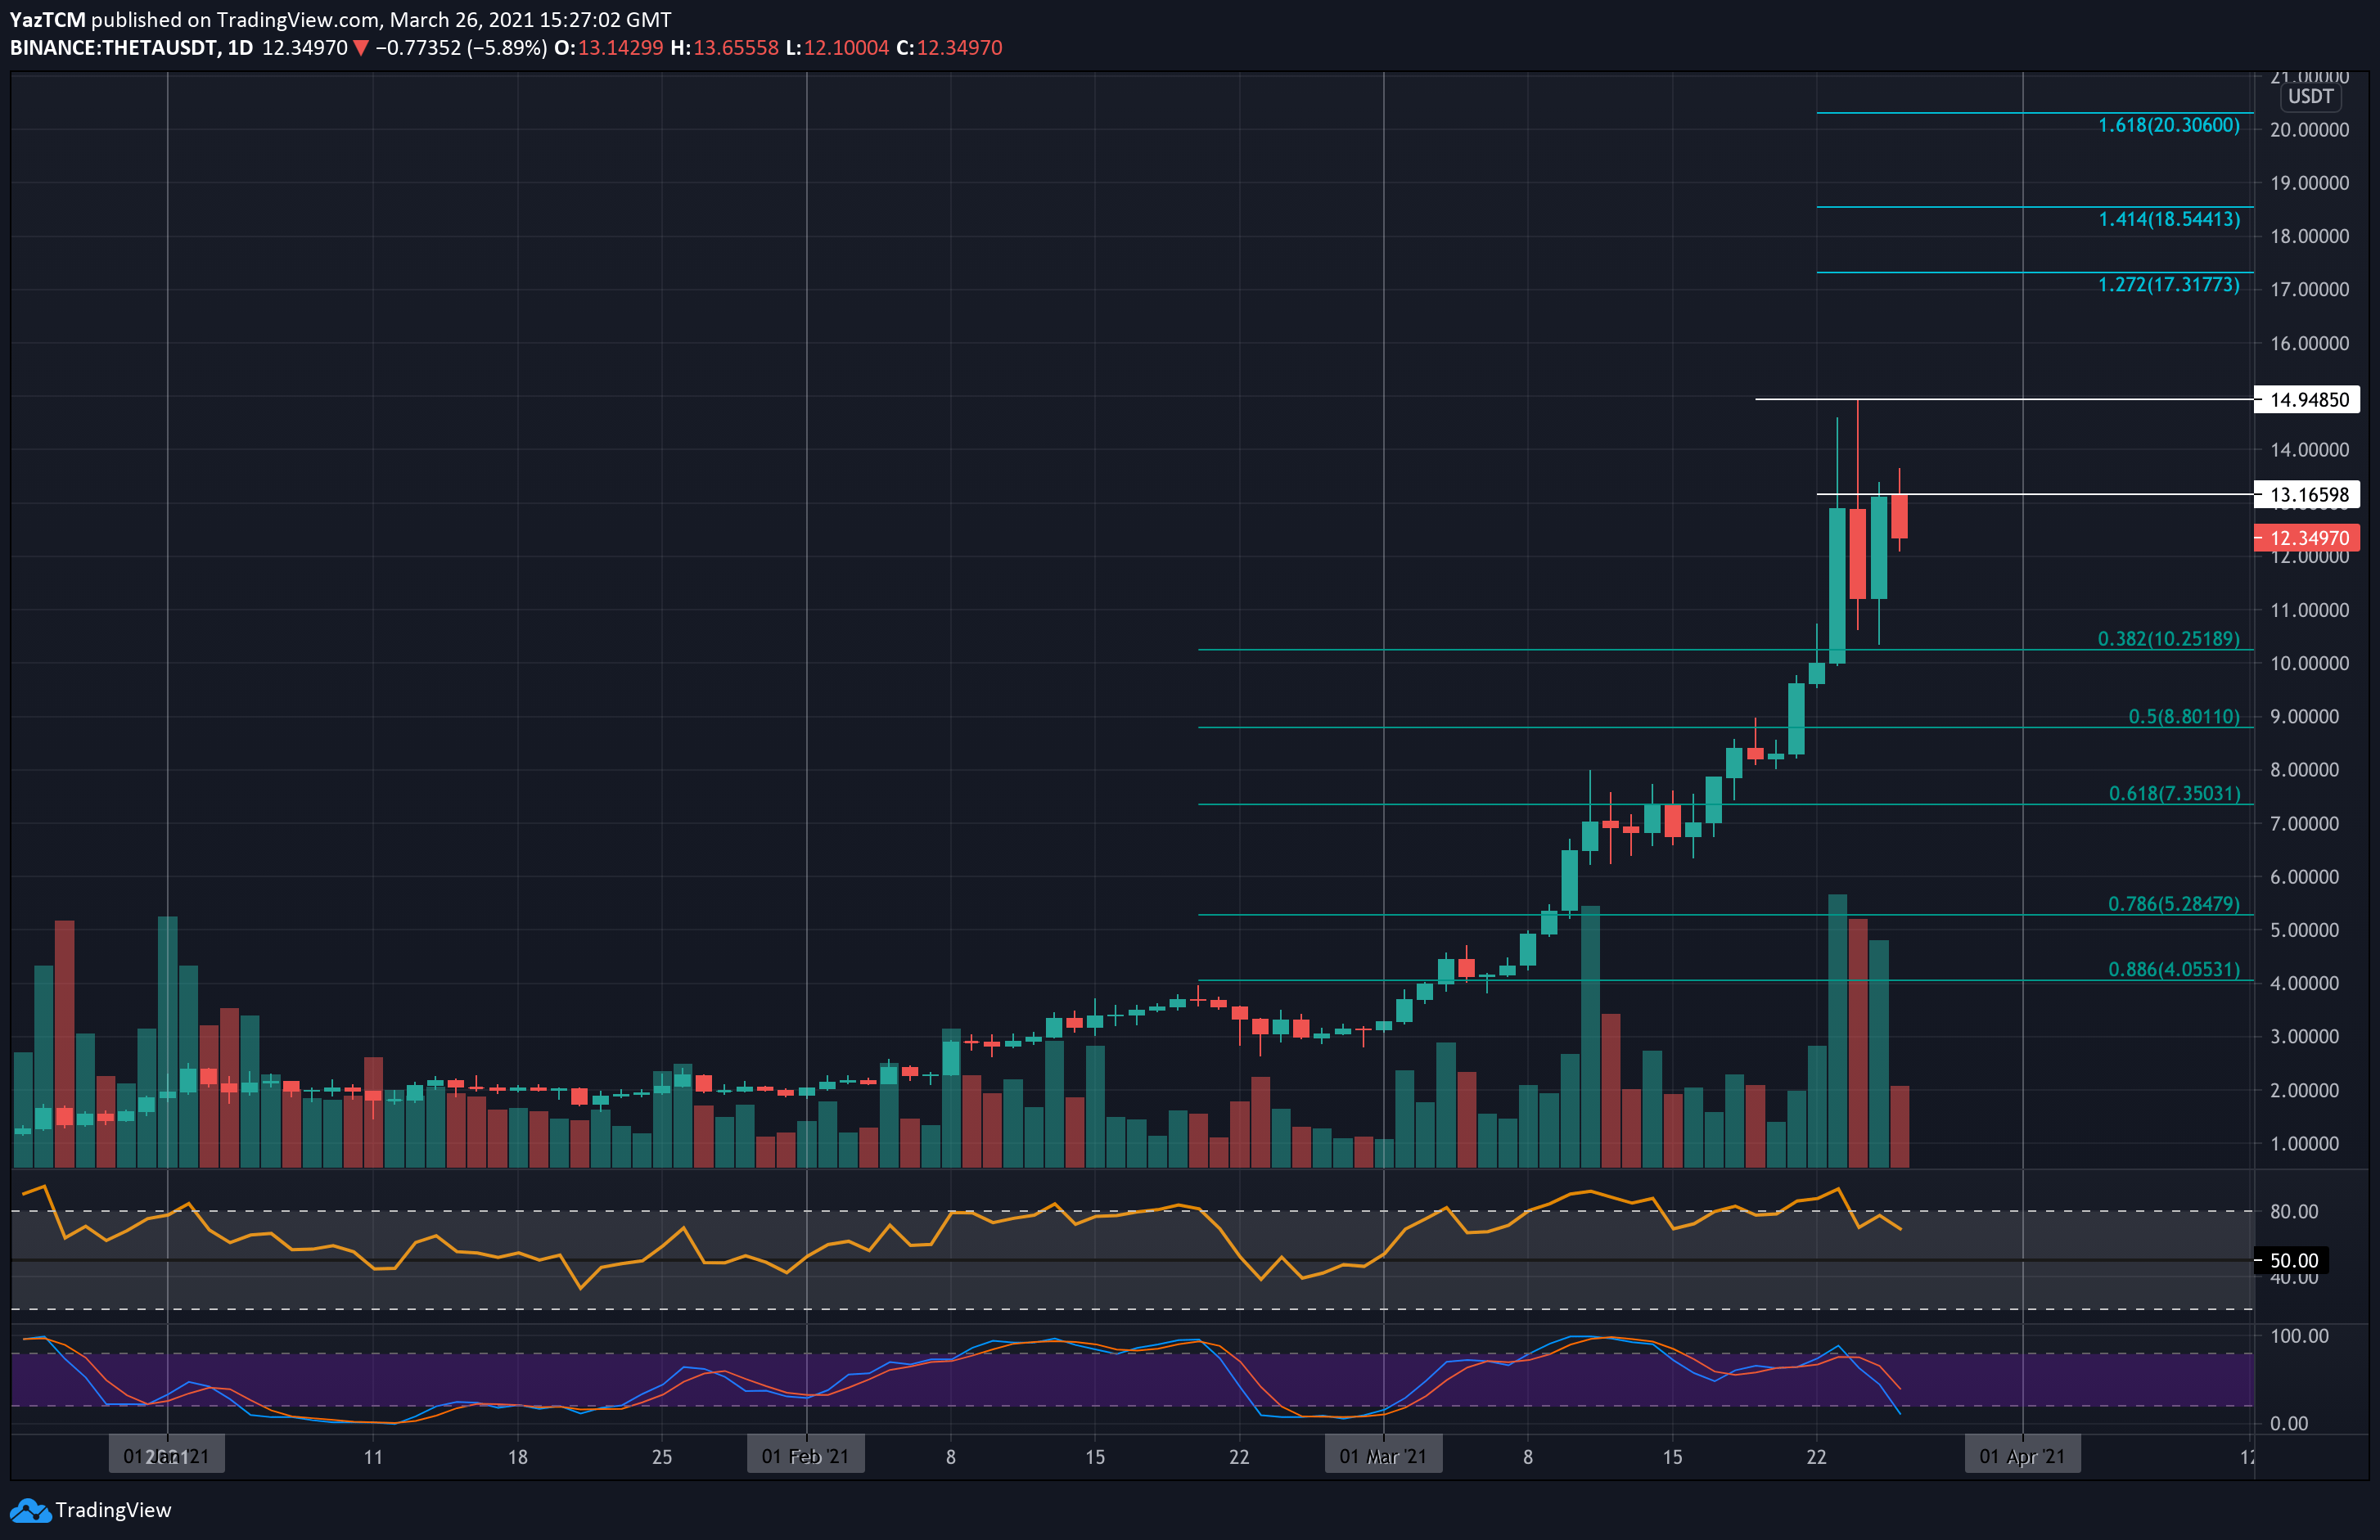
Theta Token is up by an enormous 44% over this past week as it currently trades at around $12.35. The cryptocurrency had pushed higher from $8.00 at the start of the week as it began to surge. It managed to penetrate above $10 on Tuesday and continued to set a new ATH price at $14.94 on Wednesday.
It did drop back into the support at $10.25 (.382 Fib) yesterday but has since rebounded to trade at the current $12.35 level.
Looking ahead, the first level of resistance lies at $13.16. This is followed by $14, $14.95 (ATH), and $16. Additional resistance lies at $17.31 (1.272 Fib Extension), $18, and $18.55 (1.414 Fib Extension).
On the other side, the first support lies at $12. This is followed by $11, $10.25 (.382 Fib), $10, and $8.80 (.5 Fib).
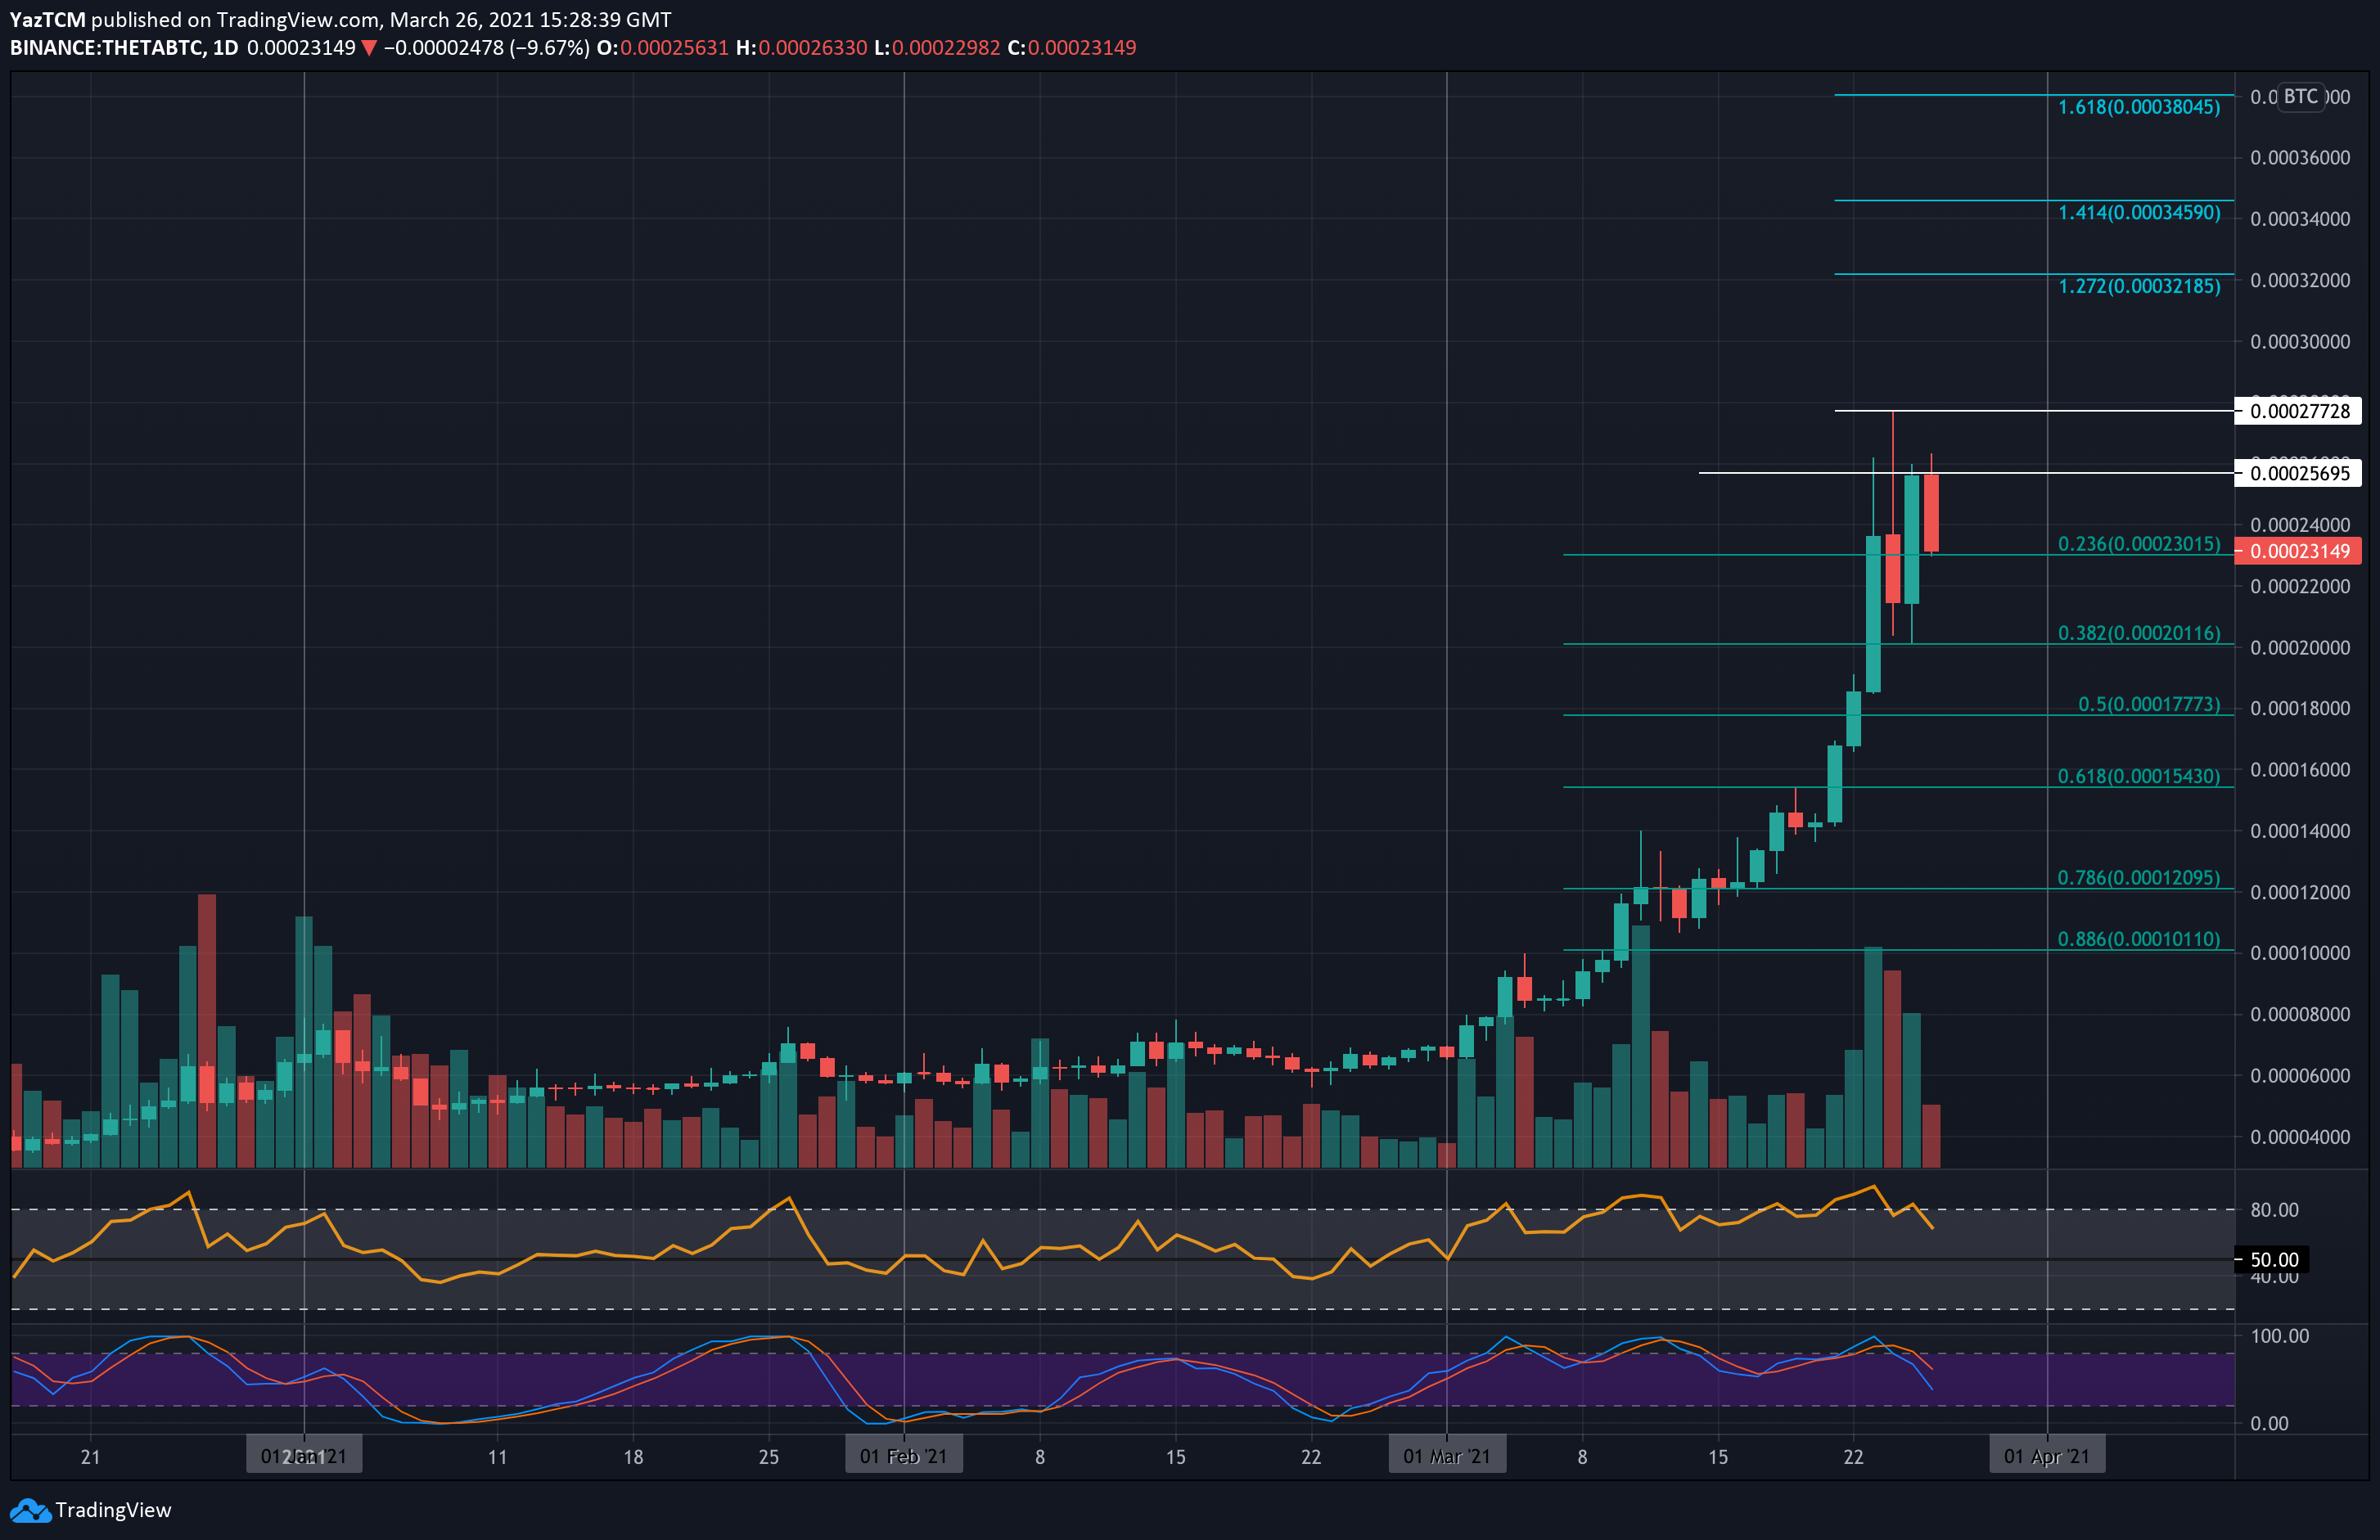
Theta is also performing very well against Bitcoin as it trades at 0.000231 BTC. The coin started to push higher from 0.00014 BTC at the start of the week, and it managed to set a new ATH price at 0.000277 BTC on Wednesday.
Yesterday, it dropped as low as 0.0002 BTC (.382 Fib) but quickly rebounded to reach resistance around 0.000256 BTC. Today, THETA dropped into the support at 0.00023 BTC (.236 Fib), where it is currently trading.
Looking ahead, the first resistance lies at 0.000256 BTC. This is followed by 0.000277 BTC (ATH), 0.0003 BTC, and 0.000321 BTC (1.272 Fib Extension).
On the other side, the first support lies at 0.00023 BTC (.236 Fib). This is followed by 0.00022 BTC, 0.00020 BTC (.382 Fib), and 0.000177 BTC (.5 Fib).