Bitcoin is grappling with a crucial resistance level at roughly K, which also aligns with the 100-day moving average. A breakout from here will potentially initiate an uptrend in the short term. Technical Analysis By Shayan The Daily Chart The price has been trapped inside a descending wedge pattern for several months and is consolidating with significantly lower volatility. Meanwhile, the 100-day moving average has served as a powerful barrier at around K. The current action demonstrates a concerning lack of activity in Bitcoin’s market, which can be explained by recent events, which resulted in a lack of demand. Considering the current market sentiment, it appears that one of the more probable outlooks for Bitcoin is to continue consolidating between the two
Topics:
CryptoVizArt considers the following as important: Bitcoin (BTC) Price, BTC Analysis, btcusd, btcusdt
This could be interesting, too:
Mandy Williams writes Bitcoin ETFs Record Over .6B in Outflows in the Past 2 Weeks
Chayanika Deka writes Bitcoin Whales Offload 6,813 BTC as Selling Pressure Mounts
Wayne Jones writes Bitcoin Sentiment Hits 2022 Lows as Fear & Greed Index Falls to 10
Jordan Lyanchev writes Bitcoin Falls Below K for the First Time in 3 Months, How Much Lower Can It Go?
Bitcoin is grappling with a crucial resistance level at roughly $17K, which also aligns with the 100-day moving average. A breakout from here will potentially initiate an uptrend in the short term.
Technical Analysis
By Shayan
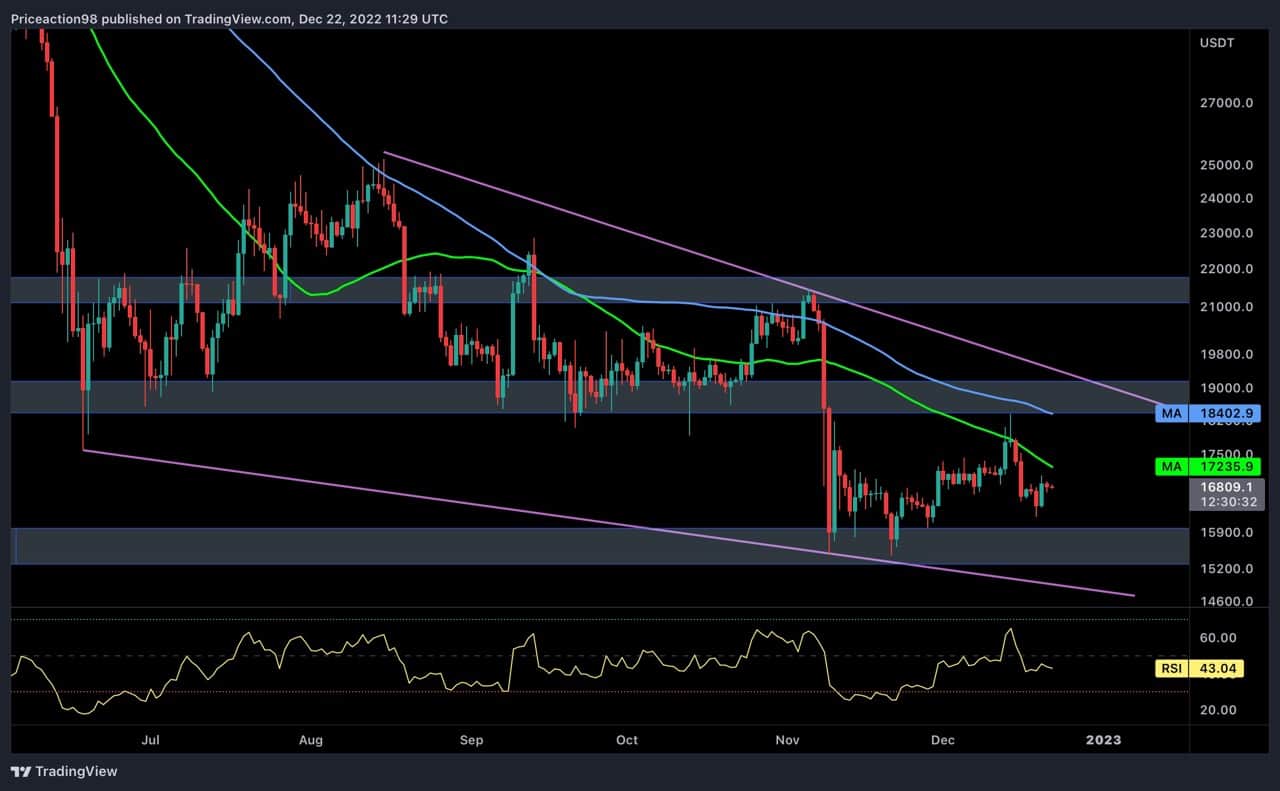
The Daily Chart
The price has been trapped inside a descending wedge pattern for several months and is consolidating with significantly lower volatility. Meanwhile, the 100-day moving average has served as a powerful barrier at around $17K.
The current action demonstrates a concerning lack of activity in Bitcoin’s market, which can be explained by recent events, which resulted in a lack of demand.
Considering the current market sentiment, it appears that one of the more probable outlooks for Bitcoin is to continue consolidating between the two substantial levels of $15K and $19K until a breakout occurs.
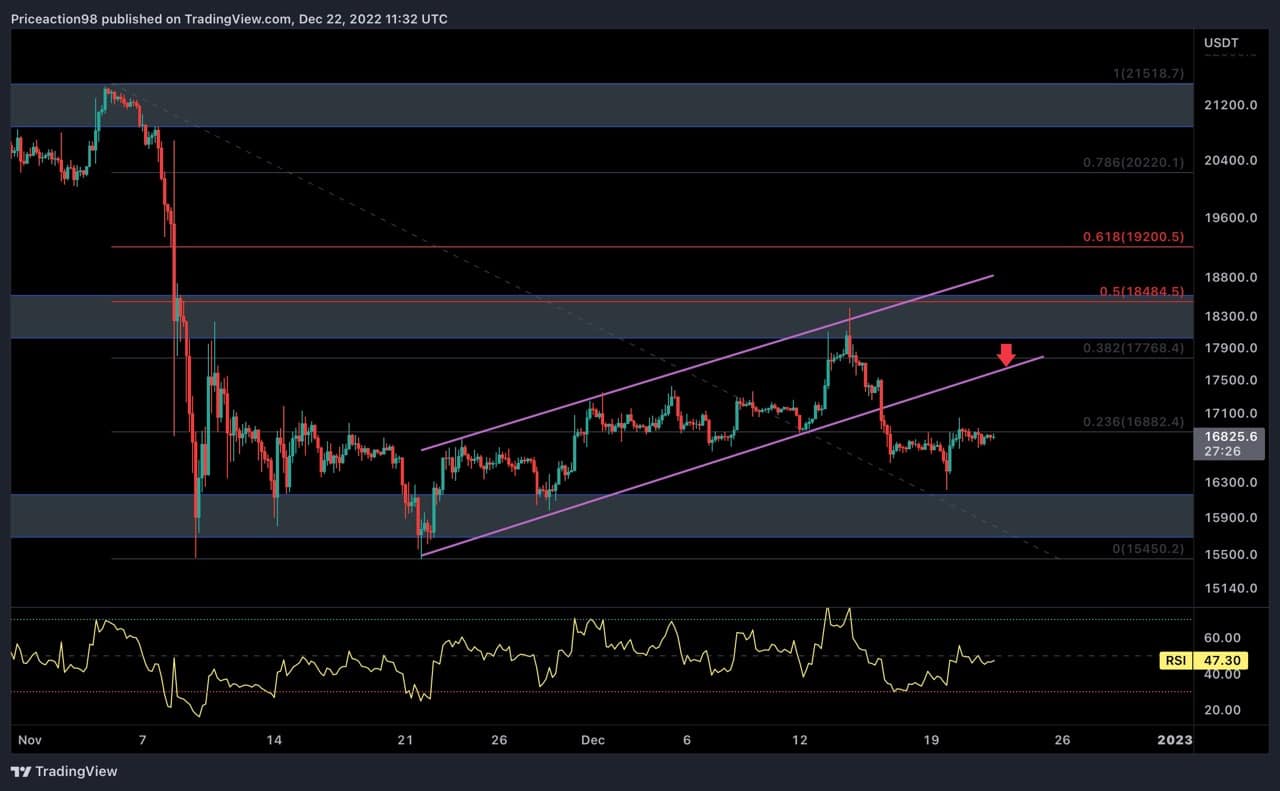
The 4-Hour Chart
In the 4-hour timeframe, the price has finally dropped below the ascending flag pattern. As is evident in the chart, the 0.5 level of Fibonacci retracement has acted as a great resistance and pushed the price towards the $15K support.
BTC seems likely to retest the flag’s lower boundary and complete the pullback pattern before the next downward rally.
Furthermore, the RSI indicator is currently standing at almost 50, indicating equilibrium has currently been reached.
Onchain Analysis
All on-chain valuation indicators conclude that Bitcoin is significantly undervalued. However, it is essential for whales to start accumulating again in order for the cryptocurrency to bottom out successfully.
Whales have continued to reduce spending, which is now at the lowest level since before Terra and Luna’s failure. The short-term local resistance for Bitcoin is the 1m-3m holder realized price, which is currently at $18.4k. In fact, this level has acted as a barrier during the market’s recent low-momentum rally.
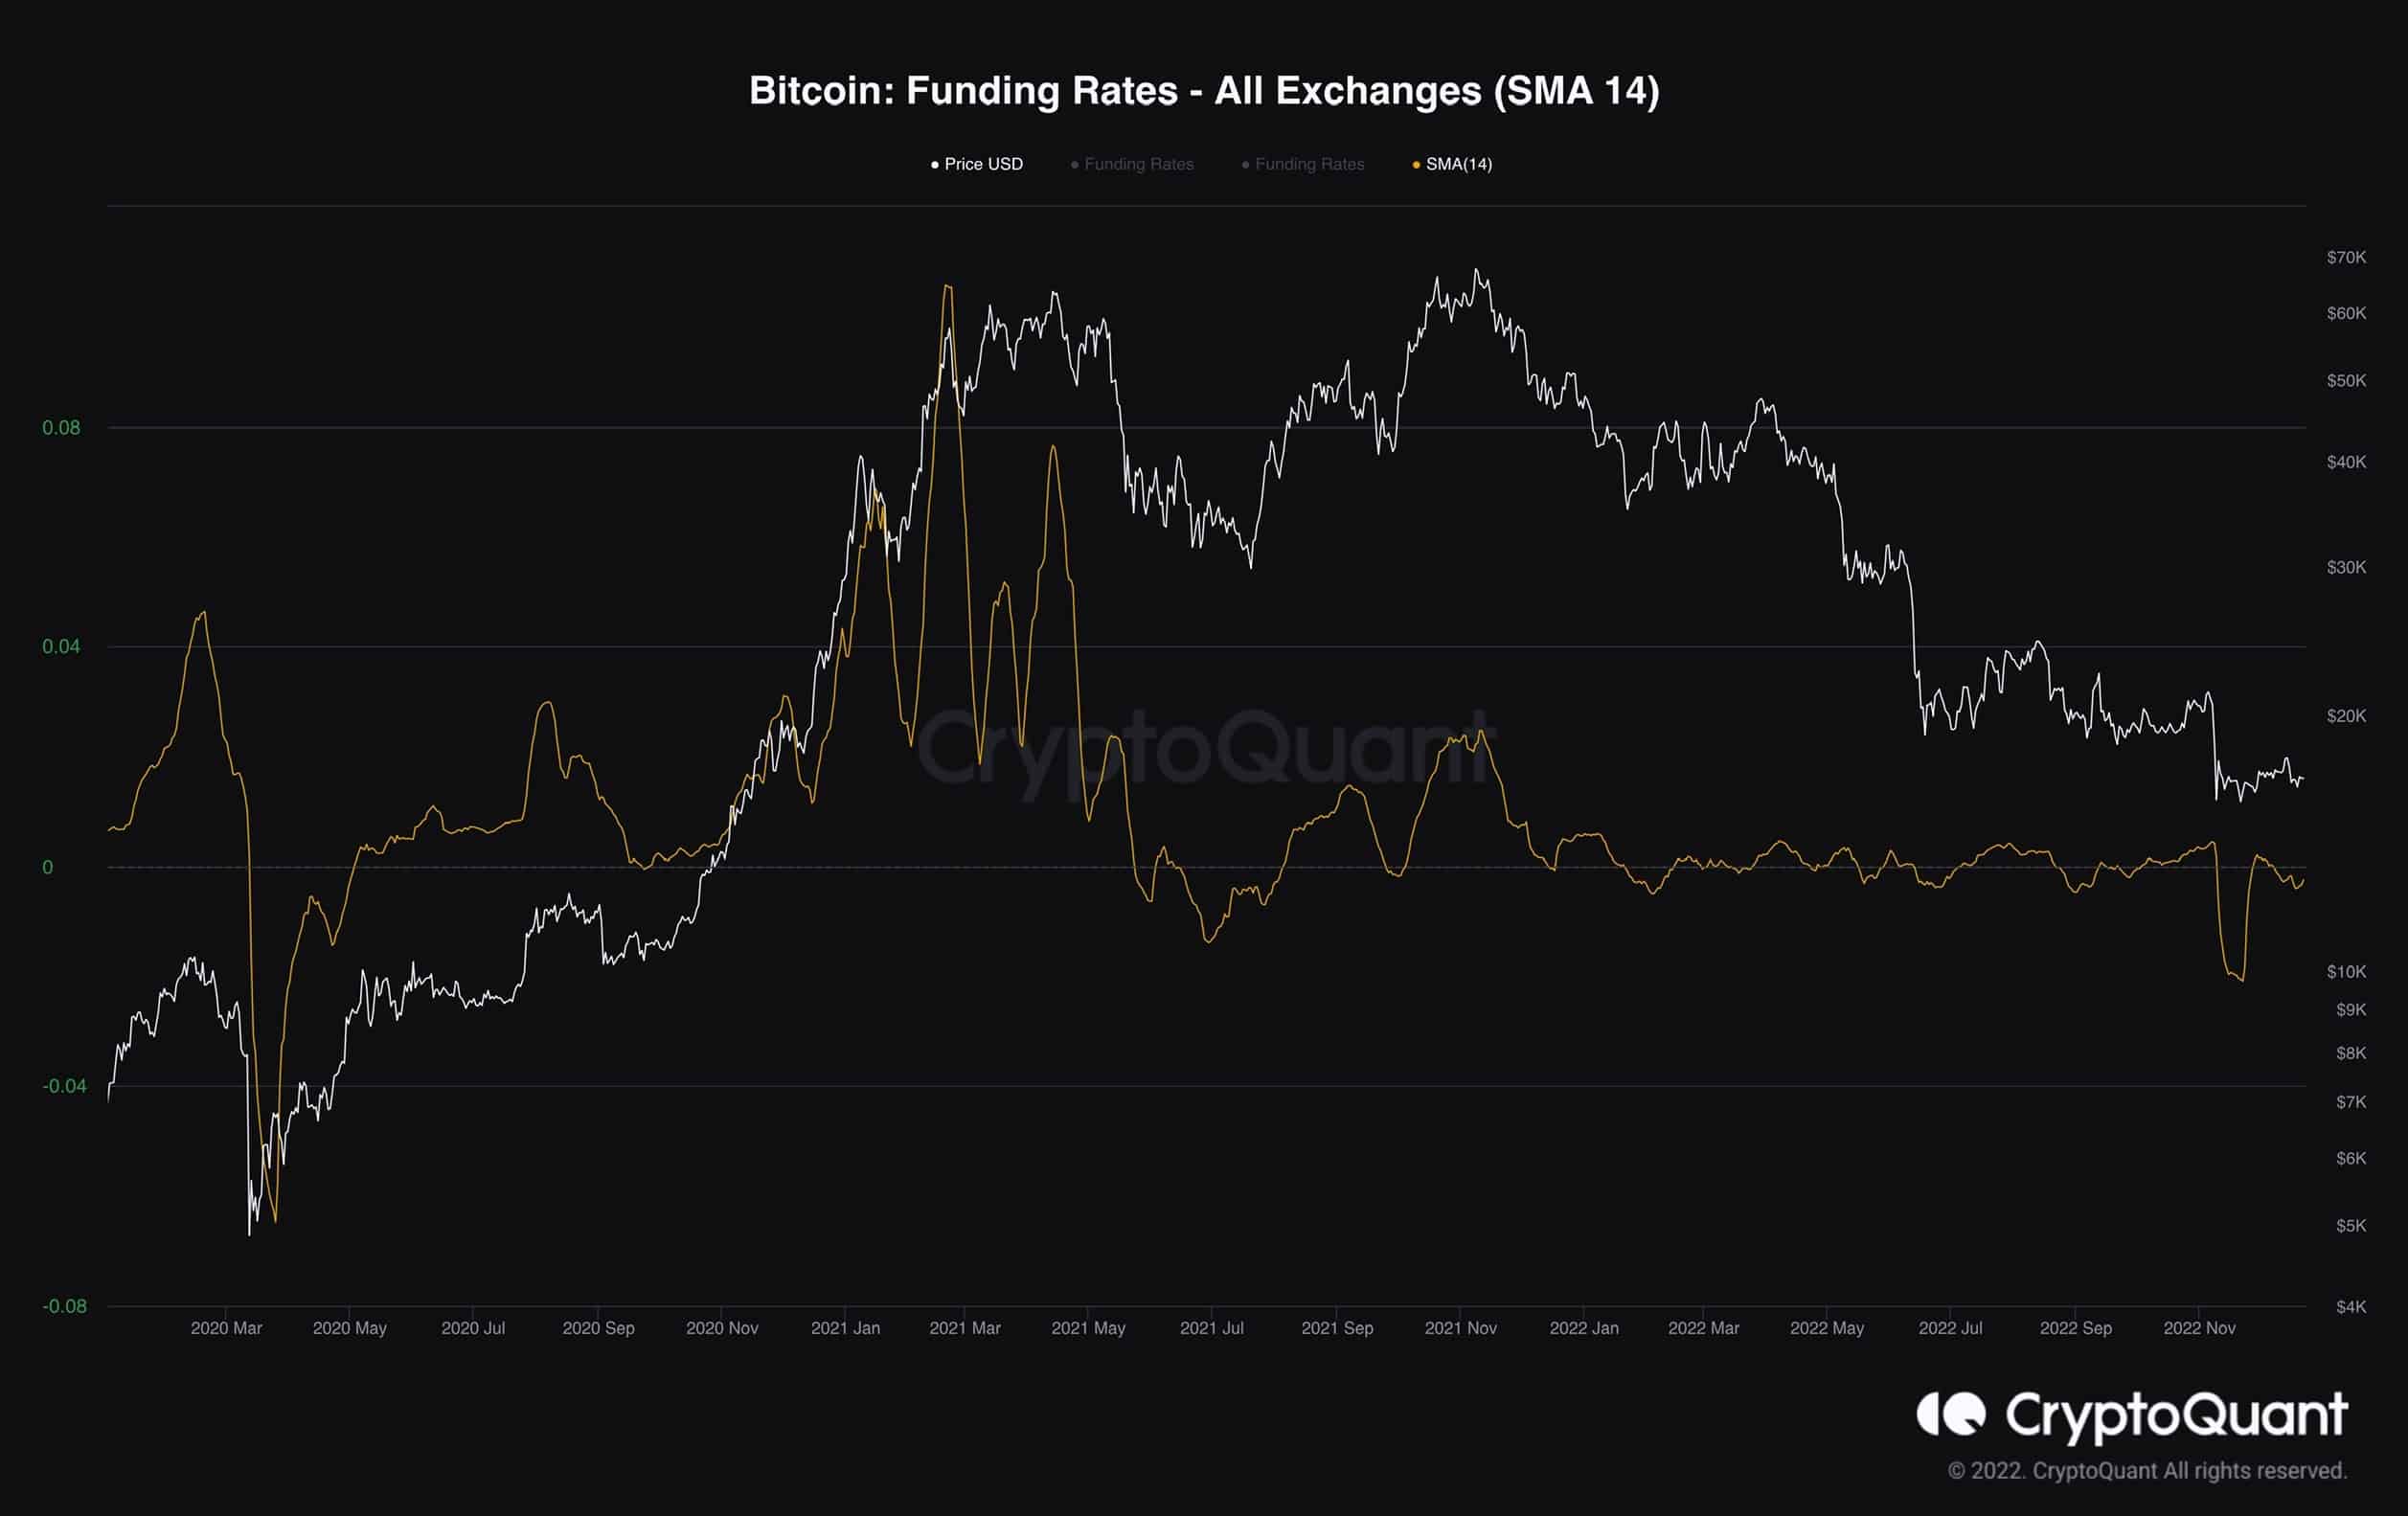
Finally, based on the following graph, compared to the COVID and China-ban crashes, the funding rates metric seems to have rebounded much faster. It illustrates that the market sentiment is healing.